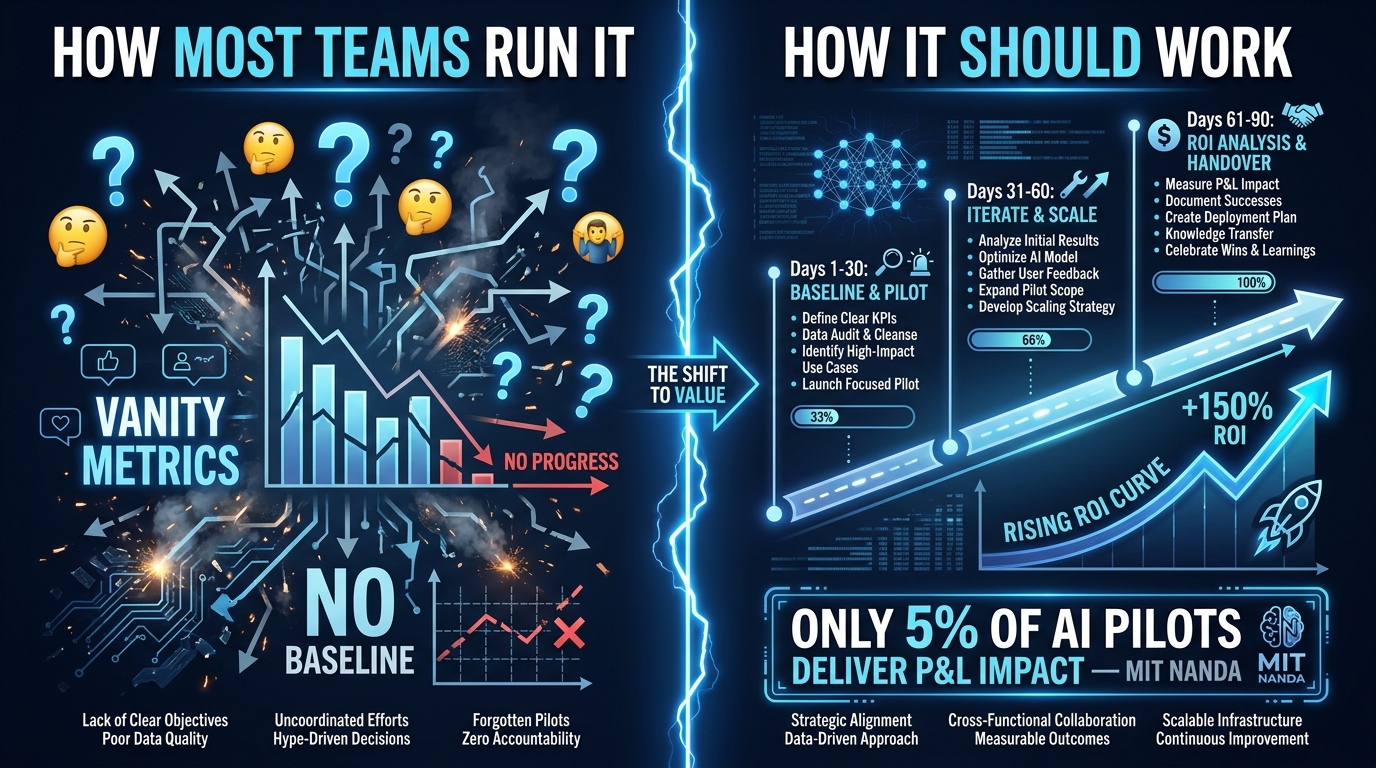

Here is a number worth sitting with: 95% of enterprise generative AI pilots show no measurable profit-and-loss impact within six months of deployment. That finding comes from MIT’s NANDA initiative, drawn from 150 executive interviews, 350 employee surveys, and 300 actual AI projects. The budget spent across those pilots runs into the tens of billions of dollars.
The instinct when you read a number like that is to blame the technology. The models aren’t ready. The tools are overhyped. AI is a vendor story, not a business reality.
But that interpretation misses the actual finding. The MIT NANDA report is careful about what “failure” means here. The 95% that produced no P&L impact didn’t fail because the AI performed badly. They failed because the experiment itself was designed in a way that made measurement impossible. No baseline. No control. No pre-registered success criteria. No defined endpoint that forces a real decision.
The 90-day AI automation experiment has become a standard piece of enterprise vocabulary. Strategy decks reference it. Budget approvals invoke it. But most 90-day timelines are not experiments in any meaningful sense — they are trials, and trials are not experiments. A trial tells you whether something ran. An experiment tells you whether something worked, by how much, and whether it’s worth continuing.
This post is about the difference. It covers how to pick the right process before you touch a tool, how to build the measurement architecture that makes results defensible, what the full cost stack actually looks like, what to do in each 30-day phase, and how to make the scale-or-kill decision at day 90 with evidence rather than hope.
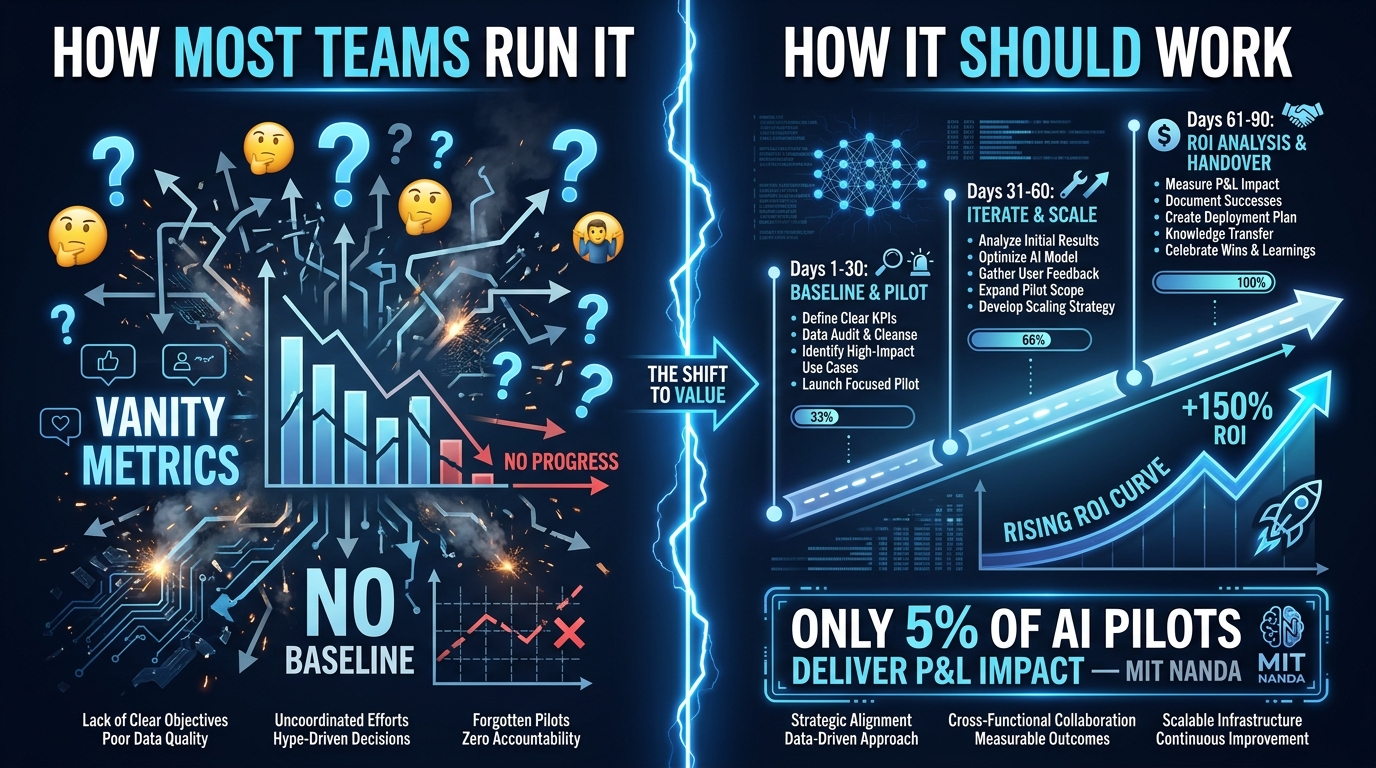
Why the “90-Day AI Pilot” Became a Trap
The 90-day timeframe became popular because it sounds rigorous. It’s long enough to suggest seriousness and short enough to fit a budget cycle. But the framing itself creates a set of structural problems that explain why so many of them never convert to real business value.
The Vanity Metric Problem
Most 90-day pilots end with a readout full of operational metrics: time saved per week, tasks processed, error reduction rates, user satisfaction scores. These are real numbers — and they can be genuinely impressive. A document review process that used to take six hours now takes 40 minutes. A customer support ticket classifier running at 91% accuracy. An invoice extraction workflow processing 500 documents per day without human touch.
None of those figures, on their own, tell you whether the business is better off. Time saved per week only becomes ROI if the saved time is redirected to higher-value work. Error reduction only matters if the errors you’re catching were costing money to fix. Automation throughput only translates to financial impact if processing volume is actually a bottleneck.
The gap between operational wins and financial impact is where 90-day pilots go to die. Teams report upward on the metrics they have, which are operational. Executives and finance teams evaluate success through the lens of P&L contribution, which requires entirely different data. When those two frames collide at the end of a pilot, the result is usually a verdict of “promising, needs more time” — which is another way of saying the experiment produced no conclusion.
The Absence of a Null Hypothesis
Real experiments have a null hypothesis — a specific, falsifiable statement of what “no effect” looks like. In a rigorous AI automation experiment, that might be: “Automating this document classification process will not reduce cost per task below the current fully-loaded human cost of $14.20, nor improve throughput beyond current capacity, within 90 days.”
If your pilot doesn’t have something like that written down before it starts, you’re not running an experiment. You’re running a demo. And demos always end the same way: the technology works as advertised, everyone agrees it’s interesting, and nobody has the data to justify scaling the budget.
The “We’ll Figure Out the Metrics Later” Problem
According to recent practitioner research, the most common failure pattern in AI automation pilots is defining success criteria after the pilot has produced its results. This is backwards — and it’s not an accident. When metrics are defined retrospectively, the natural tendency is to select the ones that show the best performance. The result is a confirmation exercise, not a measurement exercise.
Pre-registration — committing in writing, before the experiment begins, to the specific metrics and thresholds that will determine its outcome — is the most important discipline in experiment design. It’s also the one most frequently skipped when teams are under pressure to show progress.
The Opportunity Scoring Grid: Picking the Right Process First
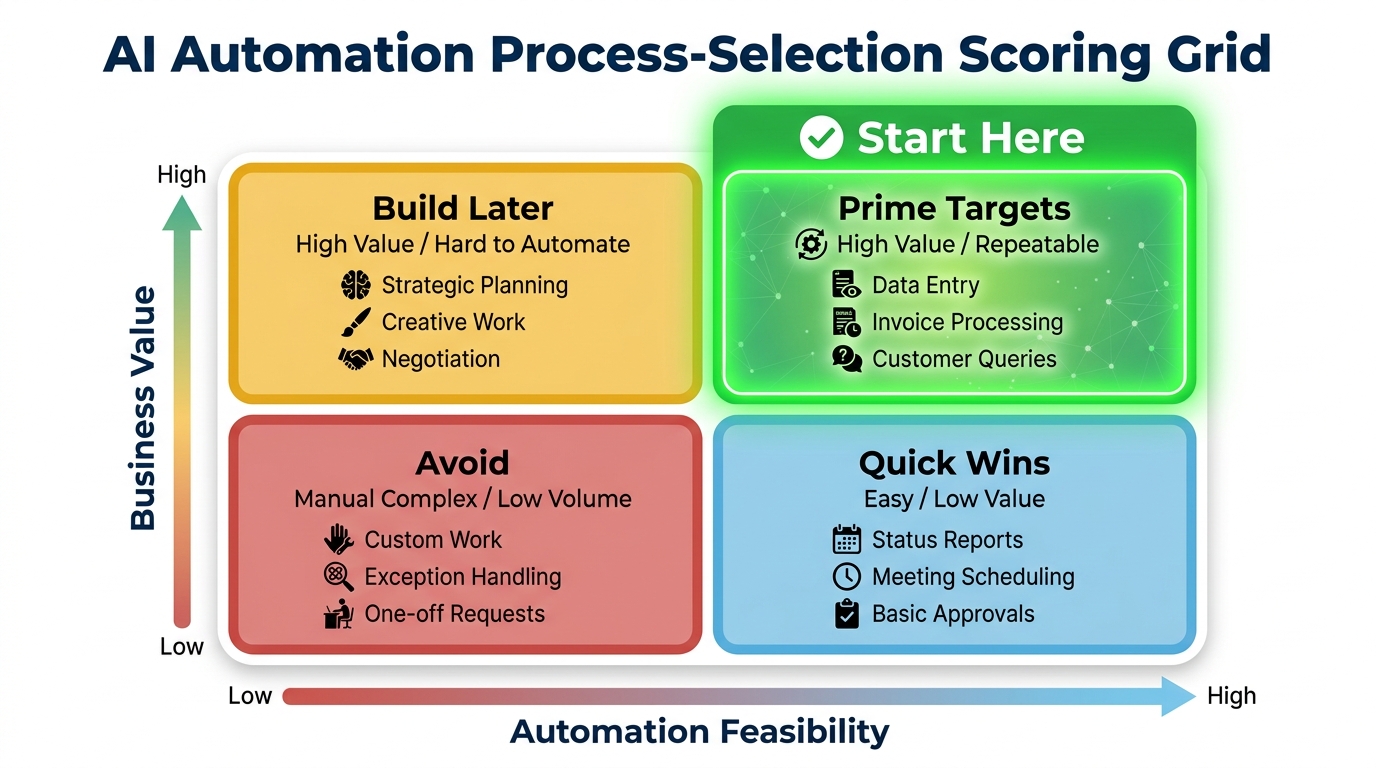
Before any discussion of tools, timelines, or budgets, there is a more fundamental question: is this the right process to automate? Most teams skip this question. They arrive at a pilot with a process already selected — usually the one that was easiest to propose, or the one a particular vendor demo made look compelling. That’s backwards. Process selection is the highest-leverage decision in the entire experiment.
The Seven-Factor Scoring Model
The most robust process-selection frameworks used in 2026 score candidate processes across seven factors on a 1–5 scale. The highest scores surface the best experiment candidates.
- Volume and frequency (1–5): How many times does this process run per day/week? High-frequency processes compound automation savings much faster. A process that runs 50 times per day creates 18 times more opportunity than one that runs 3 times per week.
- Standardization (1–5): How consistent are the inputs, steps, and expected outputs? Processes with high variability — where judgment calls are frequent and exceptions are the rule — produce poor automation candidates regardless of tool sophistication.
- Data availability (1–5): Does sufficient historical data exist to train, configure, and validate the automation? A process with 18 months of clean, structured historical data scores 5. One relying on ad hoc email chains and tribal knowledge scores 1.
- Error cost (1–5): What is the financial or operational cost of getting this wrong? High-error-cost processes — financial reporting, compliance checks, customer-facing outputs — have both high upside and high risk. Score based on the impact of errors at your current human error rate.
- Measurability (1–5): Can you define a clear, quantifiable before/after metric? If you can’t articulate what “better” looks like in a number, the process is not ready for an ROI-first experiment.
- Current performance pain (1–5): How significant is the current operational friction? High pain (backlogs, overtime, escalations, SLA misses) indicates room to improve. Low pain suggests limited upside even with a perfect automation outcome.
- Integration feasibility (1–5): How complex is the technical integration required to connect AI tooling to existing systems? A process already operating in a modern API-connected stack scores higher than one embedded in legacy on-premise infrastructure with no integration layer.
Any process scoring below 21 out of 35 should be deferred. Processes scoring 28 or above are strong first-experiment candidates. The sweet spot for a first 90-day experiment is a process in the 24–32 range — high enough value to be meaningful, low enough complexity that the experiment doesn’t collapse under integration weight.
The “Avoid the Interesting Problem” Rule
There is a persistent tendency to select processes that are intellectually interesting rather than financially important. Complex document analysis, multi-step reasoning workflows, and ambitious agentic pipelines generate better demos and more interesting technical conversations. They also have a dramatically lower success rate in 90-day experiments because they require longer development cycles, produce less predictable outputs, and are much harder to baseline and measure.
The best first-experiment processes are boring. Repetitive document extraction. Structured data classification. Rule-based routing decisions. These processes tend to score high on standardization and measurability, which are the two factors that most predict a defensible outcome within 90 days.
The Baseline Trap: Why Most Teams Skip the Most Critical Step
If the opportunity scoring grid is about picking the right process, the baseline is about establishing what “right” means numerically. A baseline is the pre-automation state of the process, measured with enough precision to make a before/after comparison statistically credible.
In practice, most teams do not have a baseline when they start a pilot. They have a general sense that the current process is slow or error-prone, a rough estimate of how many staff-hours it consumes, and an optimistic guess about how much that costs. That is not a baseline. That is an assumption, and assumptions cannot generate defensible ROI.
What a Real Baseline Looks Like
A proper baseline for an AI automation experiment should include at minimum:
- Current cycle time per task: Not a rough estimate. A measured average, from a sample of at least 30 real task instances, with a standard deviation. This matters because process variability directly affects how much improvement is statistically detectable.
- Current error rate: How frequently does the human-run process produce an output that requires correction, rework, or escalation? Measured from actual production data, not guessed from memory.
- Fully-loaded cost per task: Not hourly wage, but fully-loaded cost — salary including benefits, overhead allocation, supervision time, correction/rework cost. In 2026, fully-loaded labor costs typically run 1.3–1.6x base salary once benefits, space, and systems overhead are included.
- Current throughput ceiling: The maximum number of tasks the current team can process per day/week at sustainable capacity. This is the number the automation needs to beat, not just match.
- Exception rate: What percentage of tasks require human judgment that falls outside standard process rules? This is the number that will determine your automation coverage rate, and it is almost always higher than people expect.
Baseline measurement should take two to three weeks before any automation work begins. This is not wasted time. It is the investment that makes every subsequent measurement meaningful.
The Minimum Measurement Period
A baseline drawn from one week of data is unreliable. A baseline drawn from two to four weeks accounts for the normal variability in process volume, team composition, and seasonal patterns that affect most operational workflows. If the process has strong seasonal variation (end-of-month reporting cycles, for example), the baseline window needs to extend to cover at least one full cycle. Baselines built on unrepresentative periods produce false comparisons that can make mediocre automations look like wins and genuine wins look average.
Building the Experiment Architecture: Hypothesis, Control, and Guardrails
With the right process selected and a real baseline established, the experiment architecture defines exactly what you are testing and how you will know whether it worked.
Writing the Hypothesis
A good experiment hypothesis for AI automation has three components: the action, the expected outcome, and the measurement window.
“Deploying AI-assisted document extraction on incoming supplier invoices will reduce cost per invoice processed from $14.20 (current baseline) to below $4.00, while maintaining an error rate below 3%, within 60 days of production deployment.”
That is testable. It names a specific process, a specific cost threshold, a specific quality constraint, and a specific time window. At the end of the experiment, you either hit it or you didn’t.
Compare that to: “AI will make our invoice processing faster and more accurate.” That is a goal. Goals are fine for strategy documents. They are useless for experiments because they cannot be falsified.
Control Group Design
The cleanest experiments use a parallel control group — a portion of the process volume that continues to run through the existing human workflow while the automation handles the rest. Where full randomization isn’t practical (because splitting a workflow introduces complexity), a time-series comparison works: measure the process for 3–4 weeks before automation, then measure again over the same period after deployment, controlling for volume differences.
The key discipline is that the control group must remain untouched. Any changes to the human process during the experiment contaminate the comparison. This requires explicit communication and buy-in from the team running the manual workflow.
Guardrail Metrics
Guardrail metrics are the boundaries that constrain the experiment — conditions under which you stop immediately regardless of efficiency gains. They prevent automation from generating financial wins at the cost of quality, compliance, or customer experience.
Common guardrail metrics in AI automation experiments include:
- Customer-facing error rate: if automated output errors reach customers above a defined threshold, pause immediately
- Regulatory compliance: any instance of the automation producing output that violates regulatory requirements triggers a mandatory review
- System stability: if the automation causes downstream system failures above a defined frequency, pause and assess
- Override rate: if human reviewers are overriding AI outputs more than 25% of the time, the automation is not performing as specified
Guardrails should be defined before the experiment begins and agreed upon by all stakeholders. Their purpose is not to make the experiment easy to kill — it’s to make the experiment trustworthy. When the results come back positive, stakeholders can be confident those results aren’t hiding quality problems.
The Hidden Cost Stack: What AI Automation Really Costs
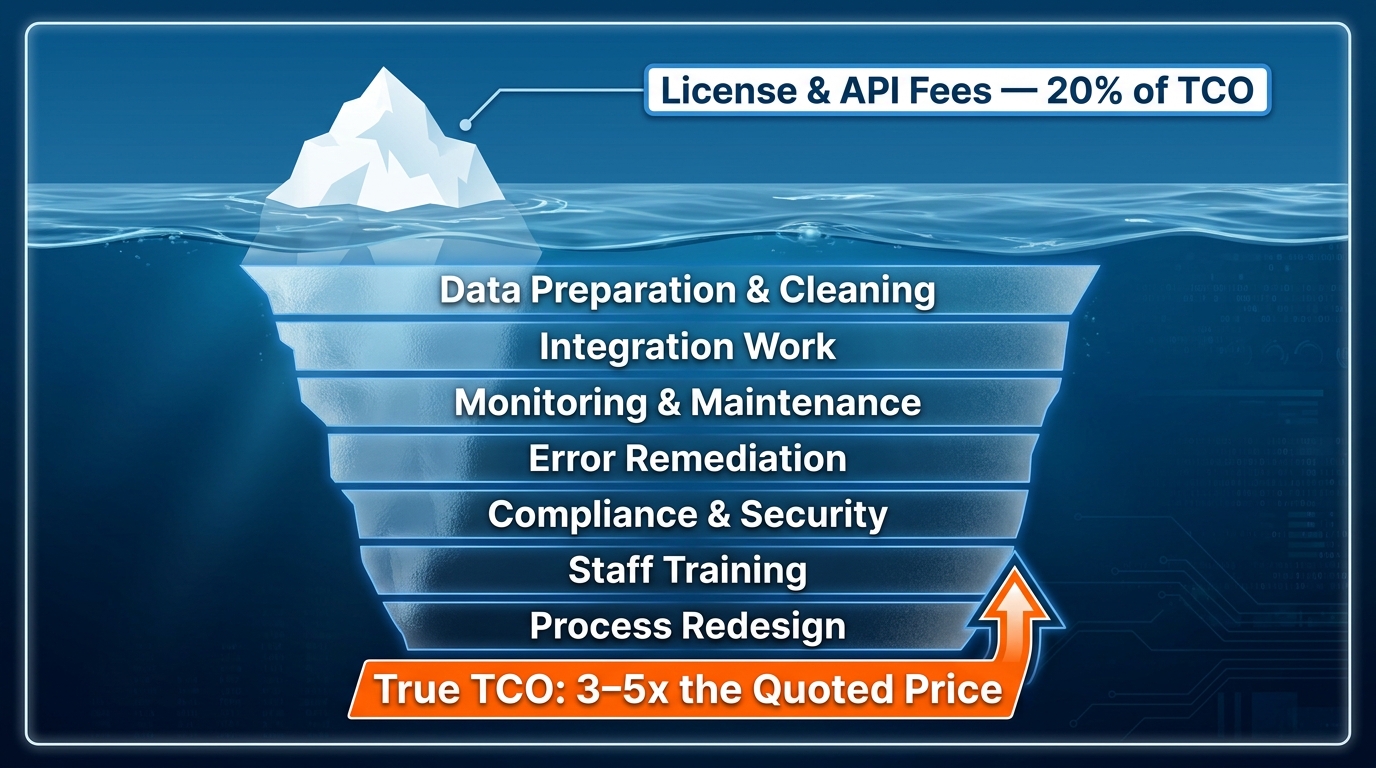
One of the most consistent findings in AI automation analysis in 2026 is that visible license and API costs represent roughly 20% of true total cost of ownership. The other 80% is submerged — real, recurring, and typically absent from vendor proposals and internal business cases.
The Visible Layer
The costs teams budget for, and usually get approximately right, include:
- Tool and platform licensing: SaaS subscription fees, API access, model usage costs
- Initial build cost: Developer time, integration work, prompt engineering, initial configuration
- Infrastructure: Cloud compute, storage, networking for running automations at production volume
For context, current build costs in 2026 range from $1,500–$4,000 for simple single-step automations, $7,000–$12,000 for medium-complexity multi-step workflows, and $15,000+ for advanced AI systems with custom model integration and complex orchestration logic.
The Hidden Layer
The costs most teams underestimate or omit entirely:
- Data preparation: Cleaning, structuring, and labeling the data the automation depends on. In 2026, this accounts for roughly 15–25% of total implementation time across most enterprise projects.
- Process redesign: AI automation rarely slots neatly into an existing workflow. The workflow itself must be redesigned to accommodate where AI inputs and outputs sit. Teams that skip this step end up with automations that technically work but are routed around by staff who find the existing process easier.
- Monitoring and maintenance: Production AI systems require continuous monitoring. APIs change, data formats shift, upstream systems evolve. The “silent breakage” failure mode — where automation continues running but starts producing corrupted or degraded outputs without triggering an error — is the single most common production failure mode identified in recent research.
- Error remediation: Every automation produces some percentage of incorrect outputs. The cost of identifying, correcting, and reprocessing those outputs needs to be included in cost-per-task calculations. Many teams omit this entirely.
- Training and change management: Staff using AI outputs need training to use them effectively and to know when to override them. Adoption that stalls at 40% because the team doesn’t trust the outputs doesn’t save 60% of the cost.
- Compliance and security review: For any process touching sensitive data, regulatory review adds cost that is difficult to predict and impossible to skip.
The aggregate effect is that the first-year bill for an AI automation is typically 3–5x the quoted software and build price. This doesn’t make AI automation a bad investment — the ROI cases are real and often substantial. But it means that ROI calculations built from vendor-quoted prices are systematically optimistic, sometimes by a factor of five.
Days 1–30: The Discovery Sprint
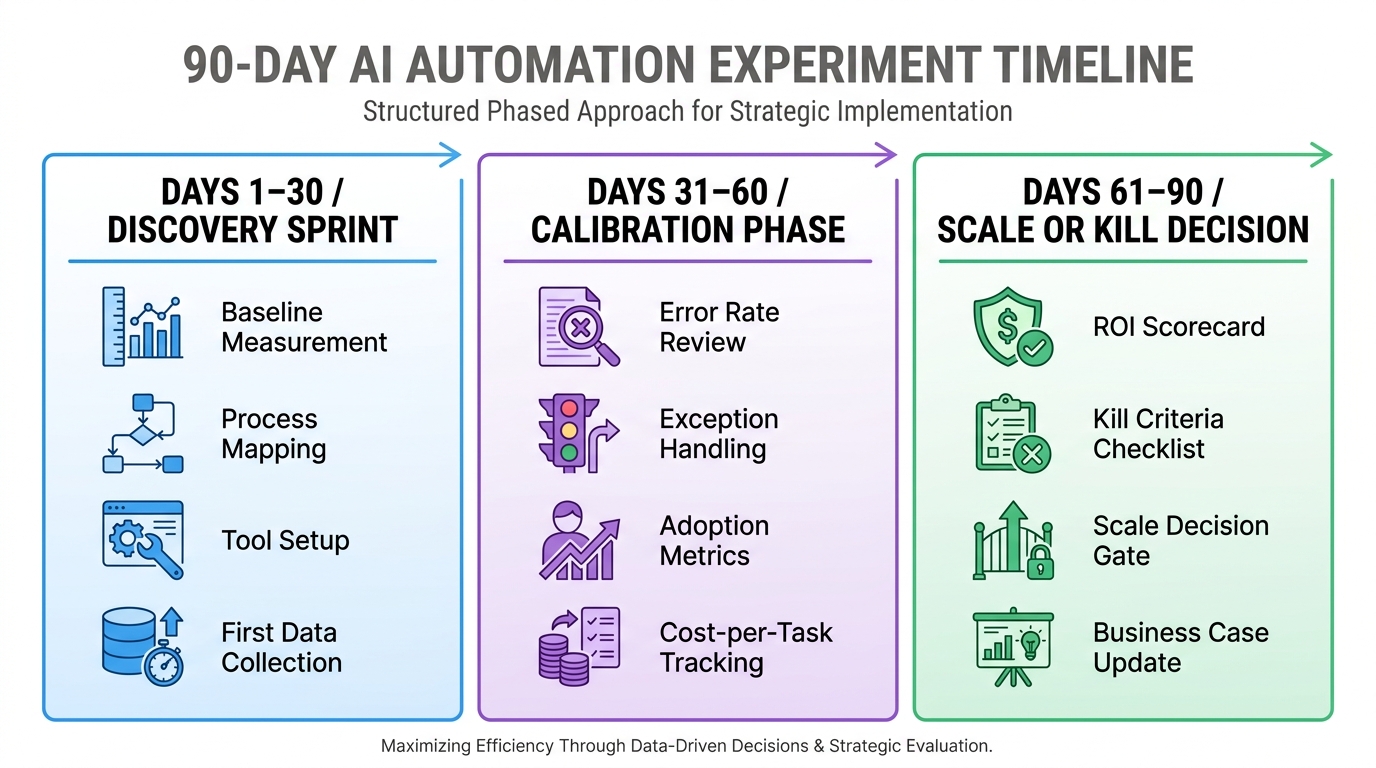
The first 30 days of an ROI-first experiment are not about automation. They are about understanding. Teams that rush to deployment in week one almost always end up spending weeks three through eight unwinding integration problems and debugging data issues that could have been caught in a structured discovery phase.
Weeks 1–2: Baseline and Process Audit
The first two weeks should be consumed almost entirely by measurement and documentation of the current state.
The core deliverable is a process map with time stamps — a step-by-step breakdown of the current workflow that includes the average time spent on each step, the handoff points between systems or people, the exception types and their frequencies, and the integration points between the process and other business systems. This is not theoretical. It should be built from direct observation of how the process actually runs, not how the process documentation says it should run. These two things are almost never the same.
During this phase, run parallel baseline measurement: capture actual task durations, error rates, and volumes using whatever logging and tracking mechanisms already exist. If none exist, this is the moment to instrument the current process so that baseline data is real, not estimated.
Weeks 3–4: Tool Configuration and Integration Sandbox
With a clear baseline and process map in hand, weeks three and four focus on configuring the automation in a non-production environment. This means building the integration connections, testing on historical data from the baseline period, and checking output quality against known-good examples.
Key questions to answer before moving to production:
- What is the automation’s accuracy rate on historical data? Is it above the threshold defined in the hypothesis?
- What types of inputs produce the worst outputs? Are these inputs that appear frequently in production, or edge cases?
- What does the exception routing look like — when the automation flags a task for human review, who gets it, how quickly, and through what channel?
- What is the monitoring setup? How will you detect degraded performance before it becomes a production problem?
The end-of-Day-30 checkpoint should produce a production readiness scorecard: automation accuracy rate on historical data, integration test results, exception handling confirmation, and monitoring configuration. If any of these is not in place, delay the production launch. The additional days spent in preparation consistently produce better 90-day outcomes than rushing to deployment to preserve a timeline.
Days 31–60: The Calibration Phase
The second 30-day phase is where the automation goes into production — but where the primary activity is calibration and observation, not optimization and expansion. Teams that immediately begin trying to optimize before they have stable production data end up making changes based on noise rather than signal.
The First Two Production Weeks: Watch, Don’t Touch
Weeks five and six should be a deliberate observation period. The automation is running on live production volume, every output is being logged, and the human review team is operating the exception handling process. But no configuration changes should be made during this window, because changes contaminate the measurement of baseline production performance.
Track daily: automation rate (percentage of tasks fully handled without human intervention), output accuracy rate, exception rate, cycle time, and override rate (how often human reviewers change the automation’s output). Compare these against the pre-automation baseline every week.
The most informative signal in this window is the override rate. If reviewers are changing AI outputs more than 15–20% of the time, there is a systematic quality problem that requires investigation — not tuning, but root cause analysis. Common causes include distribution shift (production inputs look different from the training/configuration data), prompt or configuration gaps, and integration data quality issues.
Weeks 7–8: Calibration and Error Pattern Analysis
With two weeks of stable production data, weeks seven and eight focus on two things: fixing the clear error patterns identified in the observation period, and calculating the first real cost-per-task numbers from production data.
Error pattern analysis should cluster override and correction events by type. If 80% of exceptions come from a specific input type or edge case, addressing that case specifically is likely to generate more ROI improvement than broadly retuning the model. Pareto analysis of error types consistently outperforms broad optimization in 30–90 day experiments because it concentrates improvement effort where the volume is.
The end-of-Day-60 checkpoint deliverable is a mid-experiment scorecard that compares current production metrics against the baseline and against the hypothesis targets. This is the moment to make a preliminary assessment of whether the experiment is on track to hit its targets by day 90 — and to make the difficult decisions if it isn’t.
Days 61–90: The Scale-or-Kill Decision
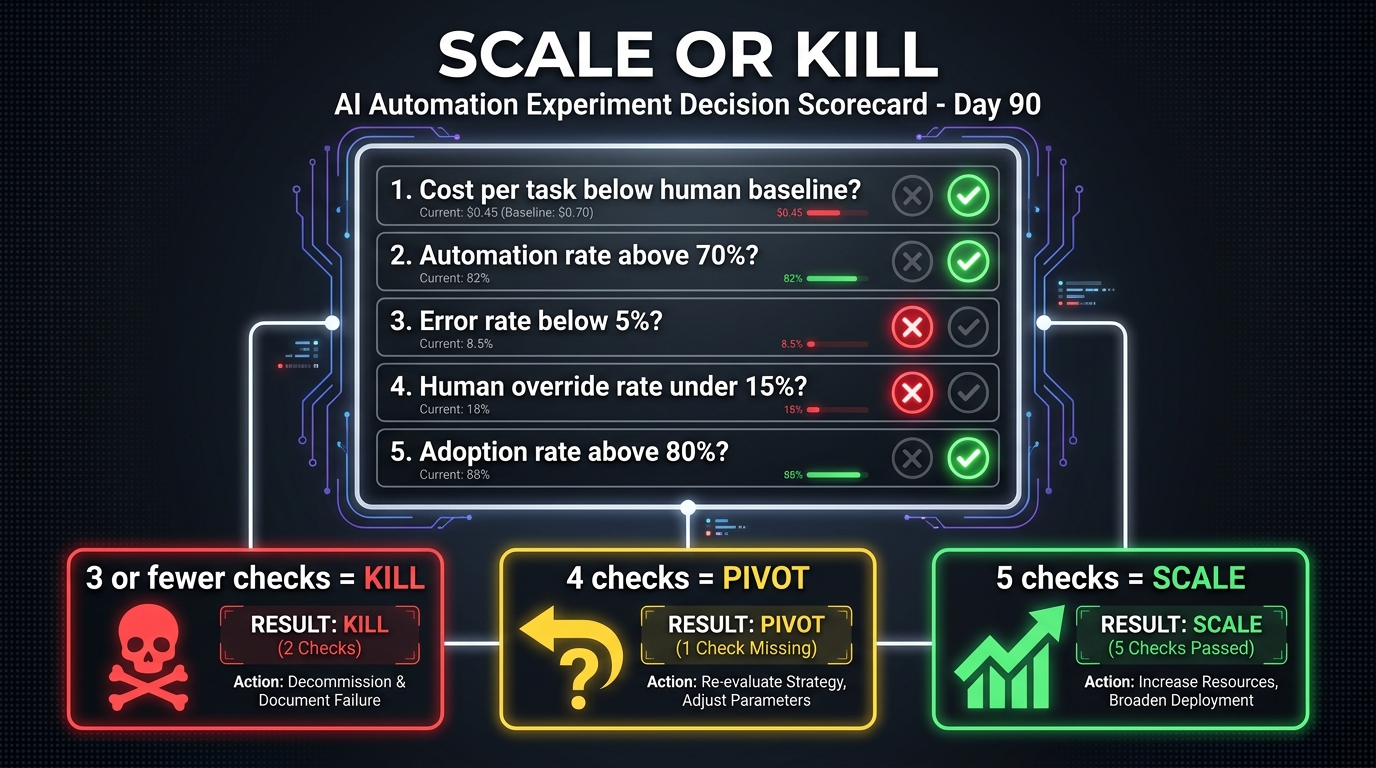
The final 30 days of the experiment have two purposes: optimizing the automation within its current scope, and generating the evidence required to make a well-supported scale-or-kill decision. Both require rigor. Neither should be improvised.
The Kill Criteria Framework
The most important design principle for the final phase is that the kill criteria were written at the start of the experiment, not in week eleven. Kill criteria specify the conditions under which you stop, regardless of how much has been invested and regardless of organizational pressure to continue.
A complete kill criterion has three components: a metric, a threshold, and a consequence. For example:
- “If cost per task has not dropped below 60% of the human baseline by day 75, we will pause the automation, conduct a root cause review, and make a go/no-go decision within one week.”
- “If the human override rate exceeds 20% at any measurement point after day 45, we will pause immediately and conduct a quality review before resuming.”
- “If adoption rate (the percentage of eligible tasks being routed through the automation) is below 65% at day 60, we will conduct a change management review before proceeding to the scale decision.”
Kill criteria exist not to make it easy to abandon projects — they exist to make the decision-making process honest. Without them, the sunk cost of 60 days of investment creates enormous psychological pressure to continue even when the data doesn’t support it.
The Three Outcomes: Scale, Pivot, or Stop
A well-designed 90-day experiment produces one of three defensible outcomes:
Scale: The automation has hit or exceeded its hypothesis targets. Cost per task is below the defined threshold. Error rate is within bounds. Adoption is high. The financial case for broader deployment is supported by actual production data, not projections. The next step is building a scaling plan with a revised business case based on measured unit economics.
Pivot: The automation is working but not to the originally specified scope. Perhaps accuracy is strong on a subset of input types but poor on others. Perhaps integration complexity pushed costs above the target. A pivot redefines the scope to where the ROI case is real — deploying only on the high-accuracy input segment, for example — and makes a scaled business case for that narrower scope. This is a legitimate and often valuable outcome.
Stop: The automation is not producing the expected financial or operational improvement, and the analysis indicates that the root causes are not fixable within reasonable additional investment. Stopping is a success when it prevents the company from scaling a technology that doesn’t work for this specific process. The learnings from a disciplined stop are almost always more valuable than the learnings from an indefinitely continued experiment that never produces a clear answer.
Unit Economics: Calculating Real Cost Per Task vs. Human Baseline
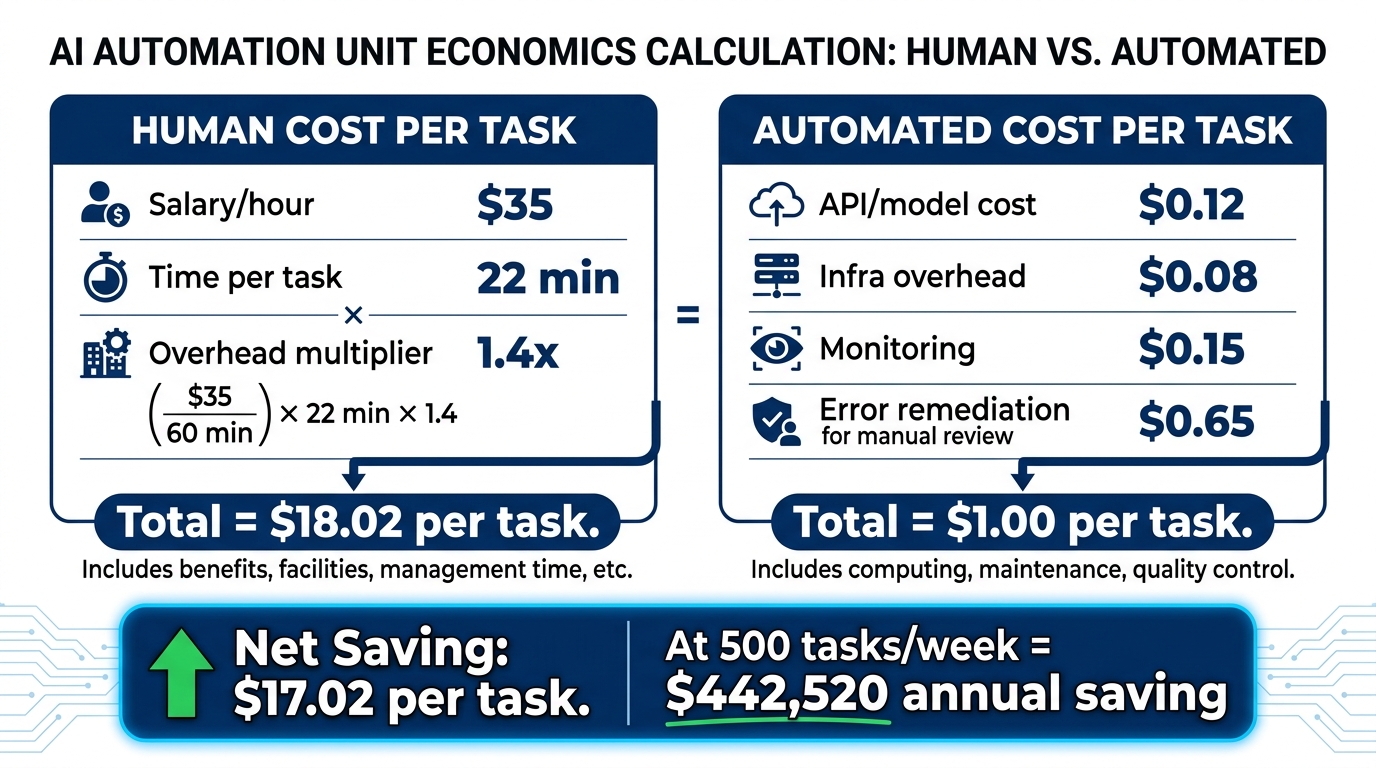
Unit economics are the financial core of an ROI-first experiment. They translate operational performance data into the language that finance teams, executives, and board members can evaluate against other investment decisions.
The Cost Per Successful Task Formula
The industry standard for AI automation unit economics in 2026 centers on cost per successful task — not cost per task attempt, but cost per task that produces a correct, usable output without requiring human correction.
Human baseline cost per successful task:
Start with the fully-loaded hourly cost of the staff running the process. For a typical operations role in 2026, base salary plus benefits plus overhead typically produces a fully-loaded cost of $28–$45 per hour depending on function and geography. Divide that by the number of tasks completed per hour (adjusted for the percentage that require rework). This gives you the human cost per successful task.
Example: Fully-loaded cost of $38/hour. 4 tasks completed per hour. Rework rate of 8%. Effective successful tasks per hour: 3.68. Human cost per successful task: $38 ÷ 3.68 = $10.33.
Automated cost per successful task:
Sum all automation costs — model/API fees per task, infrastructure overhead per task, amortized build cost per task (total build cost divided by expected total task volume over 12 months), monitoring overhead per task, and error remediation cost per task. Divide total by automation’s successful task rate.
Example at moderate volume (500 tasks/week, 26,000 tasks/year): API cost $0.12, infrastructure $0.08, amortized build cost $0.58 ($15,000 build ÷ 26,000 tasks), monitoring $0.10, error remediation $0.40. Total cost per task attempt: $1.28. Automation accuracy rate: 94%. Automated cost per successful task: $1.28 ÷ 0.94 = $1.36.
Net saving per task: $10.33 – $1.36 = $8.97. At 500 tasks per week: $8.97 × 500 × 52 = $233,220 annual saving.
The Payback Period Calculation
With unit economics established, payback period is straightforward: total investment cost divided by annual net saving.
In the example above: $15,000 build cost + $8,000 first-year operational overhead = $23,000 total first-year investment. $233,220 annual saving. Payback period: 36 days.
That figure should be validated against the actual production data from the 90-day experiment. If the real cost per task from production observation matches the modeled figure, the payback calculation is credible. If they diverge, understand why before presenting the business case — the production data is always more reliable than the model.
What to Do When the Math Doesn’t Work
Not every process produces unit economics that justify automation at current costs. When the modeled cost per automated task exceeds the human baseline, the options are: increase task volume (so build costs amortize over more tasks), identify error pattern fixes that improve accuracy and reduce remediation cost, or accept that this process is not currently an automation candidate and move to the next one on your opportunity scoring grid.
The discipline of working through the unit economics honestly — including when they don’t support the business case — is what separates ROI-first experimentation from technology adoption for its own sake.
The Governance Layer Most Experiments Ignore
Even well-designed experiments with strong unit economics fail at scale when governance infrastructure is missing. Governance in this context means the operational systems and accountabilities that keep the automation producing reliable outputs over time — not just during the 90-day experiment window.
The “Silent Breakage” Problem
The single most common production failure mode identified in recent AI automation research is what practitioners call silent data breakage: upstream APIs change their data formats, input schemas shift, new edge cases appear in production that weren’t in the training or configuration data — and the automation continues running without throwing an error, producing increasingly degraded outputs that human reviewers may not catch until significant downstream damage has occurred.
The defense against silent breakage is monitoring infrastructure built before the automation goes to production, not added as an afterthought after the first incident. At minimum this requires:
- Automated quality sampling: a system that randomly samples a defined percentage of automation outputs and routes them to human review to check for degradation
- Distribution monitoring: alerts that fire when the distribution of input types shifts significantly from the baseline used for configuration
- Output consistency checks: automated validation that outputs conform to expected schemas and value ranges, not just that the process completed without errors
Ownership and Accountability
Automations that lack a designated owner degrade over time. Designating an automation owner — a specific person or team responsible for monitoring performance, managing exception escalations, and making configuration updates — is the governance decision most closely correlated with long-term automation performance, according to recent implementation research.
Ownership includes three responsibilities: monitoring (reviewing performance metrics on a defined weekly cadence), maintenance (managing configuration updates as inputs and requirements evolve), and escalation (making the call when performance falls below acceptable thresholds and triggering the appropriate response).
Documenting the “Why This Way” Logic
Automations built by one team and handed to another team to operate consistently suffer from what practitioners call configuration archaeology — the situation where the team maintaining the automation doesn’t know why specific configuration choices were made and therefore doesn’t know which things are safe to change and which will break the automation.
Documenting the reasoning behind configuration decisions — not just what the configuration is, but why it was designed that way, what alternatives were considered, and what tests validated the current approach — is one of the highest-return governance investments available in a 90-day experiment. It costs relatively little time during the experiment and saves enormous time in the maintenance phase that follows.
Six Non-Negotiables for a 90-Day Experiment That Delivers
The gap between the 95% of AI pilots that produce no measurable P&L impact and the 5% that do is almost never a technology gap. It’s a discipline gap. The experiments that produce real, defensible, scalable ROI do six things consistently that the majority do not.
- They select processes using a scoring framework, not intuition or vendor demos. High opportunity score means high frequency, high standardization, high data availability, and clear measurability. Low opportunity score means defer, regardless of how compelling the tool demonstration looked.
- They build a real baseline before any automation work begins. Actual measured cycle times, error rates, and fully-loaded costs from a representative production period. Not estimates, not vendor benchmarks, not team recollections. Measured data.
- They write the hypothesis and kill criteria before the experiment starts. Specific, falsifiable, pre-committed. The success threshold is defined before anyone has seen the results. This removes the retrospective flexibility to call anything a win.
- They account for the full cost stack. License fees, build costs, data preparation, integration work, monitoring, error remediation, and change management — all included in the unit economics calculation. ROI built on visible costs only produces business cases that fall apart at scale.
- They enforce the observation discipline in weeks five and six. No configuration changes during the initial production observation window. The urge to optimize immediately is nearly universal, and nearly universally counterproductive. Stable observation data is what makes the calibration phase in weeks seven and eight actually work.
- They treat “stop” as a valid and valuable outcome. An experiment that cleanly determines a process is not a good automation candidate at current costs and technology — and documents exactly why — has produced real value. It redirects investment toward better candidates and prevents the organization from scaling something that doesn’t work. The discipline to stop when the evidence supports stopping is what distinguishes experimenters from optimists.
The 90-day AI automation experiment, designed and executed as an actual experiment, is one of the most reliable investment frameworks available to operations and technology leaders in 2026. The failure rate in the industry is real — but it is not inherent to the technology or the timeframe. It is a function of how experiments are designed. Change the design, and you change the outcome distribution.
The playbook is not complicated. Pick rigorously. Baseline obsessively. Hypothesize specifically. Cost honestly. Observe patiently. Decide decisively. The teams doing all six of these consistently are the ones landing in the 5% — and increasingly, they’re the ones with a growing portfolio of proven automations to show for it.