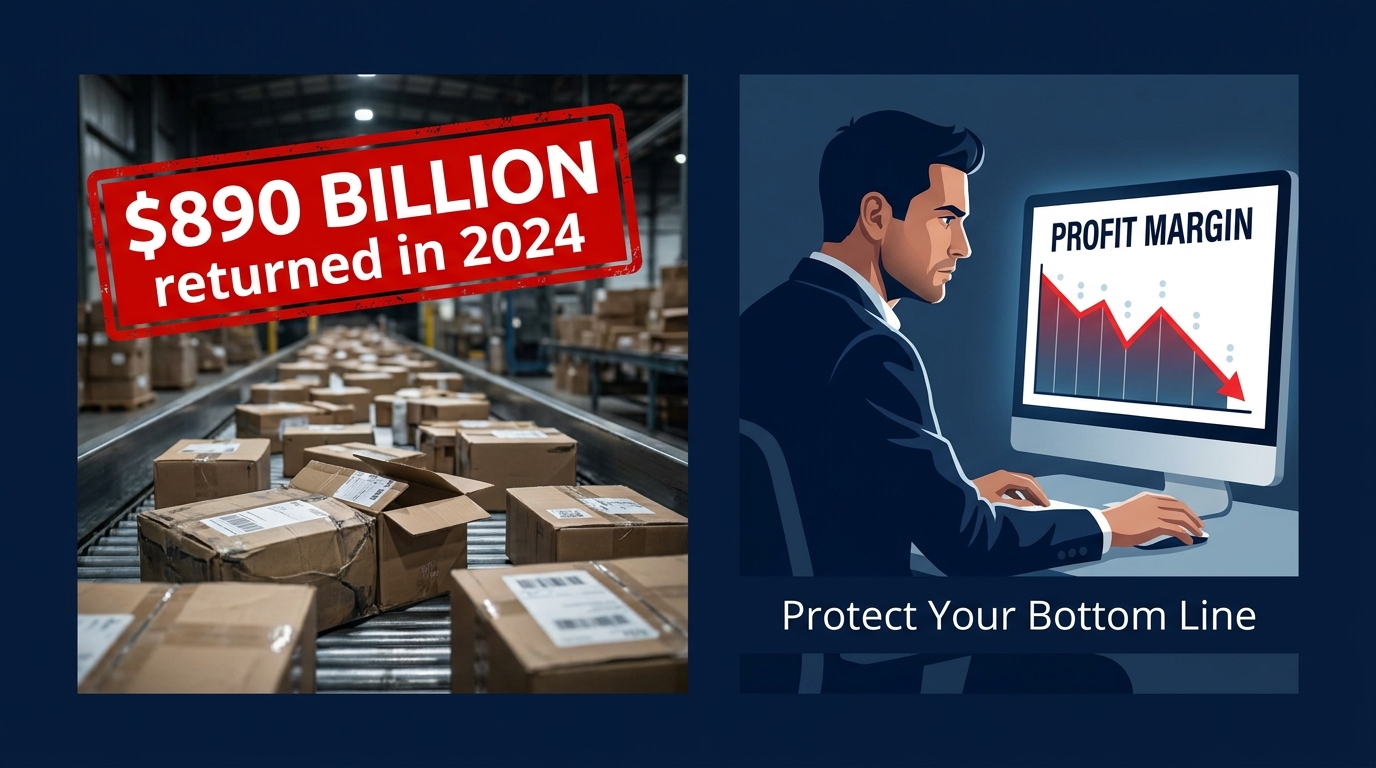

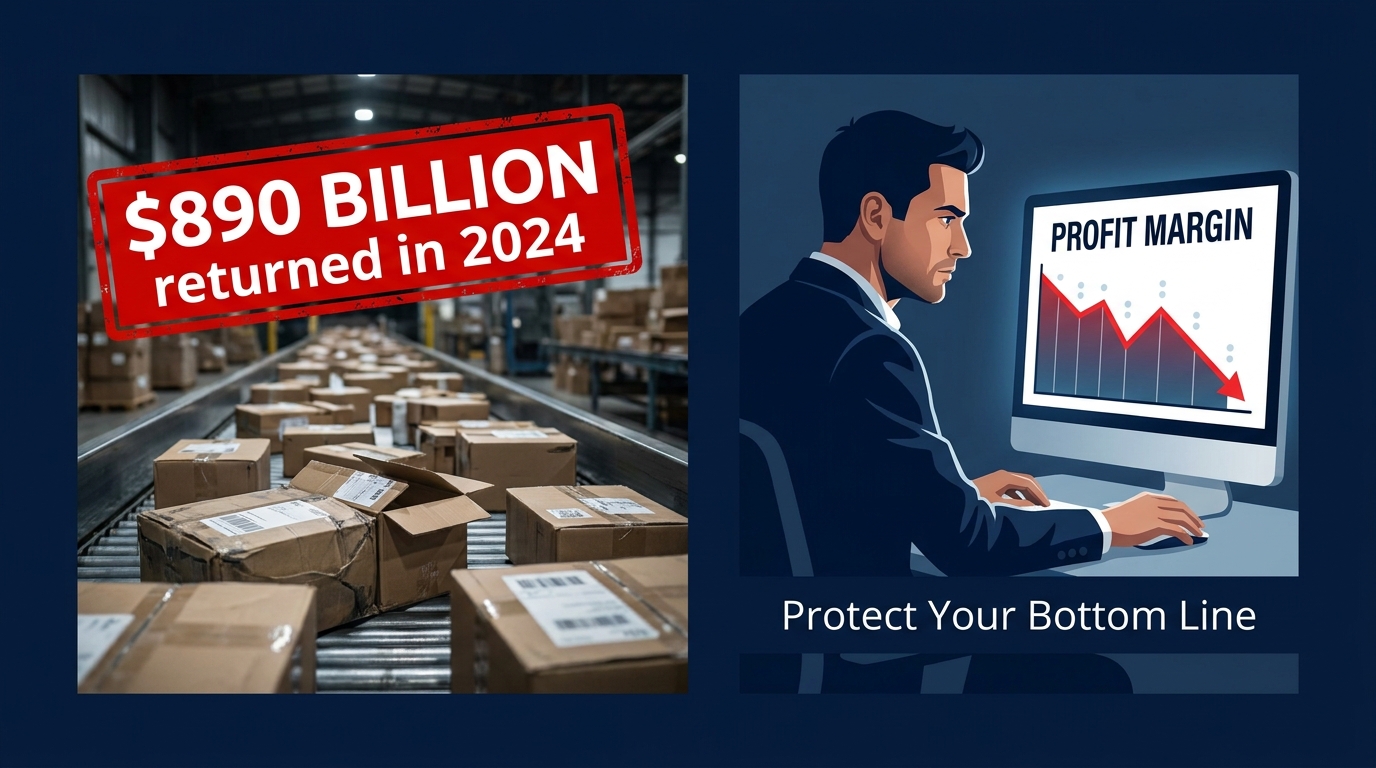
There is a number that should sit uncomfortably at the center of every seller’s P&L review: $890 billion. That is the value of merchandise consumers returned to U.S. retailers in 2024, according to the National Retail Federation. In 2026, the trend has not reversed — it has compounded. Ecommerce return rates are now sitting at 19–21% of online orders, meaning roughly one in five items you ship will come back. The average all-in cost to process that return? $25 to $50 per unit, sometimes climbing to 65% of the item’s original value.
That math was already painful. Then the platforms changed the rules.
In early 2026, Amazon mandated prepaid return labels across all U.S. seller-fulfilled orders, removing high-value item exemptions that had offered some protection. Returns processing fees expanded into more product categories. Auto-refund timelines tightened. Major retail brands — Zara, H&M, and others — started charging customers for mailed returns. The entire returns economy is being repriced, and the cost burden is landing squarely on sellers.
This article is not about whether to offer returns. That question is settled — 76% of shoppers consider free returns essential when choosing where to shop, and a strict no-return policy simply moves customers to a competitor. The real question is how you design, price, and operationalize your returns program so that it protects your margin instead of quietly eroding it. That requires a different kind of thinking: less policy, more math.
The True Cost of a Return: What Most Sellers Are Undercounting
Most sellers track return rates. Far fewer accurately track the total cost of a return. This gap is where margin quietly disappears.
The Visible Costs
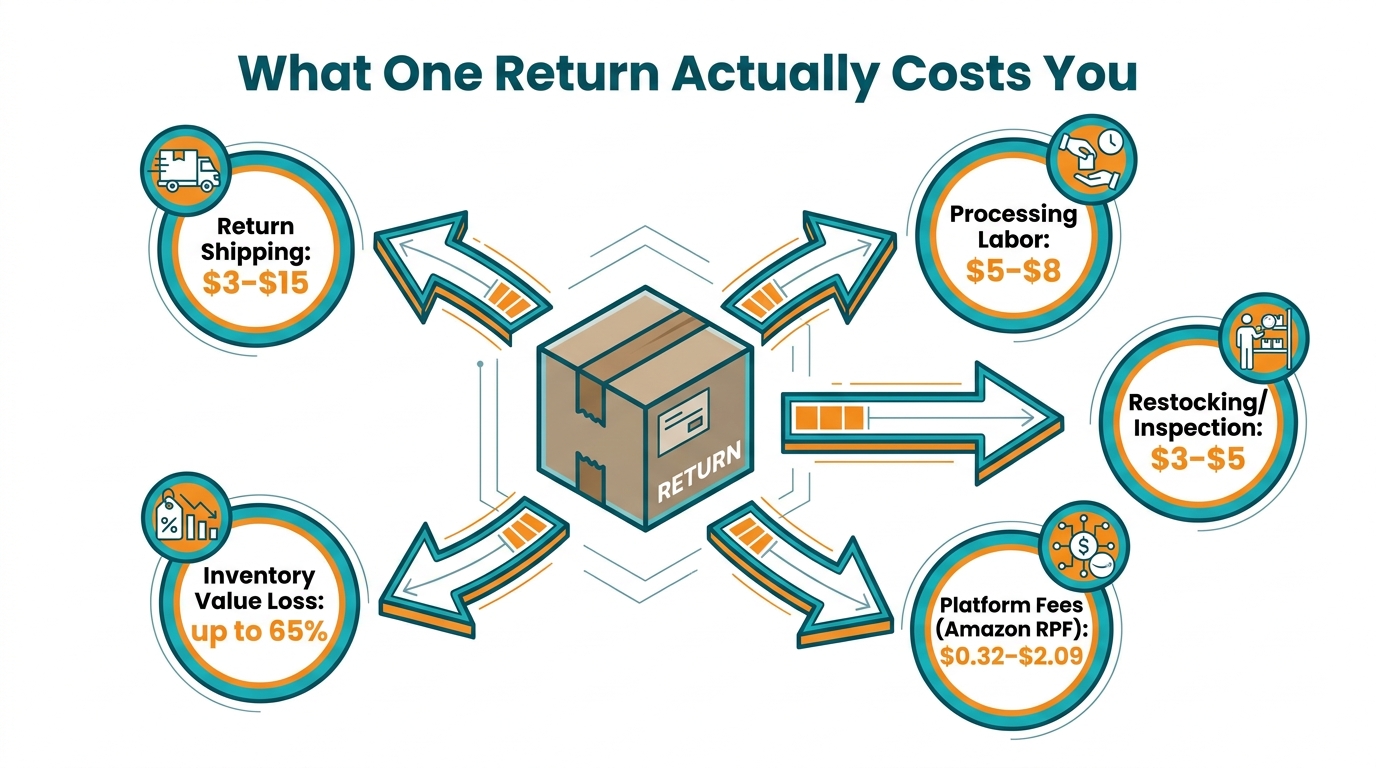
The components most operators account for are the obvious ones: return shipping ($3–$15 depending on size and carrier), basic processing labor, and refund value. For Amazon FBA sellers, the returns processing fee adds between $0.32 and $2.09 per returned unit in many standard categories, with higher charges in specialized categories. For seller-fulfilled orders, prepaid label costs now run $3–$8 for standard-size items and $10–$15+ for oversize.
These numbers are real and measurable. Most sellers are capturing them. What they’re not capturing is the rest.
The Hidden Cost Cascade
When a return arrives, you don’t just absorb the shipping cost. You absorb a cascade of downstream expenses that compound on every returned unit:
- Condition degradation: Returned items frequently arrive in below-original condition. Industry data suggests 20–30% of returned goods cannot be resold at full price. Some will be sold at a discount, some liquidated, some destroyed — each option carrying a different margin impact.
- Inspection and re-packaging labor: Someone has to evaluate each return, decide its disposition, re-ticket it if resaleable, or route it to liquidation channels. At scale, this becomes a significant labor line.
- Inventory disruption: Returned stock reappearing in your warehouse creates forecasting noise. It can mask true demand signals, inflate apparent inventory levels, and lead to ordering miscalculations that create downstream out-of-stock or overstock situations.
- Cash flow timing: Amazon’s faster auto-refund timelines mean money leaves your account before you’ve even received and inspected the return. The capital is gone; the product may not be recoverable.
- Customer service overhead: High-return products generate disproportionate inbound CS volume — questions about return status, refund timelines, exchange requests. This cost is real but rarely attributed back to the return event itself.
Add these together across a product category with a 20% return rate, and the true cost per return can comfortably exceed $50 per unit — sometimes approaching the product’s original sale price entirely. For sellers operating on 15–25% net margins, a single high-return SKU can flip a profitable product category into a loss center without ever appearing as a line item problem.
How to Build Your Actual Return Cost Model
The diagnostic exercise that changes how most operators think about this: build a per-SKU return profitability model. For each product, calculate: sale price minus COGS, minus forward shipping, minus return label, minus processing fee, minus estimated condition loss (apply a realistic percentage based on your actual return data), minus labor allocation. Run this for your top 20 highest-return SKUs. For many sellers, the result is an immediate list of products that are net-negative per unit when returns are factored in — even though the product looks profitable on the standard P&L.
This is not a theoretical exercise. It is the foundation of every margin-protection decision that follows.
What Changed in 2026: The Platform Policy Shift That Sellers Can’t Ignore
The 2026 policy environment did not change subtly. It changed in ways that structurally increased seller costs and reduced seller control — and understanding the specifics is essential for knowing where your margin exposure actually sits.
Amazon’s Mandatory Prepaid Return Labels
Effective February 8, 2026, Amazon required prepaid return labels across all U.S. seller-fulfilled orders, including items that had previously been exempt under the high-value exemption. Prior to this change, sellers fulfilling high-value items could in some cases route returns differently or negotiate alternative handling. That flexibility is gone.
The practical impact: every return on a seller-fulfilled order now carries a label cost that Amazon issues and charges back to the seller. For sellers in categories like jewelry, premium electronics, or high-end apparel — where individual item values are high but return rates were historically manageable — this change meaningfully shifts the unit economics. A $200 item returning at 5% is very different from a $200 item returning at 5% with a mandatory $12 label cost allocated to every single return.
Expanded Returns Processing Fees
Amazon’s returns processing fee, which was first introduced in 2024 for apparel and footwear, expanded further in 2026 to cover more product categories. The fee is triggered when a product’s return rate exceeds the median for its category, and it’s charged using a three-month rolling window — with charges appearing in the seventh through fifteenth day of the third month after shipment. This delayed billing creates accounting visibility problems: by the time the fee shows up, it’s applied to sales that happened months earlier, making it genuinely difficult to connect the cost to the specific product decisions that drove it.
For categories like apparel, footwear, and some consumer electronics — where return rates commonly run 25–35% — this fee is now a permanent feature of the cost structure, not an occasional penalty.
The Broader Market Trend: Charging Customers Is Becoming Normal
While Amazon’s policy changes primarily affect seller-side costs, the retail industry more broadly is shifting toward charging customers for return shipping. Zara currently charges approximately $4.95 per mailed return in the U.S. H&M charges $5.99, deducted from the refund. These fees have increased over time — earlier reporting showed lower amounts — suggesting the direction of travel is toward higher customer-facing return costs, not lower.
For direct-to-consumer brands and marketplace sellers, this creates a positioning question: do you absorb return costs to appear more competitive, or do you adopt a similar fee structure? The data on this is nuanced — about two-thirds of retailers that introduced return fees saw reduced return volumes, but some also reported fewer new sales. The fee decision is not a pure margin win; it carries conversion risk that needs to be quantified before implementation.
Return Fraud Is a Bigger Margin Problem Than Most P&Ls Show
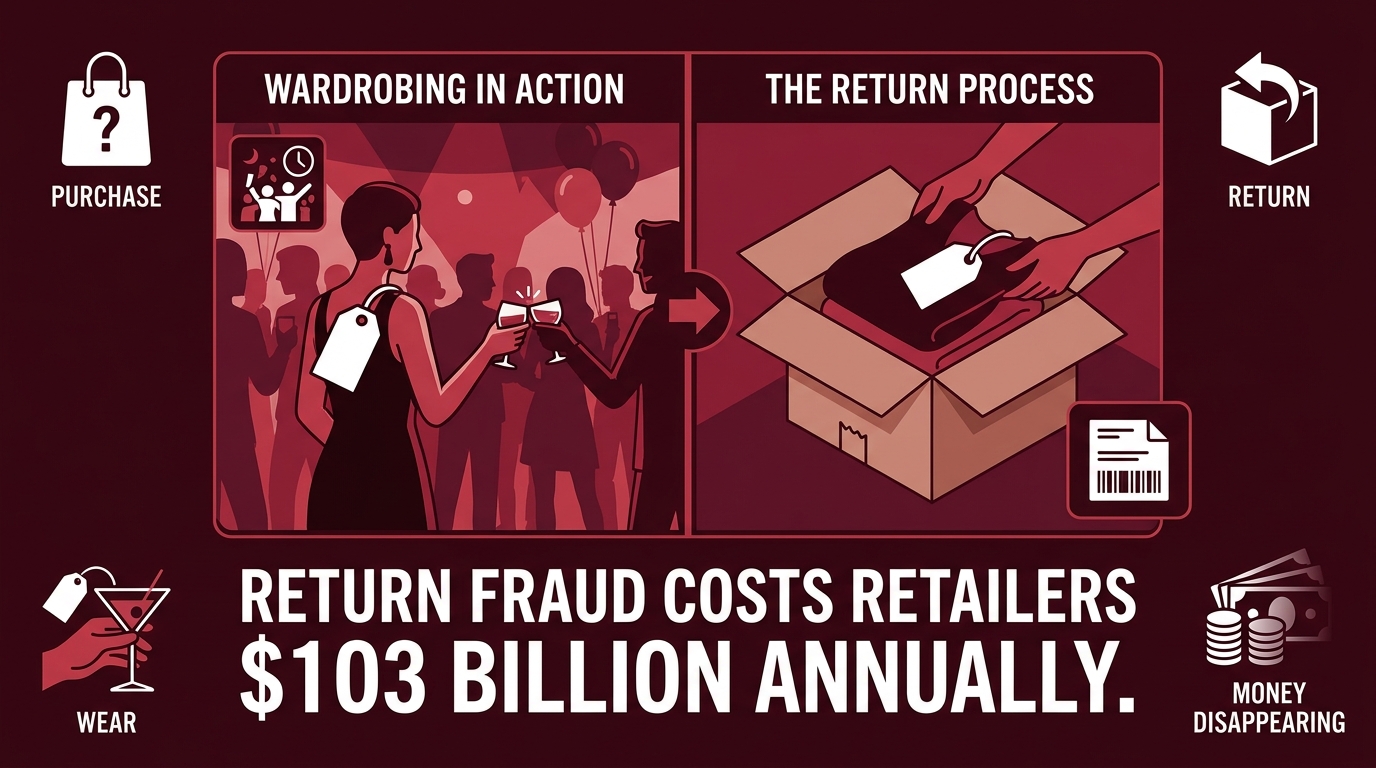
Return fraud does not look like shoplifting on a security camera. It looks like normal customer behavior until the data tells a different story.
The Scale of the Problem
According to NRF data and industry analysis, roughly 9–15% of all returns involve some form of fraud or abuse. In dollar terms, that translates to approximately $103 billion in fraudulent return losses annually in the U.S. — a figure that has continued climbing. Globally, the number exceeds $112 billion in 2026.
The forms this takes are varied, but a few patterns dominate:
- Wardrobing: Purchasing items (typically apparel, electronics, or occasion-specific goods) with the intent to use them once and return them. The item comes back worn, used, or missing accessories — technically within the return window but clearly not in original condition.
- Bracketing: Buying multiple sizes or variants of the same item with no intent to keep more than one, then returning the rest. Shopify data shows roughly half of Gen Z shoppers bracket clothing and shoe purchases routinely. This is not fraud in the traditional sense, but it creates the same margin drag — you pay forward and reverse shipping on units that were never going to be permanent sales.
- Empty-box returns: Returning packages that don’t contain the original item, substituting a different (usually lower-value) item, or claiming an item never arrived when it did.
- Account manipulation: Using multiple accounts to circumvent return-limit policies, or using friends’ accounts to return items past windows.
Why Traditional Return Policies Don’t Catch It
The structural problem is that blanket return policies were designed for honest customers who made genuine purchase mistakes. They were not designed for behavioral patterns where return abuse is systematic. A 30-day return window with no inspection requirement and a prepaid label is essentially an open invitation for wardrobing — the economics completely favor the consumer in that arrangement.
Most return policies also lack differentiation by product condition on arrival. If an item comes back worn, sellers are often limited in what they can do — especially on platforms where the policy is set by the marketplace and the seller’s ability to contest a return is constrained. The result: the cost of fraud is largely invisible in the aggregate return rate number. It’s buried in condition downgrades and processing costs that don’t get attributed to their actual cause.
The Detection Shift: AI Flags, Not Manual Review
The response that’s gaining traction in 2026 is AI-based return pattern detection — flagging accounts with statistically abnormal return behavior before issuing labels or processing refunds, rather than after. Retailers using this approach have reported meaningful reductions in policy abuse, though the technology is more accessible to larger operations than to individual marketplace sellers who are subject to platform-set policies.
For marketplace sellers, the practical application is different: it means using your available data to identify high-risk SKU/customer combinations, route those cases for manual review where platform rules allow, and build feedback loops that inform your product and listing decisions — the topic of the next section.
Your Return Policy Is a Pricing Decision — Start Treating It That Way
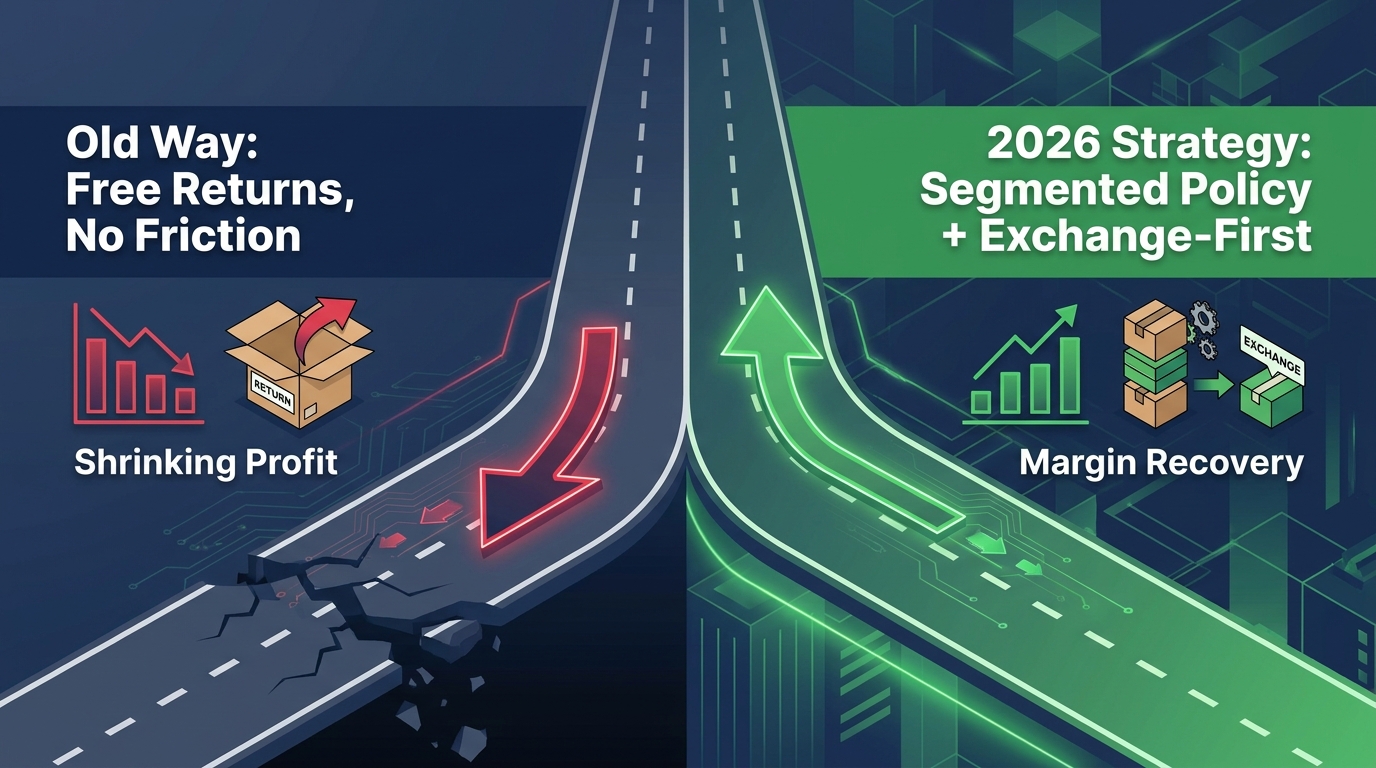
Most operators approach return policy as a customer service question: how generous do we need to be to compete? This framing is fundamentally wrong. Return policy is a pricing question — every free return you offer is an implicit discount built into your gross margin, and every return window you extend is a contingent liability that needs to be priced into your product economics.
The Margin-First Policy Audit
Start by categorizing your product catalog across two axes: return rate and margin per unit. This produces four quadrants:
- Low return rate, high margin: These products can sustain generous return policies without material margin impact. Offer whatever terms support conversion here.
- Low return rate, low margin: Returns are infrequent but painful when they happen. Standard policy with tight condition requirements makes sense.
- High return rate, high margin: The products that fund your business but generate operational complexity. Worth investing in pre-purchase interventions (sizing guides, video, AR) to reduce avoidable returns.
- High return rate, low margin: This quadrant is where the business bleeds. Every return here can push the unit from marginal profitability to net loss. These products need either a restructured listing strategy, a different pricing model, or — in some cases — discontinuation.
Restocking Fees: When They Work and When They Backfire
On Amazon, sellers can charge buyers a restocking fee in limited circumstances — primarily on seller-fulfilled orders when returned items arrive in non-original condition. The permitted amounts vary: up to 20% for items returned in non-original condition, up to 100% for clearly used items. However, Amazon restricts when these fees can actually be applied, and charging them incorrectly creates its own liability.
Outside of Amazon’s marketplace, DTC operators have more latitude. A restocking fee of 10–15% applied to all non-defective returns serves several functions simultaneously: it reduces marginal returns (the shopper who was 50/50 on keeping the item will usually keep it), it offsets processing costs when returns do happen, and it signals that returns carry a genuine cost — a signal that shapes consumer behavior even before purchase.
The critical caveat: restocking fees can reduce conversion on the initial purchase if they’re prominently displayed. The framing matters. Positioning it as “free exchanges, 10% fee for refunds” is conversion-neutral in many categories; positioning it as “we charge a fee for all returns” is not. The messaging strategy around your policy terms is as important as the terms themselves.
Return Window Length and Its Real Impact
Longer return windows do not necessarily create more returns — the relationship is more complex than that. Research consistently shows that shorter windows actually trigger more returns in some categories, because urgency causes buyers to act before they’ve fully made up their minds. A 60-day window in a considered-purchase category like furniture or electronics often produces fewer actual returns than a 14-day window, because customers take more time to actually try the product and settle into their decision.
Category-specific return windows are almost always more margin-efficient than a blanket policy. Consumables and items with hygiene implications should carry short windows and strict condition requirements. Considered purchases benefit from longer windows. High-fraud categories benefit from shorter windows with identity verification requirements. One policy fits none of these contexts well.
Prevention Is Cheaper Than Processing: Product Content as Margin Defense
If roughly 45–50% of ecommerce returns in fit-sensitive categories stem from sizing and fit issues, then the most powerful return reduction lever isn’t the return policy — it’s the product listing. This is a category of margin protection that most operators underinvest in relative to its impact.
Why Returns Are Mostly a Pre-Purchase Information Problem
When a customer returns a pair of jeans because “they didn’t fit,” that failure happened before the order was placed, not after. The customer formed an expectation of fit based on the product page — and the product page gave them inadequate information to form an accurate expectation. The return is the correction. Your job is to make the correction unnecessary by giving accurate information upfront.
This reframe matters because it changes where you invest. Adding more return-processing staff doesn’t fix a product content problem. Building a better size guide does.
What Better Product Content Delivers
The data on this is consistent across multiple studies. Apparel and footwear brands that upgraded from generic size charts to detailed fit content — including garment measurements, model height/weight data, fabric behavior notes, and customer review integration — saw size-related returns drop by 20–40%. One mid-market women’s activewear brand reduced size-related returns from 24% to 16% after implementing a dynamic size recommendation tool. That 8-point reduction, across thousands of orders, translates directly to gross margin recovery.
Conversion also improves in parallel — typically by 8–20% — because the same detailed information that reduces post-purchase disappointment also builds pre-purchase confidence. Better product content is a dual lever: it grows revenue and shrinks the return-related cost base simultaneously.
The Specific Content Elements That Reduce Returns
Not all content improvements are equally effective. The highest-ROI interventions, based on available case study data, are:
- Video demonstrations: Showing a product in use, from multiple angles, in real lighting conditions — not studio renders. Customers who watch product videos return at significantly lower rates, particularly for apparel, furniture, and home goods.
- Model diversity: Showing the same garment on multiple body types gives customers a more accurate reference point than a single model, and reduces the “it looked different on the model” return reason substantially.
- Customer-populated sizing data: Aggregated data from real customers who purchased and kept the item — “customers who are 5’7″ and 145 lbs typically order a Medium and find it fits true to size” — outperforms brand-provided size charts because it comes from a more credible, relatable source.
- Explicit compatibility information: For electronics, home goods, and accessories — clear, machine-readable compatibility data (dimensions, connector types, compatible models) eliminates the “it didn’t fit/work with my setup” return category entirely for customers who read it.
The investment calculation here is straightforward: if better photography and a sizing tool costs $5,000 to implement for a product category generating $500,000 in annual revenue at a 25% return rate, and it reduces returns by 25%, the annual margin save is material and the payback period is measured in weeks, not years.
The Exchange-First Strategy: Keeping Revenue Inside the Business
Every refund is a revenue event that moves money out of your business. Every exchange is a revenue event that keeps money inside your business, while still resolving the customer’s problem. The operational difference between a refund-first and an exchange-first return flow is one of the largest margin levers in ecommerce — and it’s underused by most operators.
How Exchange-First Flows Work
The mechanics are straightforward: when a customer initiates a return, the default path presented to them is an exchange (different size, color, or product), not a cash refund. The refund option remains available — you’re not holding money hostage — but it requires a deliberate extra step. For customers who had a genuine fit problem but liked the product, the exchange path is often more appealing than the refund path, especially when the exchange is fast and frictionless.
Platforms like Loop Returns, ReturnGO, and AfterShip Returns have built tooling specifically around this flow, and the results they report are consistent: exchange rates climb significantly when exchange is the default path, refund rates decline, and revenue retention improves. Some operators using exchange-first flows report retaining 30–40% of return revenue that would otherwise have left as refunds.
Store Credit as a Middle Option
Between the exchange and the full refund sits a third option that many operators overlook: store credit with a bonus. Offering a customer $45 in store credit for a $40 item return costs you $5, but it keeps $45 in your revenue cycle and creates a repeat purchase event. For customers who genuinely don’t want the same product again, the bonus credit is usually enough of an incentive to choose credit over a cash refund.
This works particularly well in categories with broad product ranges — apparel, home goods, consumer electronics — where the customer has other options within your catalog they’d consider. It works less well in highly specialized niches where there isn’t much else to buy.
Post-Purchase Communication That Reduces Returns Before They’re Requested
A segment of returns — particularly in apparel and electronics — can be eliminated entirely with proactive post-purchase communication. A follow-up sequence that triggers 3–5 days after delivery, asking “how does it fit?” with direct links to exchange options and setup guidance, intercepts buyer’s remorse and fit uncertainty before the return request is filed. Customers who would have hit the return button impulsively on day two, given a day-five check-in, often decide to keep the item.
This sounds like customer service best practice — it is, but it’s also a margin protection tool. Brands that implemented structured post-delivery sequences report measurable reductions in return rates, often in the 5–10% range on products where fit uncertainty is a common driver.
Segmenting Your Customers to Protect Your Best Relationships
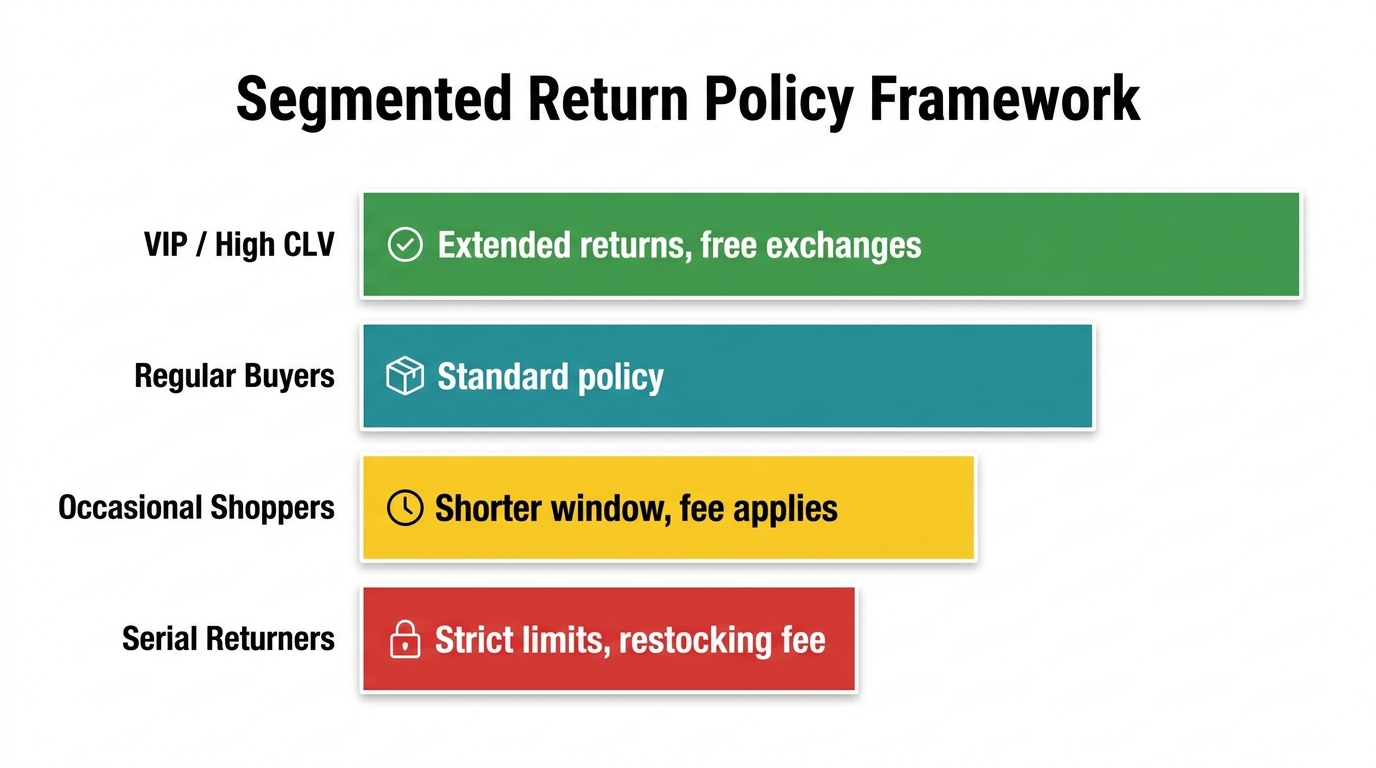
One of the most meaningful shifts in returns strategy over the past 12–18 months is the move from one policy for all customers to differentiated policies based on customer value and return behavior. The economics behind this shift are compelling, and the data required to execute it is largely already available to most operators.
Why a Uniform Policy Is Subsidizing Your Worst Customers
A blanket free-returns policy treats your highest-value, lowest-return customers identically to your most abusive, highest-cost customers. The loyal buyer who orders twelve times a year, keeps 95% of what they buy, and refers friends to your store gets the same return experience as the account that orders, uses, and returns 70% of purchases. You’re funding the abuse with the loyalty. That is not a sustainable model — it penalizes the customers you should be cultivating and subsidizes the ones draining your margin.
The alternative is a segmented model built on two core dimensions: customer lifetime value (CLV) and return behavior history. Cross these two variables and four meaningful segments emerge:
- High CLV, low return rate: These are your VIP customers. Give them the most generous policy you can — extended windows, free exchanges, no-questions-asked returns. The total return cost is low; the retention value of exceptional service is high. This is where “free returns” makes business sense.
- High CLV, high return rate: Valuable customers who return frequently. Worth investigating why — often a sizing or expectation issue that can be fixed with better product content. Treat them generously but deploy interventions to address the root cause.
- Low CLV, low return rate: Infrequent buyers who aren’t costly. Standard policy applies.
- Low CLV, high return rate: The segment that subsidizing is irrational. Apply shorter windows, restocking fees where policy allows, and — in extreme cases — flag for return abuse review. This is not about punishing customers; it’s about not running a negative-margin service operation for accounts that deliver no business value.
Implementing Segmented Policy Without Alienating Customers
The risk of visible segmentation is that customers who receive a different experience than they expected will complain — sometimes publicly. The solution is to make the difference feel like a reward rather than a restriction. Programs that explicitly communicate “as a VIP member, you receive extended returns and free exchanges” are received completely differently from programs where it becomes apparent that some customers are getting worse terms.
Amazon implements implicit segmentation by making certain accounts ineligible for returnless refunds, or flagging high-return accounts without communicating this publicly. DTC brands have the opportunity to be more transparent and turn the better terms into a loyalty incentive — which is both more honest and more effective at driving repeat purchase behavior.
The “Keep the Item” Decision: When Returnless Refunds Protect Margin
Amazon’s “keep the item” or returnless refund mechanism — where the seller issues a full refund but doesn’t require the item to be returned — is one of the more counterintuitive margin tools in the ecommerce operator’s toolkit. Used correctly, it can improve profitability. Used incorrectly, it is simply writing off your COGS.
The Breakeven Calculation
The math is clean: a returnless refund makes economic sense when the cost to process the return exceeds the recoverable value of the returned item. Consider a product that sells for $25, costs $10 to produce, and carries $11 in return processing costs (label, labor, inspection). If a returned unit in typical condition would be resold at $18 after inspection and re-packaging, and you’ve already paid $11 in processing costs to get to that point, your net recovery from the return is $7 — but you’ve also spent $11 to retrieve it. The returnless refund, at a $25 refund cost against $10 COGS written off, saves you $4 per unit compared to processing the return.
Run this calculation at scale across high-return, low-value SKUs and the savings are significant. Sellers who’ve deployed targeted returnless refund policies on items in the $15–$30 range report meaningful processing cost reductions without material increases in fraud.
Where It Goes Wrong
The returnless refund becomes a margin problem when applied too broadly — particularly to mid- and high-value items where the COGS written off exceeds what would have been the processing cost. A $150 item with a $12 return processing cost is not a candidate for “keep it” resolution. The math is clear: $150 in COGS written off versus $12 in processing cost saved. And higher-value items tend to attract more intentional abuse once word spreads that returns don’t require the item to be sent back.
On Amazon, sellers can set returnless refund rules by product category and price threshold. The discipline is in being specific: deploy it for items under a certain price point, in categories where condition degradation is high and recovery value is low, and revisit the thresholds quarterly as your cost structure evolves.
AI and Data Tools Rewriting the Returns Playbook
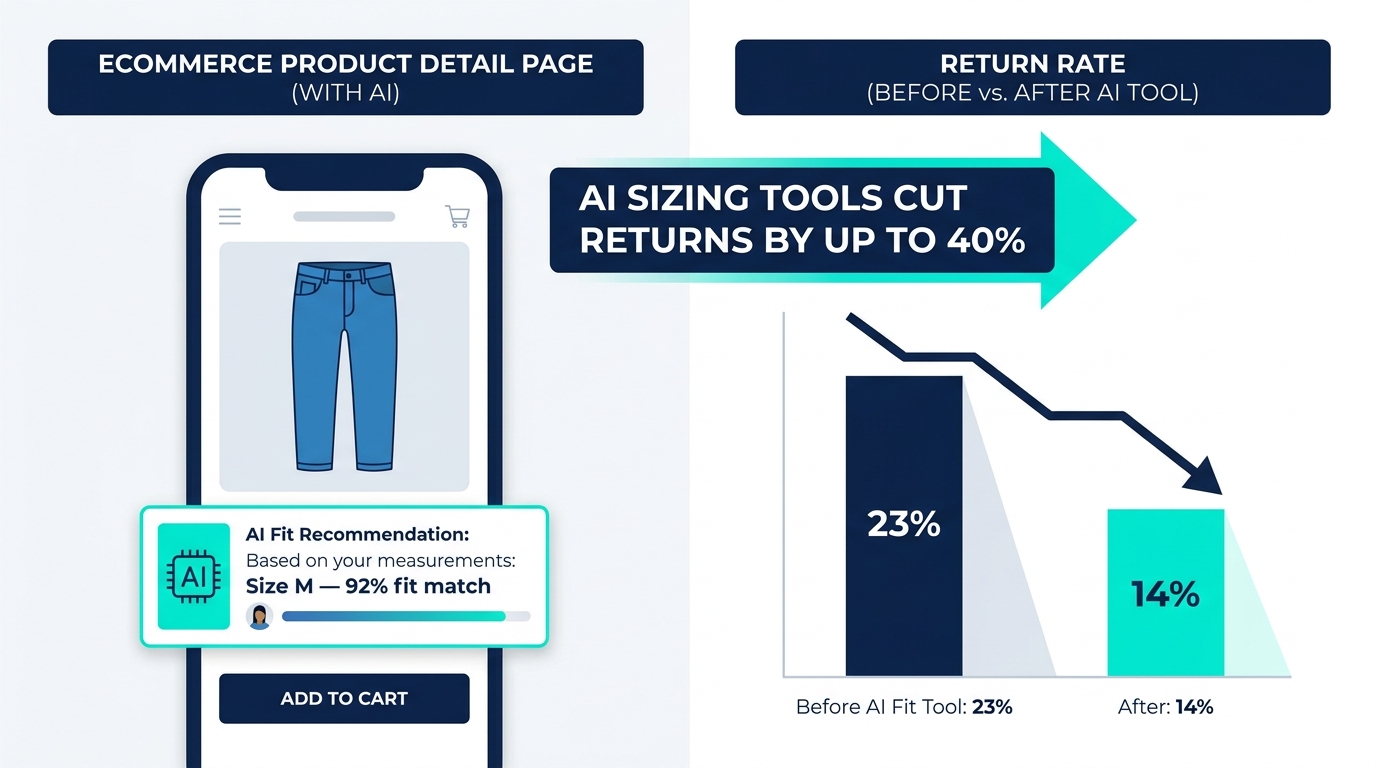
The conversation around AI in ecommerce has often focused on marketing and advertising applications. The returns management use case is less discussed, but it may be where the actual ROI is most accessible for most operators in 2026.
Fit and Size Recommendation Tools
The best-validated AI application in returns prevention is pre-purchase fit and sizing recommendations. These tools collect body measurements, preferences, and purchase/return history, then generate fit predictions at the point of purchase. McKinsey-referenced data cited in 2026 materials estimates that fit recommendation tools can reduce net return rates by 10–20% in size and appearance-driven categories. In more specifically targeted deployments — footwear, performance apparel — the reductions have reached 30–40%.
The key insight from these deployments is that the tool doesn’t need to be perfect to generate significant margin improvement. Even a 15% reduction in a 25% return rate — moving it to 21% — produces meaningful cost savings at volume. The investment threshold for these tools has also declined significantly; several platforms now offer AI sizing as a monthly SaaS fee rather than a custom implementation cost, making the ROI accessible at smaller revenue scales.
Return Reason Classification and Root Cause Analysis
NLP-based return reason classification — automatically categorizing return reasons from free-text customer inputs — is another maturing use case. Rather than manually reviewing return comments, the system tags each return with a primary reason code, identifies clustering around specific products or SKUs, and surfaces patterns that manual review would miss at scale.
The output is not just reporting — it’s action. When an AI system surfaces that 40% of returns on a specific product are citing “smaller than expected,” that’s an actionable signal to update the listing’s size guidance, adjust the photography to show scale, or flag the product for a potential sizing adjustment with the manufacturer. Without automated classification, that signal gets lost in the noise of high return volumes.
Predictive Return Risk Scoring
The frontier application is return risk scoring at the order level — using purchase history, browsing behavior, promotion usage, account age, and product attributes to predict, at the time of purchase, how likely a given order is to be returned. Retailers with sufficient data are using these scores to route high-risk orders to different handling (additional confirmation steps, alternative return terms) or to flag them for human review before a label is issued.
For most marketplace sellers operating on Amazon or other platforms, this level of implementation isn’t directly available — the platform controls the return flow. But for DTC operations, brands with their own checkout and CRM, or sellers with off-platform channels, the capability is accessible through third-party return management platforms, and the results are documented: 10–35% reductions in return rates with full-stack implementations that combine pre-purchase prediction with post-purchase interventions.
Building a Return Policy That Survives Future Platform Shifts
Amazon changed its return policy terms in early 2026. The year before, the returns processing fee expanded. Before that, auto-refund timelines tightened. The pattern is clear: platforms will continue adjusting return mechanics in ways that shift cost toward sellers. Building a returns strategy that assumes current platform terms will remain stable is building on sand.
The Principle of Returns Independence
The most margin-resilient operators in 2026 are those who have reduced their structural dependency on any single platform’s return policy by building their own DTC return infrastructure in parallel. This doesn’t mean abandoning marketplace sales — it means developing off-platform customer relationships where you have direct control over the return experience.
When you own the customer relationship directly, you can segment policy, deploy exchange-first flows, test return fees, offer credit bonuses, and make real-time policy adjustments. When you’re entirely platform-dependent, every policy change is imposed externally, and your only response is operational adaptation after the fact.
Diversifying Return Channels
The rise of in-store return options via third-party drop-off networks (Happy Returns, Loop, Narvar, and carrier-integrated programs) has created new economics for online sellers. Return-to-store and drop-off options are typically less expensive per unit than mailed returns, reduce condition degradation (since items aren’t spending days in transit), and create a physical touchpoint that can be used to offer exchanges or alternative products before the return is finalized.
Brands using these networks consistently report lower per-return costs and higher exchange rates than pure mail-in programs. For sellers without physical retail presence, partnering with a drop-off network is the closest equivalent to the cost advantage that physical retail brands have always enjoyed in the returns equation.
Policy Transparency as a Competitive Advantage
There is a counterintuitive competitive dynamic in the current environment: as more retailers introduce return fees and restrictions, brands with genuinely generous but clearly communicated policies stand out. The key word is clearly communicated. Research consistently shows that return policy clarity — not just generosity — drives conversion. Customers who clearly understand the terms are more likely to buy than customers who face ambiguity, even if those customers theoretically want stricter terms.
If your return policy is genuinely competitive, making it visually prominent on product pages is a conversion tool, not just a legal disclaimer. If it’s been tightened in ways that might surprise customers, burying it in fine print creates the kind of post-purchase disappointment that generates negative reviews and chargebacks alongside the actual return cost.
The Margin Math That Should Drive Every Returns Decision
Returns are not a customer service problem that occasionally affects your P&L. They are a structural cost driver that, left unmanaged, systematically erodes gross margin, distorts inventory planning, and creates operational complexity that scales with your revenue rather than declining as you grow.
The framework for managing them isn’t complicated, but it requires discipline that most operators haven’t historically applied to this part of the business:
- Build a per-SKU return cost model. Know which products are net-negative once returns are fully loaded. This is the non-negotiable first step — every other decision flows from knowing where you actually bleed.
- Treat your return policy as a pricing variable. Every return term you offer has an implied cost. Make sure that cost is explicitly factored into your unit economics, not absorbed silently by gross margin.
- Fix the information gap before fixing the policy. The majority of avoidable returns stem from pre-purchase information failures. Investing in product content delivers better margin outcomes per dollar than investing in return processing efficiency.
- Default to exchanges, not refunds. The operational changes required to implement exchange-first flows are modest. The revenue retention impact is significant. This is the highest-ROI change most operators can make in a single week.
- Segment your policy by customer value, not just product category. Your best customers deserve your best return experience. Your most abusive accounts deserve friction. Applying the same policy to both is a margin subsidy program for your worst relationships.
- Design for platform independence. Platform terms will continue to shift in ways that increase seller costs. Building DTC infrastructure, return drop-off capabilities, and direct customer relationships is how you maintain control of the variable.
The ecommerce return landscape in 2026 is more expensive, more complex, and more consequential to margin than it has ever been. The sellers who treat returns as a strategic lever — rather than an operational nuisance — will protect and expand their margins in an environment where most are simply absorbing the erosion.
The bottom line: You don’t need to make returns harder for customers. You need to make the economics of bad returns work for your business — by preventing avoidable returns, keeping revenue in exchanges, segmenting your policy intelligently, and building enough platform independence that you’re never entirely subject to a rule change you didn’t vote for.