
Most brand-registered Amazon sellers have opened Brand Analytics at least once. Many open it regularly. A smaller group actually acts on what it shows them — and that gap is where real competitive separation happens in 2026.
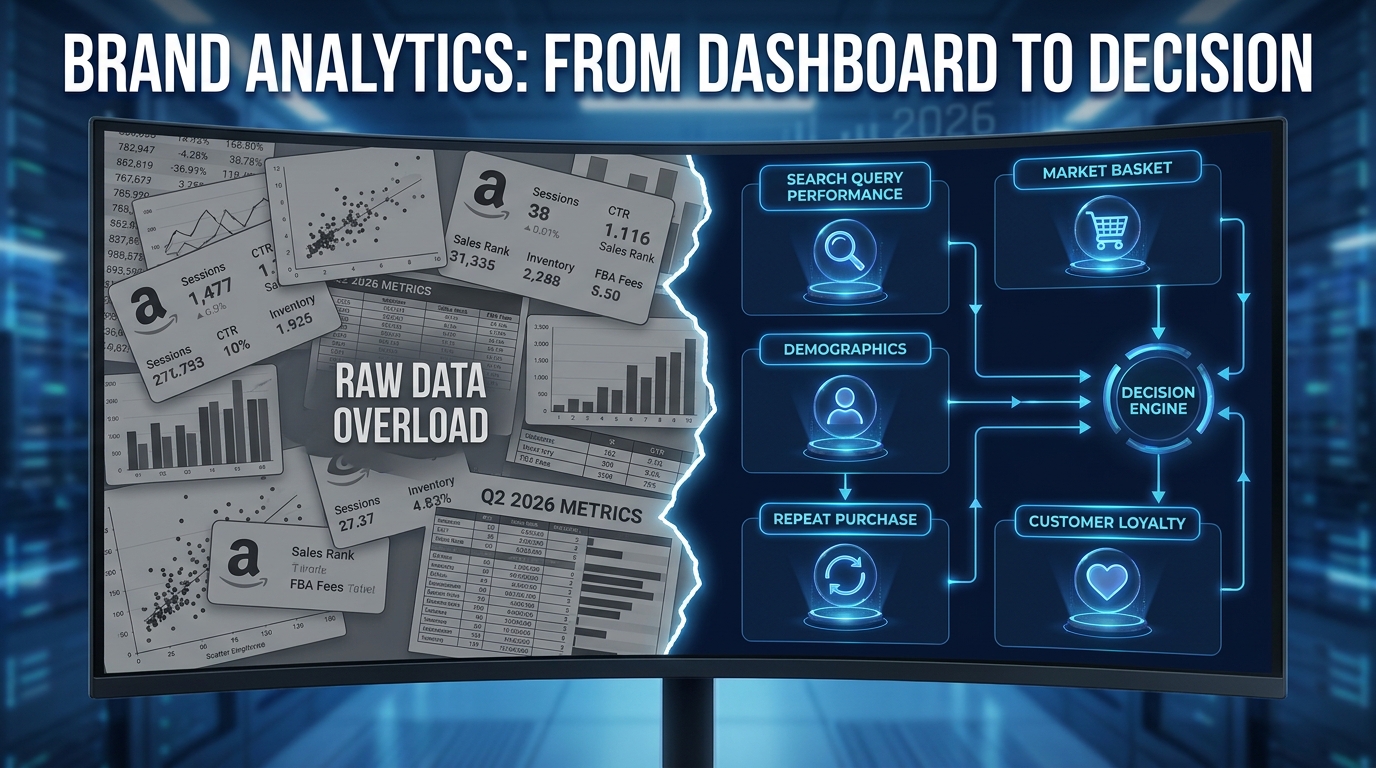
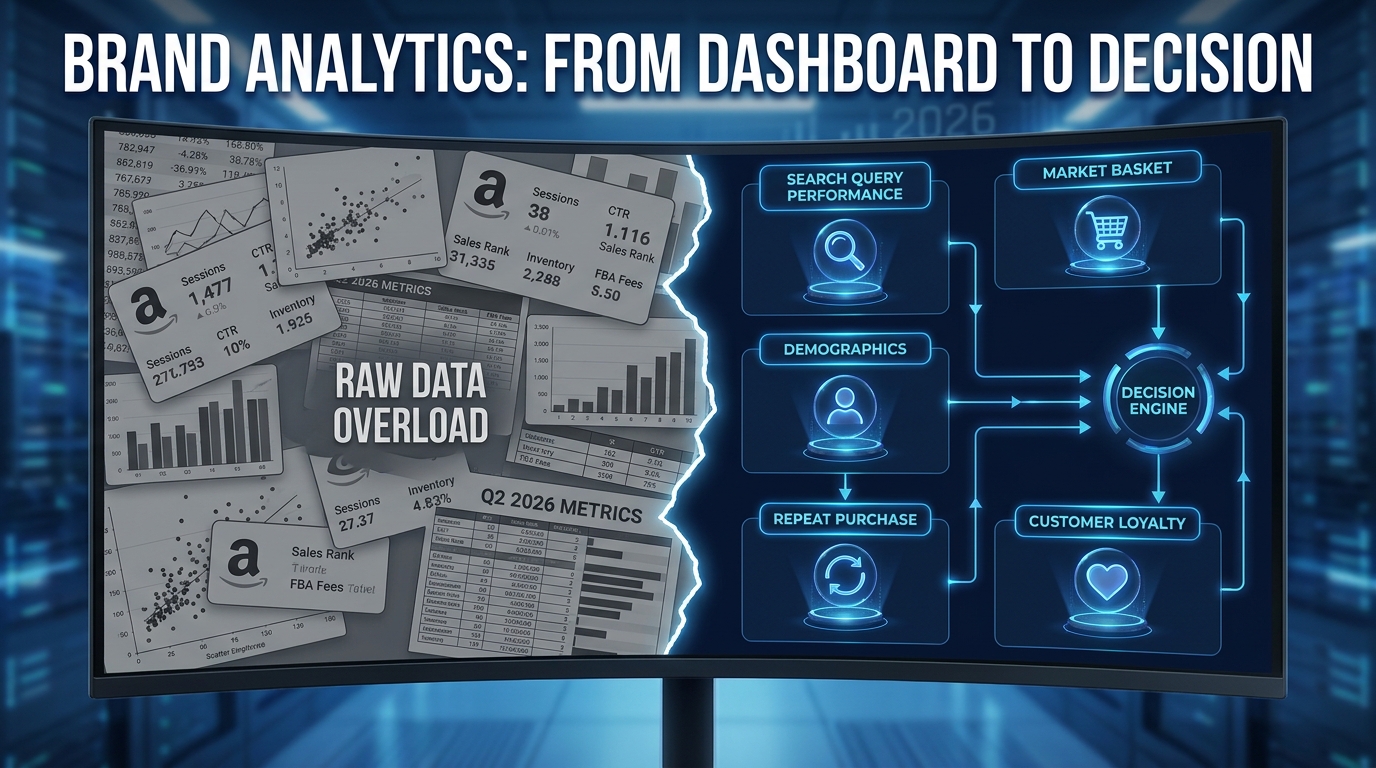
Amazon Brand Analytics (ABA) has expanded significantly over the past two years. What started as a top search terms report has grown into a six-report suite covering everything from full-funnel search behavior to customer loyalty segmentation, demographic profiles, and repeat purchase diagnostics. The data available inside ABA today would have cost a mid-market brand tens of thousands of dollars to assemble from third-party research providers just five years ago. Amazon now hands it to every brand-registered seller, largely for free.
And yet the majority of sellers still use it primarily to pull keyword lists.
This piece is about the gap between that habit and what the data actually makes possible. It covers the six core ABA reports in depth — not what each column means, but how sellers are actively combining them with ad strategy, listing optimization, customer lifecycle management, and increasingly, API-driven automation to build a durable information edge. If you’re already familiar with the basics of Brand Analytics, this is the operational layer you may not have seen mapped out this clearly before.
The Six-Report Framework: Knowing Which Question Goes Where
Brand Analytics surfaces data across two categories: Search Analytics and Consumer Behavior Analytics. Understanding which report answers which type of question is the prerequisite to using any of them well.
Search Analytics Reports
Search Catalog Performance (SCP) shows how your own ASINs perform across the search funnel — impressions, clicks, cart adds, and purchases — originating from search. It also surfaces shipping speed data (same-day, 1-day, 2-day) per ASIN, which tells you whether fulfillment messaging is affecting conversion at scale. SCP answers the question: How are my specific products performing across the search journey?
Search Query Performance (SQP) is the market-level complement. It shows you the full funnel for specific search terms, including your brand’s share of impressions, clicks, cart adds, and purchases for each query — and the competing brands capturing the rest. SQP answers the question: For any given keyword, where is my brand winning, where is it losing, and to whom?
Top Search Terms is the legacy report — broad keyword volumes with some click and conversion share data. It’s useful as a quick pulse-check but is largely superseded by SQP for strategic work. Still valuable for identifying seasonality and category-level trend shifts quickly.
Consumer Behavior Analytics Reports
Repeat Purchase Behavior breaks down repeat ordered sales, repeat customers, and the percentage of buyers who return to purchase again — at brand level and ASIN level. It answers the question: Which products create loyal buyers and which create one-time buyers?
Demographics provides aggregate buyer profiles (age, income, education, gender, marital status) for ASINs with at least 100 unique buyers in the selected period. It answers the question: Who is actually buying from me, and does that match who I’m targeting?
Market Basket Analysis shows the top three products most frequently purchased alongside each of your ASINs. It answers the question: What are my customers buying in the same session, and how can I engineer that behavior?
Customer Loyalty Analytics — the newest module, rolled out through 2024–2025 and now well-integrated — uses RFM-style segmentation (Recency, Frequency, Monetary) to classify your customer base into loyalty tiers. It answers the question: What does the health of my repeat-customer ecosystem actually look like?
The most effective sellers build a weekly or biweekly review rhythm that cycles through all six. The less effective ones open whatever report they remember exists and wonder why the data never seems to connect to anything actionable.
Search Query Performance: Reading the Full Funnel, Not Just Volume
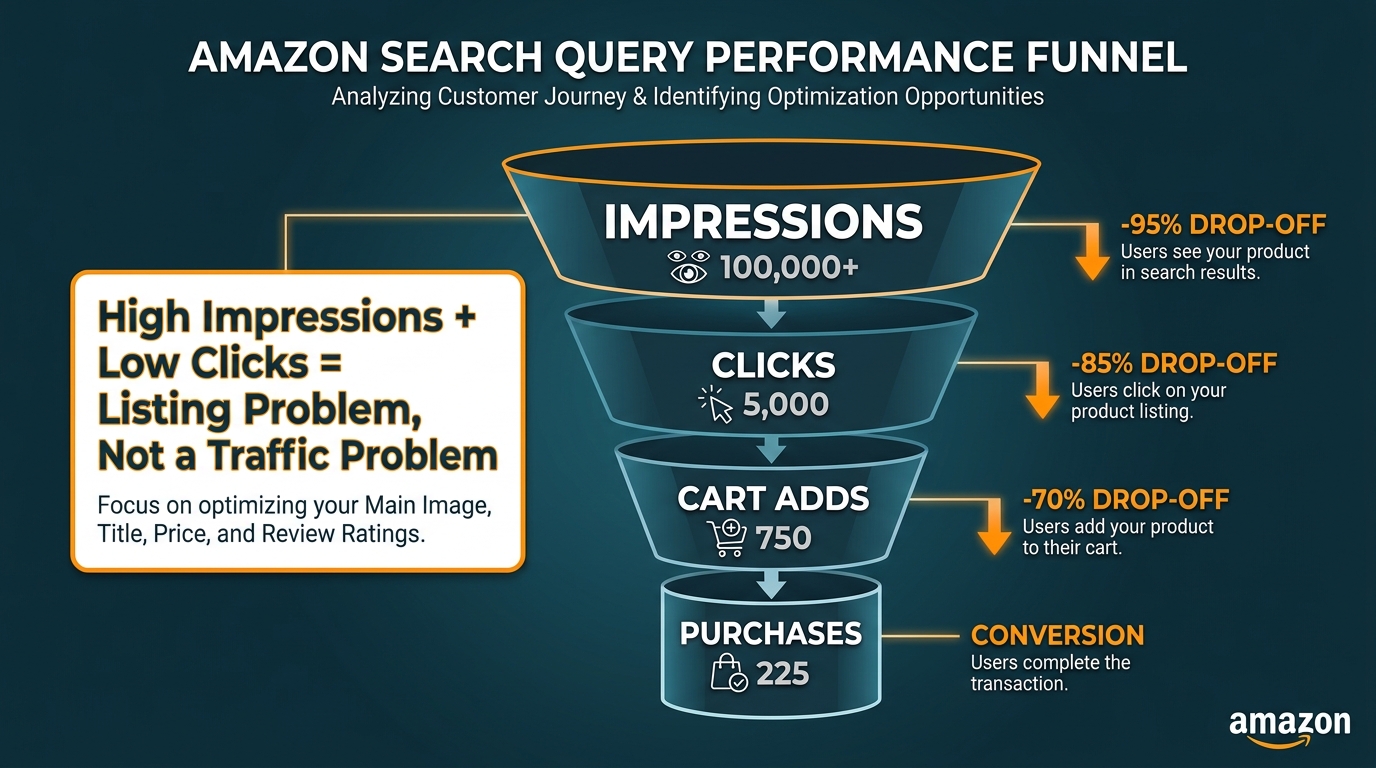
Search Query Performance is the most powerful report in Brand Analytics for most sellers — and also the most commonly misread. The instinct when opening SQP is to scan for keywords with high search volume and bid on them. That’s not wrong, but it misses the real diagnostic value the report provides.
The Four-Column Lens
SQP gives you four share metrics for each query your brand appears in: impression share, click share, cart add share, and purchase share. The relationship between these four numbers tells you something specific at each stage.
A query where your impression share is high but your click share is low is a listing problem. You’re appearing, but shoppers aren’t choosing you. The issue almost certainly lives in your main image, price point, or review count relative to competitors — the three things a shopper evaluates in under two seconds on a search results page before deciding to click.
A query where your click share is high but your purchase share is low is a product page problem. Shoppers are choosing to investigate but not converting. The listing itself — copy, A+ content, secondary images, pricing, shipping speed — isn’t closing the sale.
A query where your click share and purchase share are proportionally similar means your product page is converting at a healthy rate for the traffic it gets. The question then becomes whether you want more of that traffic and how to get it.
The Five-Year History Advantage
Amazon’s expansion of SQP to include up to five years of historical data is one of the most underused aspects of the report in 2026. This data allows sellers to identify seasonal demand patterns at the query level rather than the category level — a meaningfully different signal. A category might peak in Q4, but a specific query within that category might peak in late October while a related query peaks in early December. That distinction changes your ad scheduling, your inventory positioning, and your promotional timing.
It also allows you to track your own share-of-voice trajectory. A brand that held 18% click share on a core keyword twelve months ago and now holds 11% has lost ground — even if overall sales grew, because the category may have grown faster. That’s a strategic signal most sellers never see because they only look at their own absolute numbers.
Prioritization Logic
Not all SQP gaps are equal, and not all are worth chasing. The most productive prioritization framework is to focus first on queries where all three of the following are true: the search volume is meaningful, your current click share is non-zero (you have some organic presence), and your click-to-purchase conversion share is above your category average. These are queries where you have demonstrated relevance, some visibility, and a product that converts — meaning incremental ad spend or a listing tweak has a high probability of paying back.
Chasing queries where you have zero click share from a standing start is expensive and often ineffective because you haven’t yet signaled relevance to the algorithm. Build from positions of partial strength, not from zero.
Wasted Visibility: The Metric Most Sellers Never Calculate
Wasted visibility is not a native Amazon metric — it’s an analytical construct that advanced sellers derive from SQP data, and it’s one of the highest-leverage calculations you can run on your account.
The concept: every impression your ASIN receives represents a potential click. When your click-through rate (CTR) falls materially below the category average for a given query, the impressions you’re receiving are not converting to traffic — they’re being “wasted.” You’re paying (in organic ranking effort or ad spend) to appear, but the appearance is generating minimal commercial return.
Calculating Wasted Visibility
To calculate it: take the queries where you hold a top-five impression share position, then filter for those where your click share is less than 50% of what your impression share would predict at the category average CTR. If your impression share is 15% on a query and the category average CTR means that 15% should yield roughly 10% click share, but you’re only getting 5%, you have a meaningful wasted visibility problem on that query.
This calculation doesn’t require advanced tools. It requires exporting SQP data, calculating implied CTRs from click and impression share columns, and flagging the gap. What you do with the flag depends on what type of gap it is:
- Price gap: Your main image shows a price that’s significantly above the top-clicked competitors. Consider promotional pricing, a quantity discount, or repositioning messaging.
- Image gap: Your main image doesn’t communicate the product’s key benefit as immediately as competing images. A/B test your hero image using Manage Your Experiments or PickFU before committing.
- Review gap: You have meaningfully fewer reviews or a lower rating than the products being clicked instead of yours. There’s no shortcut here — but knowing the gap is causing visibility waste helps you prioritize review generation effort.
- Relevance gap: Your ASIN is appearing for a query where the top competitors are better product fits. This is a signal to either stop targeting the query or rethink how you’re positioning this ASIN for it.
Why This Matters More Than Keyword Coverage
Most sellers in 2026 think about Brand Analytics keyword data primarily as an input to keyword coverage — finding terms they’re not targeting and adding them to campaigns or listings. Wasted visibility flips this: it asks whether the terms you’re already appearing on are performing as well as they should, before you spend effort expanding reach. Fixing a wasted visibility problem is almost always more cost-efficient than opening up new keyword fronts, because the infrastructure (organic ranking, ad account structure) is already in place.
Branded Defense: The Competitor Threat Hiding in Your SQP Data
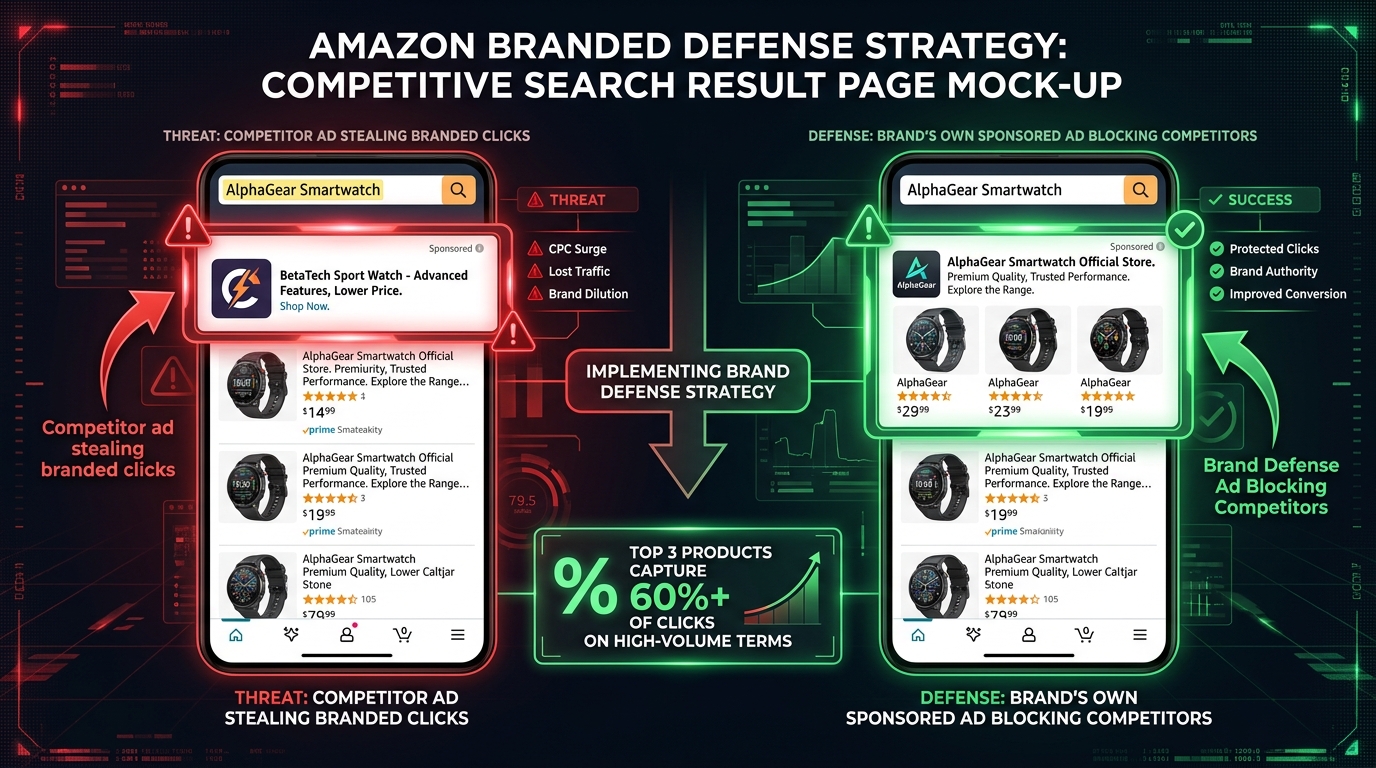
One of the most commercially damaging patterns SQP reveals — and one that often goes unnoticed — is competitor activity on your branded search terms. When someone searches your brand name and a competitor’s ad appears at the top of results, you lose traffic that should be nearly free to convert. These are high-intent, brand-aware shoppers. Losing them to a competitor is expensive.
Identifying the Leak
Pull your branded search terms from SQP — these are the queries that include your brand name or a product-specific variant of it. Look at your click share and purchase share on these terms. For a well-known brand with strong organic ranking, you’d expect your click share on branded terms to be well above 60%. If it’s materially lower, competitors are likely capturing a meaningful portion of your branded traffic through Sponsored Products or Sponsored Brands ads targeting your brand name.
Because SQP shows you the other brand names capturing click share on any given query (Amazon shows the top three competing brands’ click share data), you can identify which specific competitors are running on your brand terms and how much share they’re taking.
The Three-Layer Defense
Branded defense on Amazon typically requires three layers working simultaneously:
Layer 1 — Own your branded search placement. Run Sponsored Brands campaigns on all core branded terms with your brand store or a custom landing page as the destination. Sponsored Brands ads appear at the top of results, above Sponsored Products, and are the most visible real estate on a branded search. They make it structurally harder for competitors to appear above you.
Layer 2 — Bid on your own brand terms in Sponsored Products. This sounds counterintuitive — you’re already ranking organically for your brand terms. But organic ranking doesn’t prevent competitor ads from appearing above your organic result. Running Sponsored Products on your brand terms ensures you hold paid placement above your organic listing, compressing the space available for competitors.
Layer 3 — Product targeting on your own ASINs. Use Sponsored Products and Sponsored Display to run ads that appear on your own product detail pages. When a competitor is running a Sponsored Display retargeting ad on your ASIN and showing up in the “similar products” carousel, you should be outbidding them for that space. Your own product page is the highest-value real estate in your catalog for cross-sell and retention — own it.
The data to audit all three layers sits in SQP. The fix requires action in your advertising console. The connection between the two is what most sellers aren’t making consistently.
Market Basket Analysis: The Cross-Sell Revenue Sitting in Plain Sight
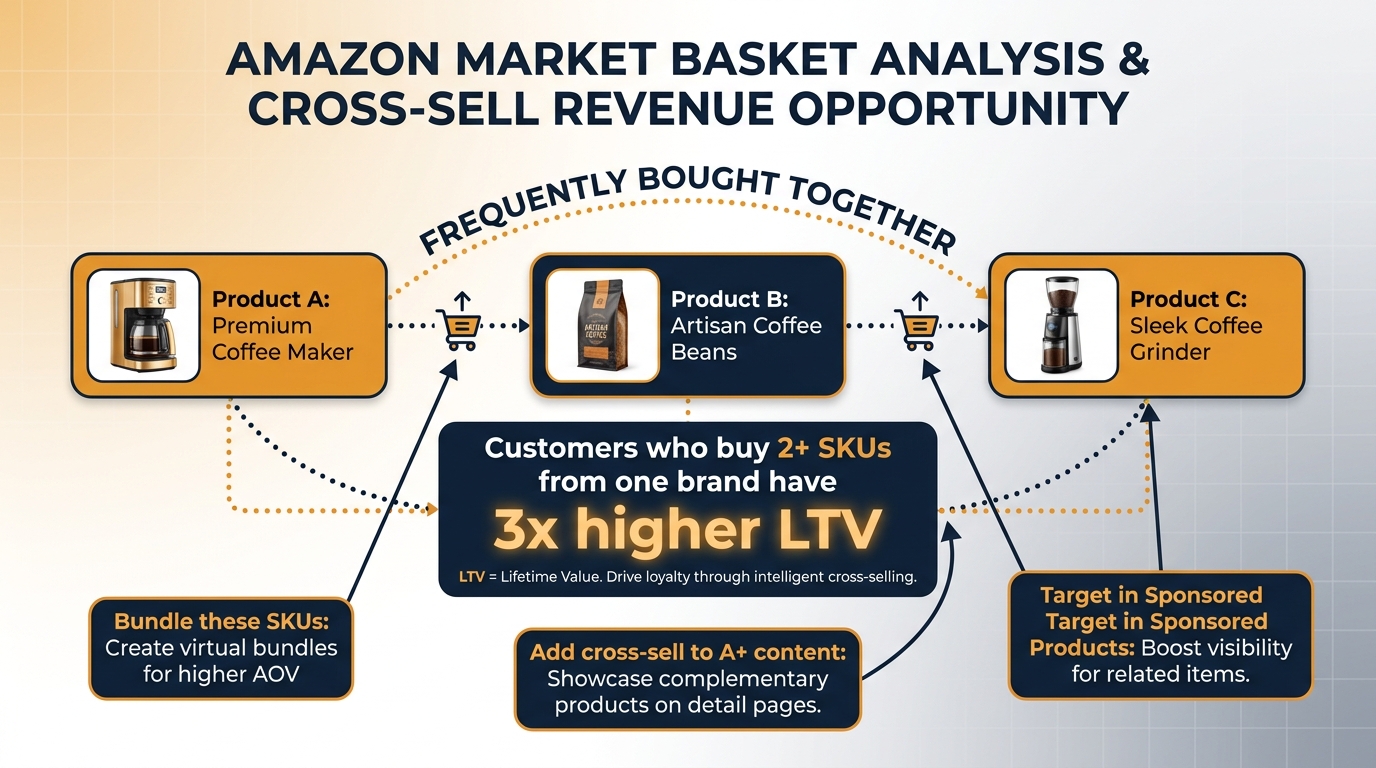
Market Basket Analysis shows you the top three products most frequently purchased in the same session as each of your ASINs. It sounds simple. Most sellers glance at it, nod, and move on. The sellers who are using it well in 2026 have built entire catalog expansion roadmaps, bundle strategies, and advertising approaches around what it reveals.
What the Data Actually Tells You
The products appearing in your Market Basket data are, by definition, products your customers already want alongside yours. This is first-party purchase data from people who already bought you — it’s as strong a signal as you can get about demand that’s adjacent to your core offering.
If the products frequently bought alongside your ASIN are your own other SKUs, that’s healthy. It means your catalog has natural cross-sell pathways and your customers are discovering them. If the products frequently bought alongside your ASIN are competitors’ products, that’s a different signal entirely — it means there’s a product gap in your catalog that a competitor is currently filling for your buyers.
A home goods brand that sells premium cutting boards and finds that the top Market Basket products alongside their best-selling ASIN are a competitor’s knife set and a competitor’s magnetic knife strip has discovered something important: their customers want a complete kitchen prep setup, and the brand doesn’t offer one. That’s either an opportunity to expand the catalog, or evidence that building a bundle with a complementary brand partner could increase order value immediately.
Three Direct Applications
Application 1 — A+ Content cross-sell modules. Amazon’s A+ Content builder allows you to include comparison charts and product carousels. If your Market Basket data shows that your customers frequently buy Product B alongside Product A, build an A+ module on Product A’s page that surfaces Product B. You’re replicating naturally occurring buying behavior rather than guessing at what to suggest.
Application 2 — Sponsored Products ASIN targeting. If the frequently co-purchased products are from competitors, build a Sponsored Products campaign targeting those competitor ASINs. Your product is already being purchased alongside theirs — meaning a shopper who arrives at that competitor’s page has demonstrated exactly the intent profile you’re looking for.
Application 3 — Virtual bundle creation. Amazon’s Virtual Product Bundles feature (available to brand-registered sellers selling from FBA) lets you create bundle ASINs without physically kitting products. Market Basket data tells you precisely which pairings have natural organic demand — meaning you’re not guessing which bundle will perform. You’re encoding existing customer behavior into a new product listing.
The Competitive Basket Audit
One advanced use of Market Basket Analysis is to identify which of your competitor’s products are appearing in your basket data — and then check whether your competitor’s catalog already contains that product. If they do, they’re capturing that adjacent sale every time a mutual customer buys their version of your product. If they don’t, you have a first-mover opportunity to own that pairing before they recognize it.
Repeat Purchase Behavior as a CLV Diagnostic Tool
Repeat Purchase Behavior is one of the most strategically underused reports in the suite. Most sellers check it occasionally to see their repeat rate, feel vaguely pleased or concerned depending on the number, and don’t take it further. The sellers who are generating outsized return from it are treating it as a customer lifetime value (CLV) diagnostic — a tool for understanding which products in their catalog are worth more to acquire than their first-order margin suggests.
The Benchmark Problem
Understanding whether your repeat rates are healthy requires category context. Amazon does not provide industry benchmarks inside the report, which means sellers often evaluate their numbers in a vacuum. Based on practitioner data circulating in 2026, broad benchmarks for repeat purchase rates by category tend to look like this:
- Consumables (supplements, food, personal care, cleaning): 25–40% repeat rate is considered healthy; strong performers are at 35–45%.
- Durable goods (electronics, home goods, kitchenware): 8–18% is typical; products with strong ecosystem cross-sell can push above 20%.
- Apparel: 15–25% for brand-loyal categories; lower for undifferentiated basics.
If your category is consumable and your repeat rate is 12%, that’s a retention crisis — not just a low number. If your category is durable goods and your repeat rate is 22%, you’re likely building a genuinely loyal customer base that your advertising economics should reflect.
The True Bid Calculation
Here’s the practical implication most sellers miss: if a product has a strong repeat purchase rate, its true value to acquire as a customer is higher than the first-order margin alone. A product with a 35% repeat purchase rate and a 90-day repurchase cycle has a 12-month expected value that’s roughly 3.5x the first-order value — assuming each repurchase happens at the same order value and the repeat rate holds.
This means the maximum allowable CPA for that ASIN’s ads should be calibrated to LTV, not first-order profit. Sellers who calculate bids based on first-order ROAS are systematically underbidding on high-LTV products and leaving profitable market share on the table.
Diagnosing Low Repeat Rates
When a consumable product has a low repeat purchase rate, the diagnostic questions are: Is there a quality issue driving poor reviews and non-repurchase? Is there a Subscribe & Save friction point (no S&S option offered, unattractive discount, wrong interval)? Is the product being positioned as a one-time purchase rather than a habitual one in the listing and ad creative? Each of these is a fixable problem — but you first have to identify which one applies, and Repeat Purchase Behavior data is what surfaces the need to investigate.
Customer Loyalty Analytics and the RFM Segmentation Most Sellers Ignore
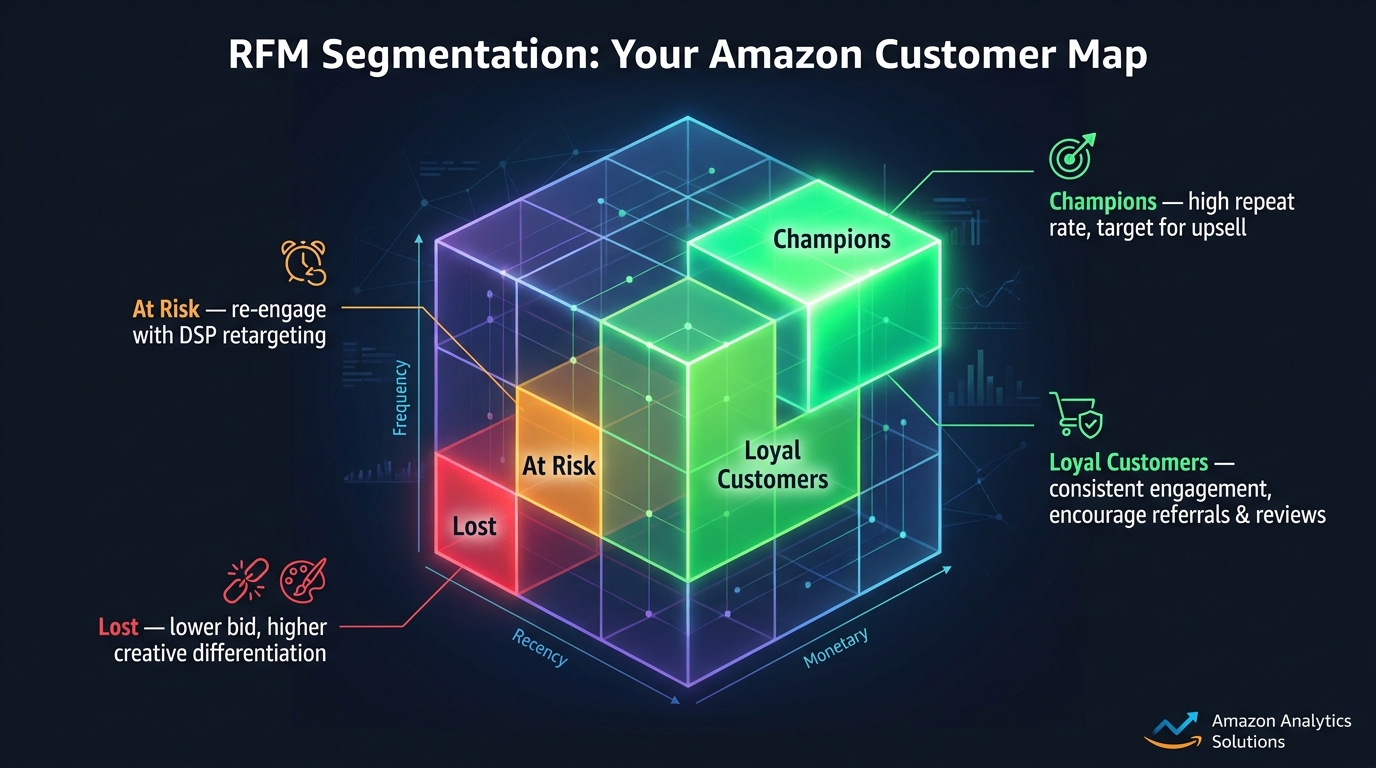
Customer Loyalty Analytics — the newest addition to the Brand Analytics suite — uses an RFM (Recency, Frequency, Monetary) framework to segment your customer base into loyalty tiers. While Amazon doesn’t expose individual customer data or allow cohort analysis at the user level, the aggregate picture it provides is more actionable than most sellers realize.
The RFM Segments Defined
Amazon’s Customer Loyalty Analytics typically segments customers along the following tiers, though naming conventions have evolved slightly since the initial rollout:
- Brand Champions / Loyalists: High recency, high frequency, high spend. These are your best customers — the ones most likely to respond positively to new product launches, highest-LTV for upsell, and most likely to leave organic reviews when asked appropriately.
- Promising / Emerging: Recent purchasers with low frequency. They bought recently but haven’t become habitual buyers yet. The window to influence them toward a second purchase is open.
- At Risk: Previously high-frequency buyers whose last purchase was more than one standard repurchase cycle ago. They were loyal but have gone quiet. These are the customers you’re losing if you don’t actively intervene.
- Lost / Inactive: No purchase within an extended period, historically low recency. Re-acquisition cost approaches the cost of acquiring a new customer — so the creative strategy should be differentiated, not identical to your standard retention approach.
Connecting Segments to Action
The value of RFM segmentation is only realized when each segment maps to a distinct advertising and merchandising strategy. Here’s how advanced sellers are activating each tier in 2026:
Champions/Loyalists → New Product Launch Signal. When you launch a new ASIN, your Champions segment is your highest-probability early adopter and review generator pool. Amazon’s Tailored Audiences tool (available to brand-registered sellers) allows you to reach recent customers with email-style notifications. Target your Champions segment with new product announcements before you open paid advertising to cold audiences.
Promising/Emerging → Second Purchase Conversion. These customers need a trigger to become habitual. DSP remarketing campaigns targeting recent purchasers with a promotion on a complementary product — informed by Market Basket Analysis — is one of the most capital-efficient conversion plays available. You’re not acquiring new traffic; you’re converting warm buyers who already trust your brand.
At Risk → Win-Back Sequencing. For consumable categories, “At Risk” customers who haven’t repurchased at their expected interval are the clearest signal that something broke the repurchase habit. A DSP campaign targeting this segment with a promotional offer and subscribe-and-save messaging, combined with a creative approach that reminds them of the product benefit, is the standard playbook. The key is timing — running this campaign when you first identify the segment shift, rather than months later when they’ve already moved to a competitor.
Lost/Inactive → Reacquisition with Proof. These customers need social proof, updated product messaging, or a significant price incentive to re-engage. Creative that highlights improvements since their last purchase (new formula, updated packaging, stronger reviews) performs better for this segment than simple discount messaging.
Demographics Data: Correcting Persona Assumptions and Sharpening Off-Amazon Targeting
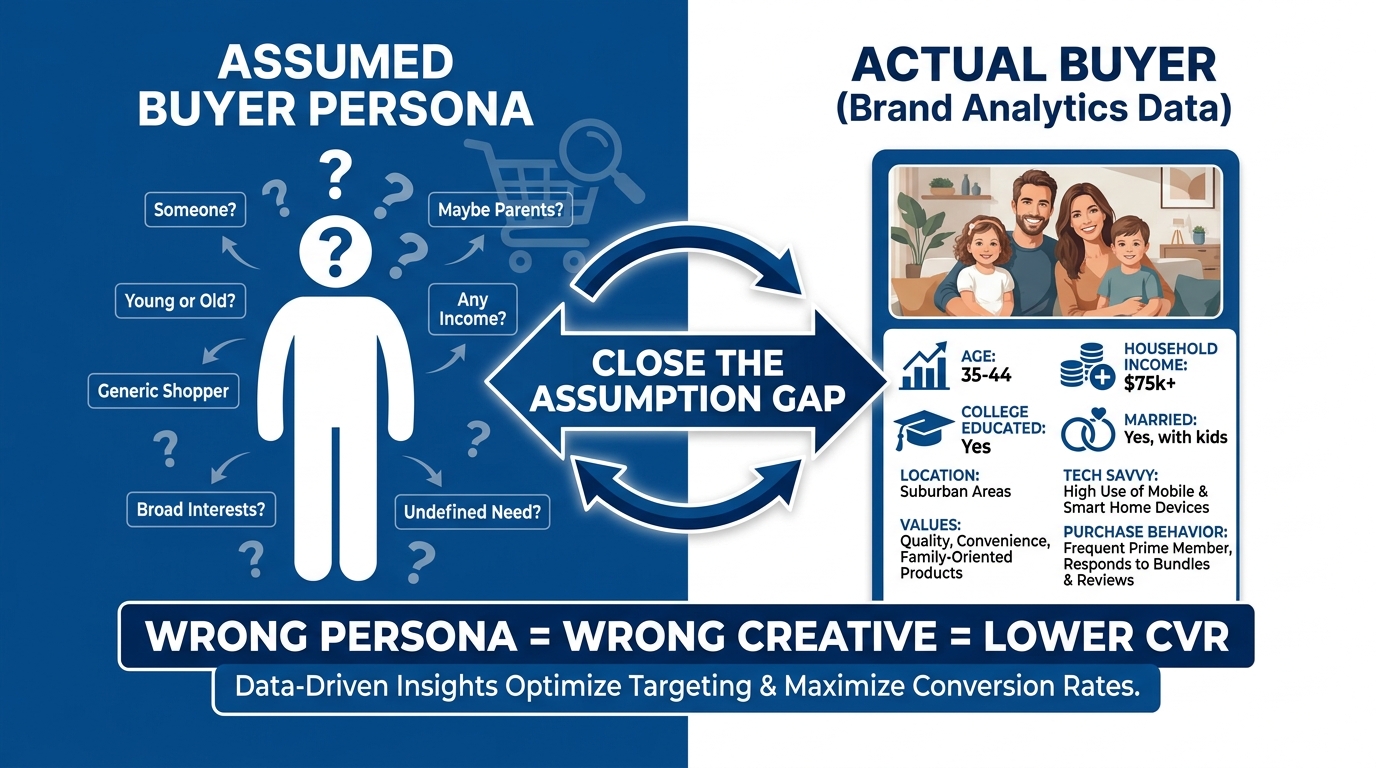
The Demographics report gives brand-registered sellers aggregate buyer profiles — age, household income, education level, gender, and marital status — for ASINs with at least 100 unique buyers in the selected period. It’s the most underestimated report in the suite for sellers who run multi-channel marketing.
Why Persona Assumptions Are Expensive
Most brands operate with a buyer persona built during the product development or early launch phase. That persona is based on who the founders thought would buy the product, or who the early marketing was aimed at. The Demographics report frequently contradicts it.
A supplement brand might assume their core buyer is a fitness-focused 25–34-year-old male. The Demographics data might reveal that 68% of actual buyers are 45–54-year-old women with household incomes above $75,000. These are not the same person, and the same listing copy, the same ad creative, and the same keyword strategy do not work equally well for both.
The cost of an inaccurate persona is not just a lower conversion rate on your current traffic. It’s every ad dollar you’ve spent on audiences that don’t match your actual buyers, every listing optimization decision made with the wrong end-reader in mind, and every A+ Content module written for a customer who doesn’t represent your sales base. These errors compound over time and they’re invisible until you check.
ASIN-Level Persona Divergence
One of the more granular findings available in the Demographics report is that buyer profiles often vary meaningfully between ASINs in the same brand catalog. A brand selling both a budget and a premium version of the same product might find that the budget ASIN attracts a younger, lower-income buyer while the premium ASIN attracts an older, higher-income buyer — which has direct implications for how those two ASINs should be priced, marketed, and positioned in advertising creative.
Running the Demographics report at the ASIN level (rather than brand aggregate level) and then comparing the profiles across your top-selling SKUs is one of the fastest ways to identify whether your catalog is actually serving distinct customer segments — and whether your advertising budget is treating them as though it knows the difference.
Off-Amazon Activation
The Demographics report’s data becomes most powerful when used as targeting input for off-Amazon channels. Meta, Google, and TikTok all allow demographic targeting that overlaps substantially with the dimensions Amazon’s report tracks — income, age, education, and household composition in particular.
Rather than using demographic targeting based on assumptions or platform-suggested audiences, sellers who have connected their Brand Analytics data to their off-Amazon targeting decisions are seeing materially better off-Amazon ROAS. You’re not guessing at who buys your product — you’re replicating the profile of people who already have, at scale, on channels where those audiences are reachable at lower CPMs than Amazon search.
Creative Alignment
Demographics data also directly informs creative strategy. If your confirmed buyer is 35–44, married, college-educated, and household income $75K+, the lifestyle context in your images, the language register in your copy, and the benefit framing in your ads should all be calibrated to that person’s life — not to a hypothetical one. This is especially high-leverage for Sponsored Brands video, where the messaging window is tight and the contextual cues have to land quickly.
API Access and Automation: Turning ABA Into a Decision Engine
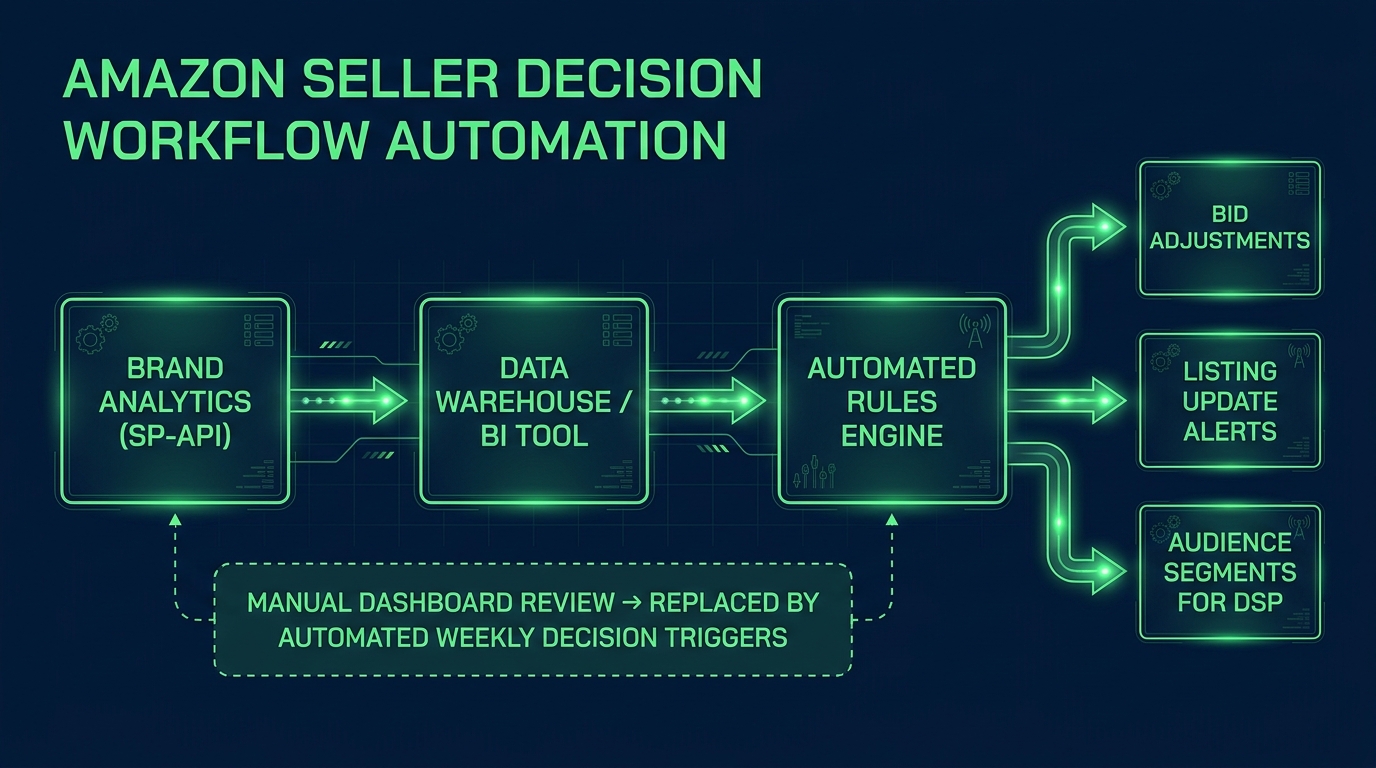
For sellers managing more than a handful of ASINs, the manual Brand Analytics workflow has a fundamental scaling problem: there’s too much data, refreshed too frequently, across too many reports to review comprehensively in a dashboard-click-and-read rhythm. The sellers building a durable analytics advantage in 2026 are not reviewing dashboards — they’re building systems that review the data for them and surface only the decisions that require human judgment.
The SP-API Foundation
Amazon’s Selling Partner API (SP-API) now exposes Brand Analytics report data programmatically. This means that the Search Query Performance data, Search Catalog Performance data, and Repeat Purchase Behavior data that you normally pull from Seller Central’s UI can instead be pulled automatically into a data warehouse, a BI tool, or a custom analytics layer — on a schedule, without manual intervention.
This is the foundational shift that separates sellers building a data moat from sellers who are still doing manual spot-checks. Once your ABA data is flowing into a warehouse automatically, you can do things that are impossible in the native Seller Central interface:
- Track weekly changes in your click share and purchase share across hundreds of queries simultaneously, and get flagged only when a metric moves beyond a threshold you define
- Join Brand Analytics keyword data with your Sponsored Ads search term reports to identify terms where organic share is declining, ad performance is strong, and you should be increasing bid to protect position
- Calculate wasted visibility automatically across your full keyword set and prioritize listing improvements by revenue impact, not just by eyeballing the dashboard
- Monitor branded search term capture rate as a weekly KPI and get alerted when competitors appear to be increasing pressure on your brand name
Third-Party Tool Integration
For sellers who aren’t building custom data pipelines, several third-party tools now connect to the SP-API Brand Analytics endpoints and offer automated monitoring with alerting. The important thing to evaluate in any such tool is whether it actually exposes the underlying data for your own analysis or whether it only shows you its own derived metrics — the latter locks you into the tool’s interpretation of your data rather than your own.
Amazon’s Business Solutions Agreement has tightened around third-party API access in 2025–2026, requiring clearer authorization and compliance documentation from tools that access Seller Central data on behalf of sellers. If you’re connecting a third-party tool to your Brand Analytics via API, verify it meets the current BSA requirements — non-compliant tools risk having their API access revoked, which can disrupt any automated workflows you’ve built on top of them.
Building Decision Triggers, Not More Reports
The highest-value application of ABA automation is not creating more comprehensive reports — it’s reducing the number of decisions that require manual review. Well-designed automation should surface three types of triggers: listings that need to be reviewed because a metric dropped materially, keywords where budget reallocation is mathematically indicated, and customer cohorts (from Loyalty Analytics or Repeat Purchase data) that have crossed into an “at risk” threshold and need DSP or email intervention.
Every trigger that fires automatically is a decision that gets made in hours rather than being missed for weeks because no one happened to open the right report at the right time.
Connecting Brand Analytics to DSP for Cross-Channel Activation
The gap between Amazon Brand Analytics and Amazon DSP is smaller in 2026 than it’s ever been, and sellers who have learned to bridge it are finding meaningful efficiency gains in their media spend — both on and off Amazon.
How Brand Analytics Data Feeds DSP Audiences
Amazon DSP allows advertisers to build audiences based on Amazon’s first-party purchase, browse, and search behavior data. The strategic alignment available to brand-registered sellers is this: the patterns you identify in Brand Analytics — who your buyers are, what they buy alongside your products, which customers are at risk of lapsing, which segments have the highest LTV — can directly inform how you configure DSP audiences and how you allocate DSP budget across them.
The Demographics report tells you the age, income, and household profile of your buyers. DSP allows you to build lookalike audiences based on purchaser behavior. If your confirmed buyers skew toward a specific income and education band, your DSP prospecting audiences should prioritize those profiles — not the category-generic “shoppers interested in [your category]” segments that everyone in your vertical is also using.
The Repeat Purchase to DSP Retargeting Pipeline
One of the most direct Brand Analytics to DSP applications is using Repeat Purchase Behavior data to set DSP retargeting windows. If your typical repeat purchase cycle is 60 days, your DSP retargeting campaign targeting recent purchasers should begin escalating ad frequency at day 55–65 — not in a constant drip that wastes impressions in the weeks when a repurchase isn’t yet likely.
This requires knowing your actual repurchase cycle from Brand Analytics data, not assuming a generic window. Different ASINs in your catalog will have different cycles. A supplement taken daily has a shorter cycle than a cleaning product used weekly. Your DSP retargeting schedule should be calibrated per ASIN, not set uniformly across your catalog.
Off-Amazon Signal Extension
Amazon’s clean room capabilities (through AWS Clean Rooms) have expanded the ability of brand-registered sellers to connect Amazon purchase data to off-Amazon media in a privacy-compliant way. While full clean room implementation is typically the domain of enterprise-level advertisers, the directional trend for 2026 is toward using Amazon first-party data — including what Brand Analytics reveals about your buyer profile — as the input for targeting decisions on Google, Meta, and connected TV, with Amazon DSP serving as the bridge.
The practical version of this for mid-market sellers is simpler: use your Demographics data to create lookalike audiences on Meta and Google that mirror your confirmed Amazon buyer profile, then measure whether the ROAS on those off-Amazon audiences approaches the efficiency of your Amazon advertising. If it does, you have a scalable customer acquisition pathway that doesn’t compete in Amazon’s auction at all.
Building a Competitive Share-of-Voice Map from Native Data
Share of voice (SOV) is typically thought of as a metric that requires expensive third-party tracking tools. In practice, Brand Analytics provides enough raw material to build a reasonably granular SOV map using data you already have access to — and do it at a query-level precision that most SOV tools don’t match.
The SQP Share-of-Voice Construction
SQP shows you, for each query your brand appears on, the top three competing brands by click share. This means that for your highest-volume search terms, you can track the relative click share positions of your brand and your top two or three competitors simultaneously — every week, for up to five years back.
Charting this over time produces a share-of-voice trend line that tells a story no ranking report can tell: not just where your products rank, but what percentage of the actual click traffic you’re capturing versus competitors. A product that ranks #1 organically but whose click share is declining because a competitor’s Sponsored Brands placement has expanded tells a different strategic story than a product whose rank and click share are both stable.
Identifying Vulnerability and Opportunity Simultaneously
The share-of-voice map derived from SQP data reveals two categories of keywords that deserve immediate strategic attention:
Vulnerability keywords: Queries where your impression share is strong but a competitor’s click share is growing. They’re appearing more and getting more clicks. Either their ad spend is increasing, their listing is improving, or both. These are terms where you need to defend more aggressively before the trend becomes entrenched.
Opportunity keywords: Queries where you hold a meaningful click share and your purchase share is strong, but impression share is below where it could be. You’re converting well when you appear — the constraint is appearing often enough. These are terms where incremental ad spend is backed by demonstrated conversion ability, which makes them lower-risk budget expansions than terms you’ve never appeared on.
Competitive Catalog Intelligence
A secondary competitive intelligence layer available from Brand Analytics is the Market Basket data of your competitors’ ASINs — specifically, whether your products appear in the baskets of customers buying competitor products. You can’t see this directly in ABA (you only see data for your own ASINs). But you can infer it from the reverse: if a competitor’s ASIN appears in your Market Basket data, your product also likely appears in theirs. This tells you that customers are already comparison-shopping or bundling across your brands — information that should shape your ASIN-level targeting in Sponsored Products.
Building a Weekly Brand Analytics Rhythm That Actually Gets Used
The most common failure mode with Brand Analytics is not ignorance — most brand-registered sellers know these reports exist. The failure mode is inconsistency. Reports are checked reactively when something seems off, or during a quarterly review, or when a consultant mentions them. By the time you notice the signal, the window to act on it efficiently has often closed.
A Practical Weekly Review Structure
The sellers getting consistent value from Brand Analytics run a structured weekly review that takes between 30 and 60 minutes for a catalog of 20–50 ASINs. The structure looks like this:
Monday (15 min) — Search Performance Check: Pull SQP for the trailing 7 days. Flag any terms where click share or purchase share moved more than 3 percentage points week over week. These are your action items for the week. For downward movements, diagnose the cause (competitor activity, listing issue, pricing change). For upward movements, identify whether the gain can be reinforced with increased bid or listing improvement.
Wednesday (15 min) — Retention Pulse: Check Repeat Purchase Behavior and Customer Loyalty Analytics for any segment shifts. If the percentage of “At Risk” customers has increased since the prior week, that’s the trigger to activate or increase DSP retargeting. If Champions/Loyalists grew, that’s a signal that your recent catalog or creative changes are working.
Friday (15 min) — Competitive Intelligence: Review branded term performance for any changes in competitor click share. If a competitor’s share on your branded terms increased, check whether they launched a new ad campaign by looking at Sponsored Ads placement data for your brand terms. Escalate branded defense bids if the encroachment is significant.
Monthly (60 min) — Deep Audit: Run Market Basket Analysis across your top 20 ASINs and look for emerging co-purchase patterns you haven’t yet acted on. Run Demographics at ASIN level for any new launches to validate persona assumptions made during product development. Export SQP history data to update your share-of-voice trend lines for the month.
The Compounding Effect
The reason this rhythm is worth building is not that any single week’s review produces a dramatic result. It’s that the accumulation of small, consistent adjustments — bid changes driven by real click share data, listing tweaks driven by wasted visibility analysis, DSP interventions driven by loyalty segment shifts — produces results that compound over a six-to-twelve-month horizon in a way that reactive, ad-hoc data use never does.
Brands that have operated this kind of structured Brand Analytics rhythm for a full year typically find that their data tells a story: where they grew share, where they lost it, which products have genuine retention strength, and which are structurally dependent on new-customer acquisition. That narrative is not available from any single report. It emerges from the pattern across all of them, over time.
Conclusion: The Sellers Who Will Win on Data Are Already Building the Habit
Amazon Brand Analytics in 2026 is not a reporting tool — it’s a decision infrastructure. The difference is how you interact with it. A reporting tool tells you what happened. A decision infrastructure tells you what to do next and why.
The six reports in the ABA suite cover the entire arc of your Amazon business: how your products appear and perform in search (SCP and SQP), how competitive your position is on any given keyword (SQP share data), how your existing customers behave after purchase (Repeat Purchase Behavior and Customer Loyalty), who those customers actually are (Demographics), and what else they buy (Market Basket). Taken together, they constitute a complete operational picture of your brand’s health on the platform.
The sellers pulling ahead of their competitors right now are not doing so because they have access to data others don’t. They have the same access. What they’ve built is a systematic approach to turning that data into decisions — at pace, with consistency, and with each report’s findings connected to the others rather than treated in isolation.
The first step is not buying a new tool or hiring a new analyst. It’s committing to a weekly review rhythm and deciding, in advance, what each report’s outputs will trigger. Start with Search Query Performance and Repeat Purchase Behavior — the highest-signal reports in the suite for most Amazon businesses. Build the habit before building the automation. And then, as the rhythm becomes second nature, extend it into API integration, DSP activation, and competitive share-of-voice mapping.
The data is already there. The question is whether you’re checking it — or reading it.