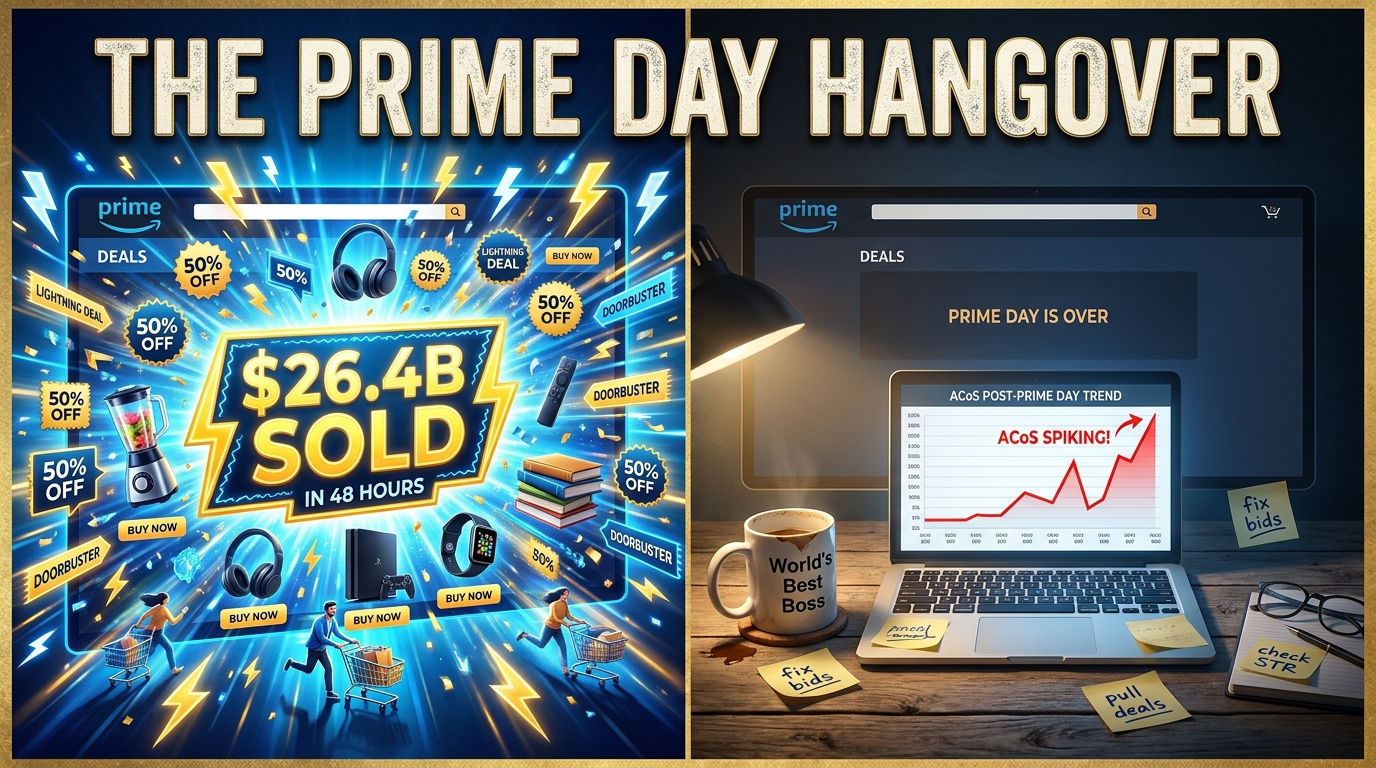

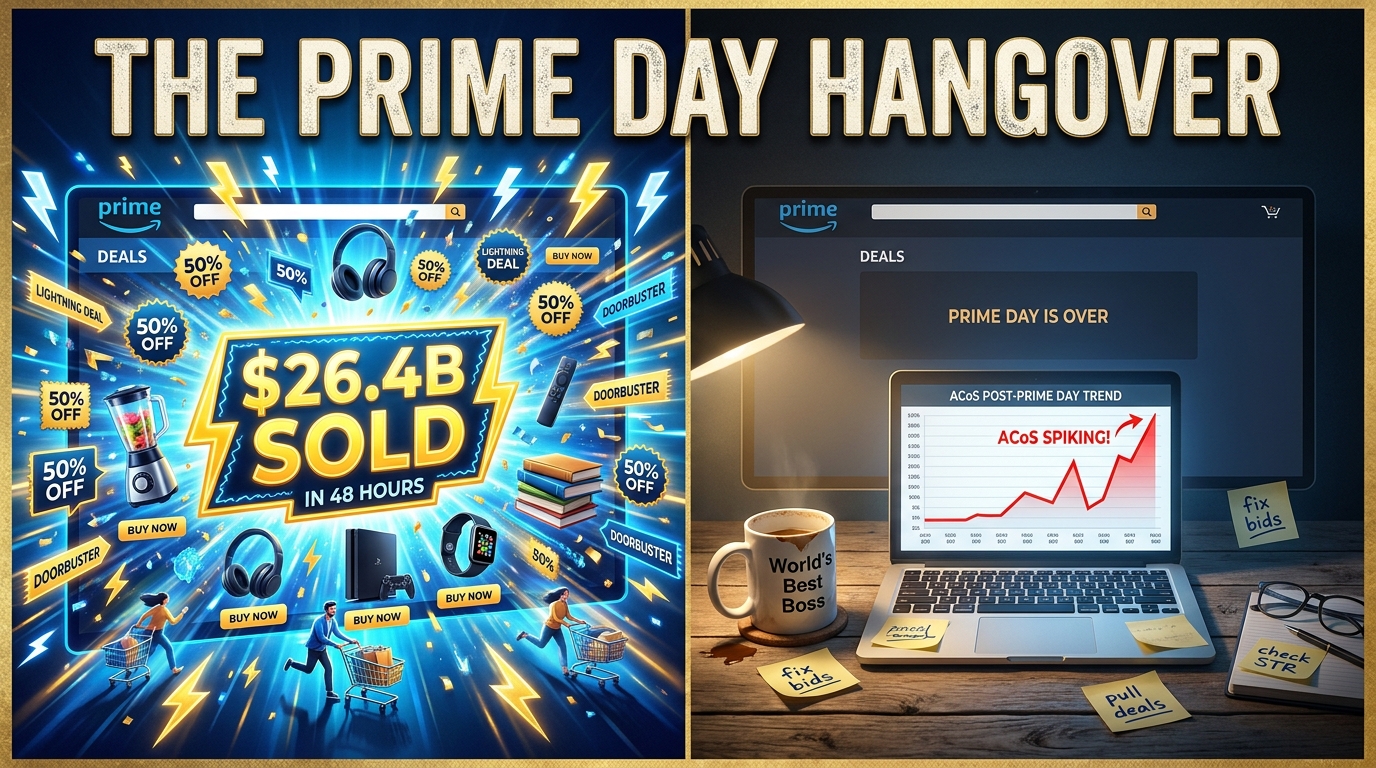
Prime Day is over. The confetti has settled, the lightning bolt badges are gone, and somewhere between the revenue highs and the ad spend panic, you’re staring at a campaign dashboard that looks like it survived a Category 4 hurricane. ACoS is elevated. Reference prices are sitting in the wrong place. Bids that were necessary on Day 1 are now quietly draining margin on Day 5. And the search term report? It’s six hundred rows of data you haven’t touched yet.
This is the Prime Day hangover — and it’s more common than most sellers admit.
Prime Day 2026 was, by any headline measure, extraordinary. U.S. online spend hit $26.4 billion across the four-day event (June 23–26), up 9.3% year over year, making it the largest online shopping event in U.S. history — bigger now than Black Friday and Cyber Monday combined. But record sales don’t automatically translate into record profits. Behind those headlines, average order values declined, discounts ran shallower than in prior years, and ad spend fell roughly 8.8% year over year even as conversion rates climbed 17%. The event was more efficient for consumers than it was painless for sellers.
What happens in the week after Prime Day often determines more of your Q3 outcome than the event itself. The brands and sellers who treat this window as a passive cool-down lose the rank gains they fought hard to earn. The ones who run a structured, phased cleanup — ads, deals, pricing, inventory, retargeting — capture the halo and walk into the back half of the year in a genuinely stronger position.
This piece is that cleanup guide. No vague advice about “optimizing your campaigns.” Specific, sequenced actions, grounded in what the 2026 data actually shows, covering everything from bid step-downs and search term mining to reference price recovery, retargeting architecture, and what Prime Day’s data should tell you about your Q3 budget.
What Prime Day 2026 Actually Left Behind
Before you can clean up, you need an honest read of the landscape. Prime Day 2026 created a specific set of conditions that differ from prior years — and those differences matter for how you sequence your recovery.
The efficiency reversal
One of the most important data points to understand is this: ad spend fell while conversion rates climbed. CommerceIQ data shows 2026 Prime Day ad spend down roughly 8.8% year over year, while conversion rates rose approximately 17%. That sounds like great news — and during the event, it often was. But it also means your campaigns were running in an artificially high-conversion environment that no longer exists once the event ends.
Bids set during the event are calibrated to that environment. If you don’t step them down deliberately, you’re paying event-level CPCs for post-event conversion rates — a recipe for rapid ACoS deterioration.
The discount compression reality
Average discount depth in 2026 was 20.9%, down from 21.8% in 2025 and 24.9% in 2024. That’s a three-year trend toward shallower discounts, and it matters for the cleanup phase because reference price rules are now stricter. Amazon’s 2026 pricing policy requires Prime Day prices to be at or below the lowest price in the last 60 days — including coupons and flash sales. That means if you ran aggressive promotional pricing to qualify for deal badges, your reference price window is now affected for up to two months. Understanding where your reference prices landed is the first pricing task of the cleanup.
The halo effect — still real, but selective
Data from agency reporting shows that non-participating brands on Amazon still saw approximately a 46% sales lift versus their 30-day baseline during the Prime Day window. Days 3–4 after the event showed combined sales up 236.82% versus the same post-event period last year. The halo is real — but 2026 data shows it’s increasingly concentrated among brands that actively capture post-event traffic rather than passively waiting for it. Fifty-five percent of Prime Day shoppers reported that the event “trained” them to seek wider promotions, and 48% planned purchases around discount events. That’s a sophisticated, deal-primed audience you can still reach — if you move fast enough.
The inventory imbalance problem
Brands entered Prime Day 2026 with about 12% more inventory year over year. And yet revenue lost to out-of-stocks actually rose 24%, because shortages were concentrated in the highest-revenue ASINs. The problem isn’t total inventory — it’s the mismatch between what sold fast and what’s now sitting in fulfillment centers eating storage fees. Your cleanup window is the time to rebalance that, not ignore it.
The 72-Hour Triage Window: What to Touch First
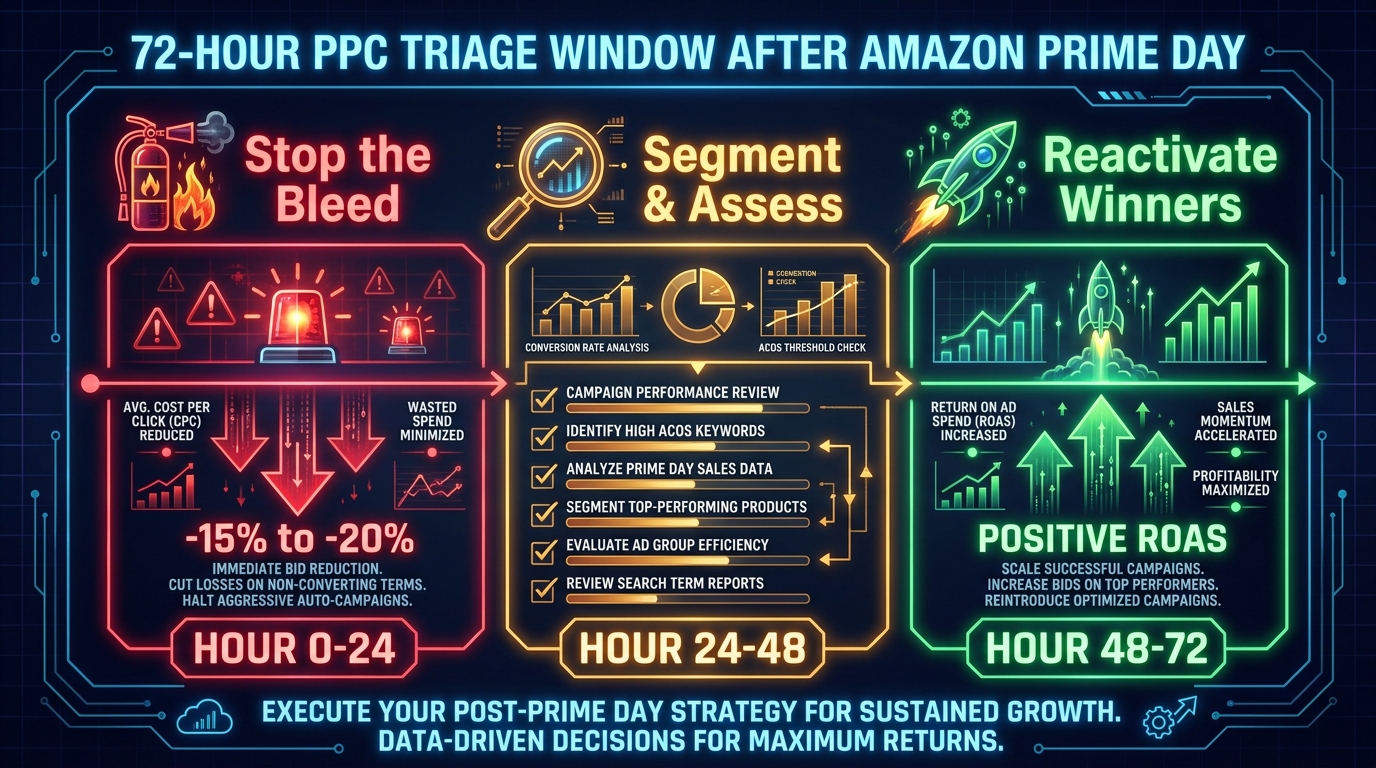
The first 72 hours after Prime Day ends are the most consequential. This is when the decisions you make — or don’t make — determine whether your account recovers cleanly or bleeds into an inefficient Q3. The goal isn’t to slash spend. It’s to stop the waste while preserving every ranking gain you bought during the event.
Hours 0–24: Stop the bleed
The single most important move in the first 24 hours is a controlled bid reduction of 15–20% from event peaks. Not a hard reset to pre-Prime Day levels — that’s too aggressive and risks the BSR and keyword rank momentum you’ve built. Just pull the emergency brake off the gas.
Specifically: identify the campaigns where you manually elevated bids for Prime Day traffic and step those bids back. If you used rule-based automations to push bids during the event window, pause or modify those rules immediately so they’re not still firing against post-event traffic at event-day rates.
Simultaneously, pull your “dynamic bids — up and down” campaigns and switch them temporarily to “dynamic bids — down only.” This lets Amazon’s algorithm protect you from paying above-baseline CPCs while still capturing conversions when they occur. This is a bridge setting, not a permanent one — but it’s valuable for Days 1–5 while traffic and conversion patterns settle.
Hours 24–48: Segment and assess
Once the immediate bleeding is addressed, your task is segmentation. Pull your campaign performance by ASIN and separate your catalog into three buckets:
- Hero ASINs: Products that drove the majority of Prime Day revenue and achieved meaningful BSR gains. These deserve sustained spend at slightly elevated (not event-level) bids to defend rank.
- Performers: ASINs that converted well but aren’t category leaders. Normalize bids toward pre-event levels, but keep them in the game.
- Disappointments: ASINs that ran significant ad spend during the event but failed to convert at expected rates. Cut bids aggressively here. Don’t throw good money after bad.
This ASIN-level segmentation is what separates a thoughtful cleanup from a blunt instrument. Cutting spend uniformly across your catalog punishes the winners to spare the losers — exactly backwards.
Hours 48–72: Reactivate selectively
By hour 48, you should have enough post-event performance data to start making forward-looking decisions. Any campaign that’s already showing strong ROAS at normalized bids gets maintained or cautiously scaled. Any campaign still showing event-level spend with post-event conversion rates gets another bid cut.
This is also when you begin your search term report pull — covered in the next section — and when you should be setting up or activating your retargeting campaigns. The 72-hour window closes before most of your post-event opportunities expire. Move deliberately, but move.
Bid Step-Down Without Killing Your Rank
The fear that keeps sellers from cutting bids fast enough is legitimate: drop bids too sharply, and you lose the organic rank gains that Prime Day’s sales velocity delivered. Lose those gains, and you’ve paid event-level CPCs for a BSR improvement that vanishes within days. That’s the nightmare scenario — and it’s avoidable with a phased approach.
The staircase model
The framework that most Amazon agencies and tools have converged on for 2026 is what practitioners are calling a “staircase” bid reduction. Rather than cutting bids in one move, you reduce in steps of roughly 10% every 2–3 days over a 7–10 day period.
A rough schedule looks like this:
- Day 1: Reduce to 85% of event-peak bids
- Day 3: Reduce to 75% of event-peak bids (if BSR is holding)
- Day 5–7: Reduce to 60–65% of event-peak bids, approaching your Q3 baseline target
- Day 10: Complete normalization to post-event baseline
At each step, you’re checking two metrics before proceeding: BSR trend and organic impression share. If BSR is holding or improving on organic sales alone, the reduction is safe. If BSR is sliding faster than expected, hold the current bid level for another day before cutting further.
The ACoS trap — and why to use TACoS instead
One of the most common post-Prime Day mistakes is using ACoS as the primary metric during this normalization phase. ACoS is a campaign-level metric that doesn’t account for the organic sales your advertising spend is generating through rank maintenance. In the post-event window, advertising a dollar to protect a BSR position that generates three dollars in organic sales is a sound investment — but ACoS alone won’t show you that.
Switch your primary metric to TACoS (Total Advertising Cost of Sales) for the duration of the normalization period. TACoS = total ad spend ÷ total revenue (ads + organic). A TACoS rising slowly while organic revenue grows is a healthy sign. A TACoS rising while organic revenue flatlines means your rank defense isn’t working and it’s time to reassess.
One thing to exclude from your automation
If you use any form of AI-powered or rule-based bid automation — Amazon’s own bid optimizer, third-party tools like Perpetua, Quartile, or similar — you need to temporarily exclude your Prime Day performance data from the training window. These tools look backward to set forward bids. If they’re learning from Prime Day’s artificially elevated conversion rates, they’ll push bids higher than the post-event market supports. Most platforms have a date range exclusion feature. Use it. Pull the training window to start from the day after Prime Day ended.
Search Term Report Mining: The Event Just Handed You a Goldmine
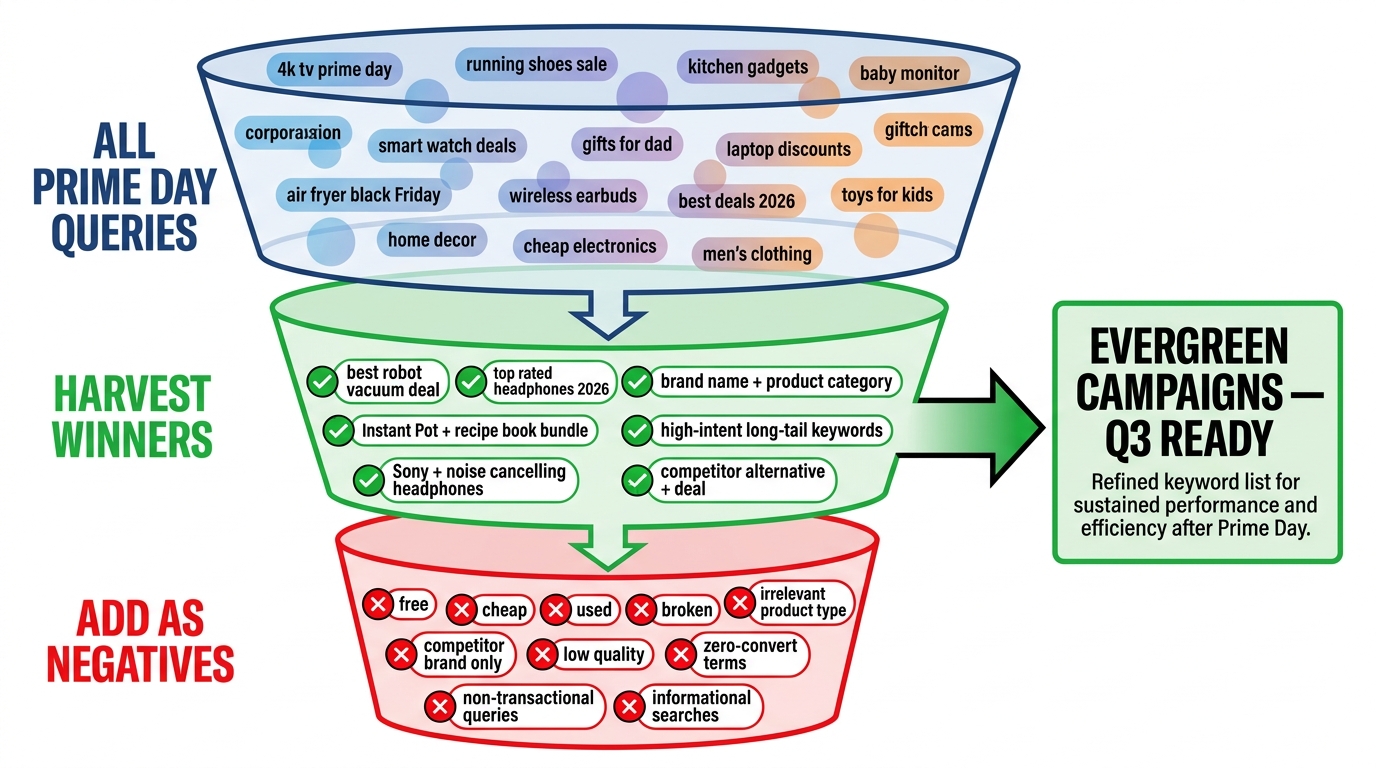
Prime Day is the largest controlled traffic experiment most sellers will run all year. In four days, your campaigns were exposed to an enormous volume of search queries — many of them new, many of them high-intent, and some of them completely irrelevant to your products. The search term report from Prime Day is one of the most valuable data assets you can extract from the event. Most sellers don’t mine it thoroughly enough.
Why Prime Day search data is different
During Prime Day 2026, search volumes spiked dramatically. In beauty alone, search volume rose 71% week over week, from 102.4 million to 174.8 million searches. That’s not a small statistical blip — that’s a fundamentally different query pool than your campaigns normally see. The queries generated during Prime Day include high-intent discovery searches from shoppers who weren’t in your category before, comparison queries from shoppers evaluating multiple products, and branded intent searches (brand-name queries rose to represent roughly 1 in 5 purchases in multiple categories).
That’s a rich seam of keyword intelligence. The question is what to do with it.
The two-pass cleanup process
Pull your search term report for the Prime Day window and run it through a two-pass process:
Pass 1 — Harvest the winners. Filter for search terms that generated sales with a conversion rate at or above your pre-event baseline. These are proven converters from a high-traffic environment. Add them as exact match or phrase match keywords in a dedicated manual campaign — ideally a separate campaign you label “Prime Day Harvest Q3.” These terms have demonstrated purchase intent at scale, and they belong in your evergreen campaign structure going forward.
Pass 2 — Negate the waste. Filter for search terms that generated clicks (and therefore spend) but produced zero conversions — particularly those with three or more clicks and no sale. Add these as negative exact or negative phrase matches across your auto and broad match campaigns. These are the terms that the event traffic inflated into your campaigns and that will keep draining budget if left unchecked. Cleaning these out is one of the highest-ROI moves you can make in the post-event window.
Building your Q3 keyword infrastructure
The best outcome of Prime Day search term mining is a cleaner, sharper campaign structure entering Q3. Sellers who skip this step carry bloated keyword lists forward — dozens of irrelevant queries eating small amounts of budget each day that add up to thousands of dollars of waste by October’s Big Deal Days.
Structure your Q3 campaigns around three tiers:
- Core exact match terms — your proven pre-event converters, refreshed and confirmed by Prime Day data
- Harvested Prime Day terms — new exact and phrase matches discovered from event traffic
- Broad/auto discovery — kept on lower bids with tight negative keyword lists to continue finding new terms without wasting spend
This three-tier structure gives you coverage without waste, and it’s built on actual conversion data rather than guesswork.
Deal Badge Removal and Reference Price Recovery
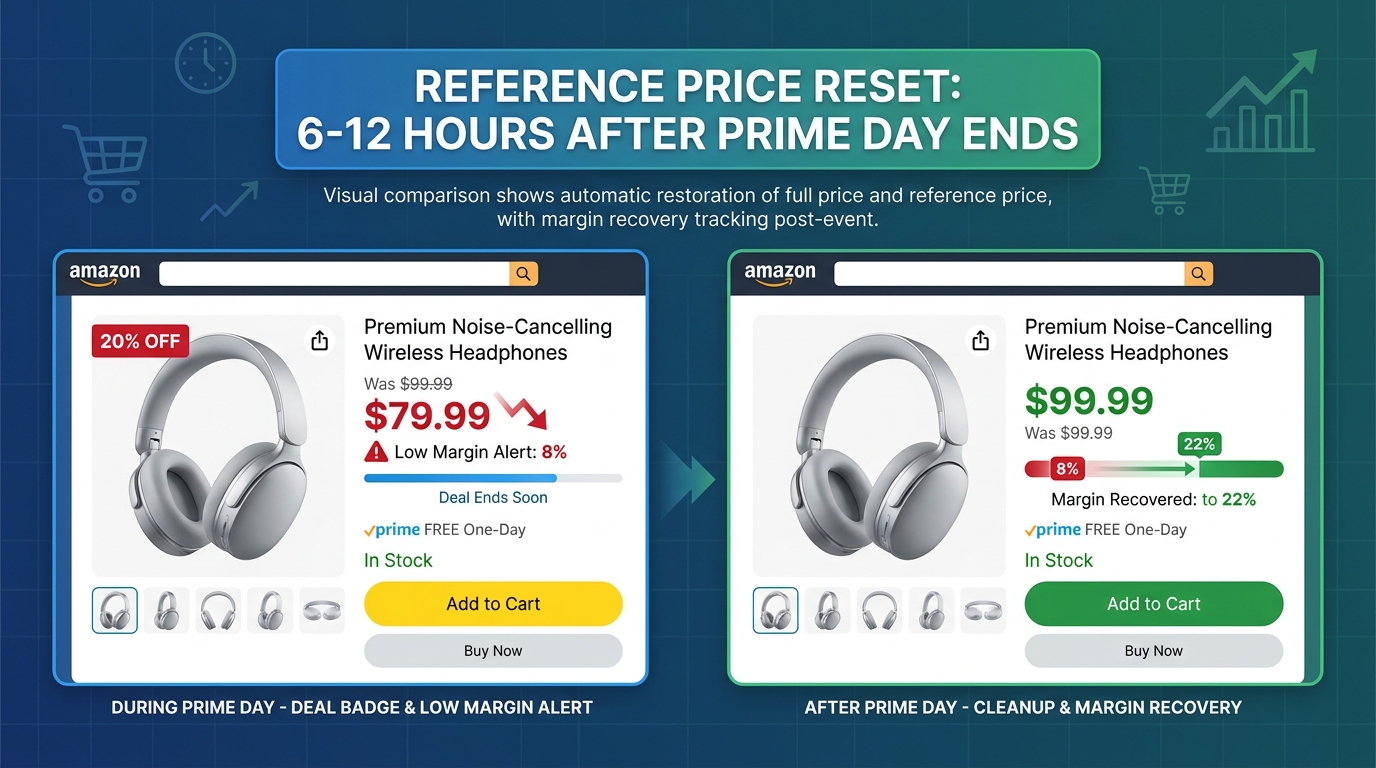
The PPC cleanup gets most of the attention in the post-Prime Day window. The pricing cleanup is equally important and often handled sloppily. Getting your prices and deal mechanics wrong in the days after Prime Day doesn’t just hurt short-term margins — it can lock you into unfavorable reference price structures for weeks.
The 60-day reference price window explained
Amazon’s 2026 pricing policy requires that any promotional price (including Prime Day deals) be at or below the lowest price the product has been offered in the previous 60 days, including coupons, lightning deals, and promotional codes. This rule was introduced to eliminate fake “was/now” deal framing — and it has a significant side effect for sellers in the cleanup phase.
If your Prime Day price was, say, $24.99 on a product you normally sell for $34.99, Amazon will show that $24.99 as part of the pricing history that governs your reference price for the next 60 days. That means any deals you run in July or August may need to be at or below $24.99 to qualify for the promotional badge — even if $34.99 is your legitimate everyday price.
The practical implication: reset your prices back to full everyday pricing as quickly as possible after Prime Day ends, ideally within 6–12 hours of the event closing. Every day you leave Prime Day pricing active after the event is another day you’re extending the window in which that discounted price affects your reference price floor.
Coupons vs. deal badges: the post-event tool
In the weeks after Prime Day, you may want to run some form of promotion to capture halo traffic without blowing your reference price floor further. The smarter tool here is a coupon rather than a Prime Deal or Lightning Deal badge. Coupons display a discount in search results, but they function differently from Prime Exclusive Discounts in terms of how they interact with reference pricing. More importantly, they let you control the discount amount with precision — so you can offer, say, a 5% coupon to remain competitive without running a 20% deal that resets your pricing floor all over again.
Watch your coupon redemption rate in this window. In high-demand categories, even a modest 5% coupon can drive meaningful conversion rate improvements in the post-event period when shoppers are still in deal-seeking mode.
Margin by SKU: the audit most sellers skip
Before you reprice anything, run a post-event margin audit by SKU. Prime Day’s volume spike can obscure the reality that some products sold at a loss once ad spend, deal fees, and FBA costs are factored in. Amazon introduced a performance-based promotion fee model in 2026 that means deal costs aren’t always flat — they scale with the deal’s performance, which is great when deals work and painful when they don’t.
For any ASIN where post-event margin analysis shows a net loss during the event window, the question isn’t just “how do we fix the price?” It’s whether the ASIN belongs in future deal promotions at all. Some products are better served by staying at full price with aggressive advertising than by discounting their way to profitless volume.
Retargeting the Halo: DSP, Sponsored Display, and the Non-Converter Problem
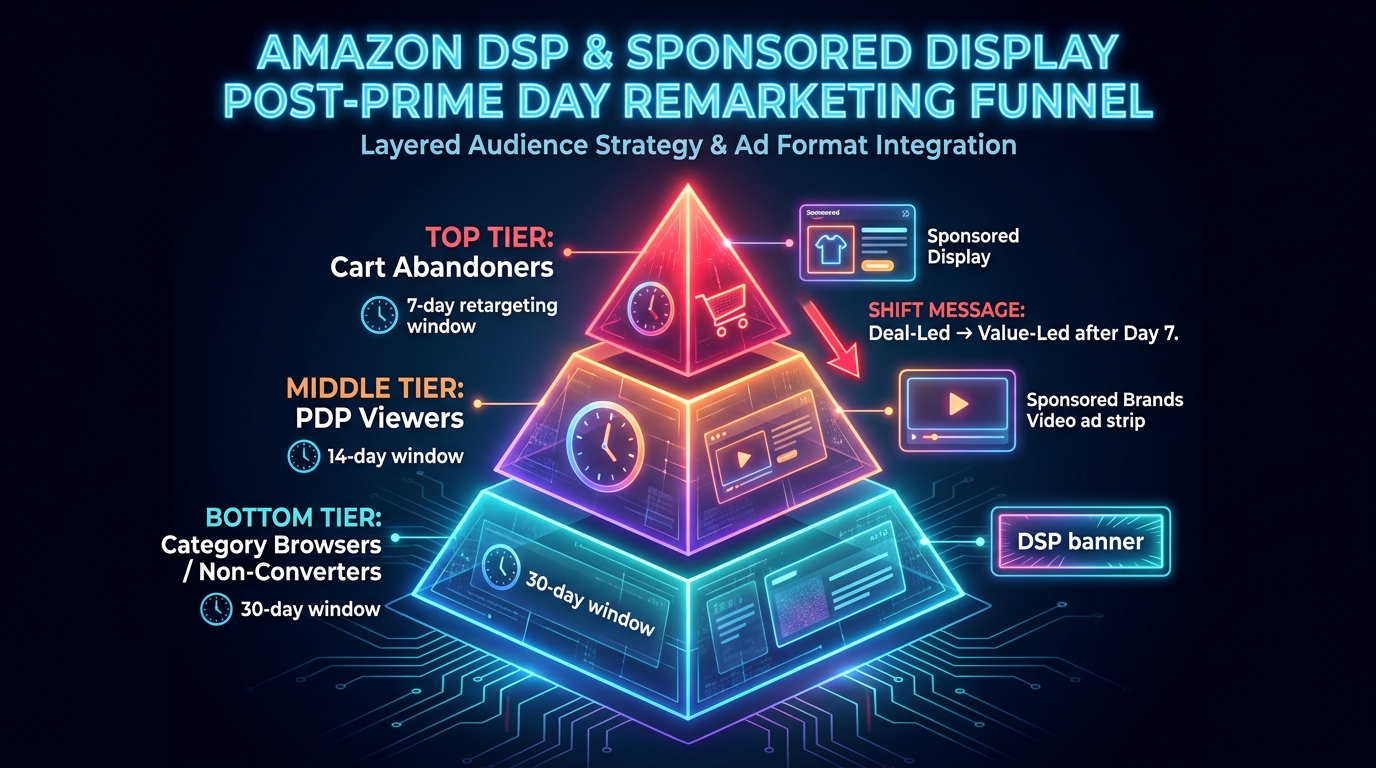
Prime Day created an enormous pool of warm, high-intent traffic. Most of it didn’t convert. That’s not a failure — it’s an asset, if you have the right machinery in place to work it.
During a four-day event that drove $26.4 billion in U.S. online sales, the sheer number of product detail page views, cart additions, and browse sessions that didn’t result in a purchase was enormous. These are people who were actively shopping in your category, saw your product, and for some reason — timing, price, comparison paralysis — didn’t buy. The post-event window is when you close that gap.
The three-tier audience framework
Structure your post-event retargeting around three audience tiers, each with different intent levels and therefore different bid strategies and creative approaches:
Tier 1 — Cart Abandoners (7-day window, highest intent). These are shoppers who added your product to cart or saved it during the event but didn’t complete purchase. Bid aggressively here — this is the most likely-to-convert segment. In Sponsored Display, target these audiences with your maximum post-event bids. In DSP, create a dedicated line item for cart abandoners with frequency caps of 3–5 impressions per day to stay visible without becoming intrusive.
Tier 2 — PDP Viewers (14-day window, high intent). Shoppers who visited your product detail page but didn’t add to cart. These people evaluated your product seriously enough to click through. Retarget them with Sponsored Display and Sponsored Brands Video, with creative that emphasizes the product’s value proposition rather than deal pricing. Bid at 70–80% of your Tier 1 levels.
Tier 3 — Category Browsers / Non-Converters (30-day window, moderate intent). Shoppers who browsed your category or competitor products during Prime Day but didn’t engage directly with your listing. This is a wider audience that requires lighter-touch messaging. Use DSP for broad awareness here, with creative focused on brand value rather than promotional urgency. Lower bids, longer run periods.
The messaging shift: from deal to value
This is where most sellers get retargeting wrong. They keep running Prime Day deal creative — “was $34.99, now $24.99” — into the post-event window. That messaging has two problems. First, your deal is over, so it’s either inaccurate or you’ve extended discount pricing you shouldn’t have. Second, it anchors the brand to discount expectations in the mind of a shopper who may be receptive to full-price purchase.
By Day 7 post-event, switch your retargeting creative to value-led messaging: product benefits, reviews, use-case imagery, and cross-sell opportunities for shoppers who already purchased. For past buyers, cross-sell and upsell messages (accessories, consumable refills, complementary items) often outperform brand awareness advertising at this stage of the funnel.
AMC audiences: the 2026 advantage
If you have access to Amazon Marketing Cloud, Prime Day creates an unusual data opportunity. AMC lets you build custom audiences based on cross-product event paths — for example, shoppers who viewed your product and a competitor’s product in the same session. These overlap audiences tend to be highly price-sensitive comparison shoppers, and they’re worth a dedicated retargeting campaign with messaging specifically designed to differentiate your product from the competitor they were considering.
Build these AMC audiences within the first week post-event while the Prime Day signal is fresh. Wait too long and the targeting window closes before you’ve activated it.
TACoS Normalization: The 4–6 Week Rebaseline Framework
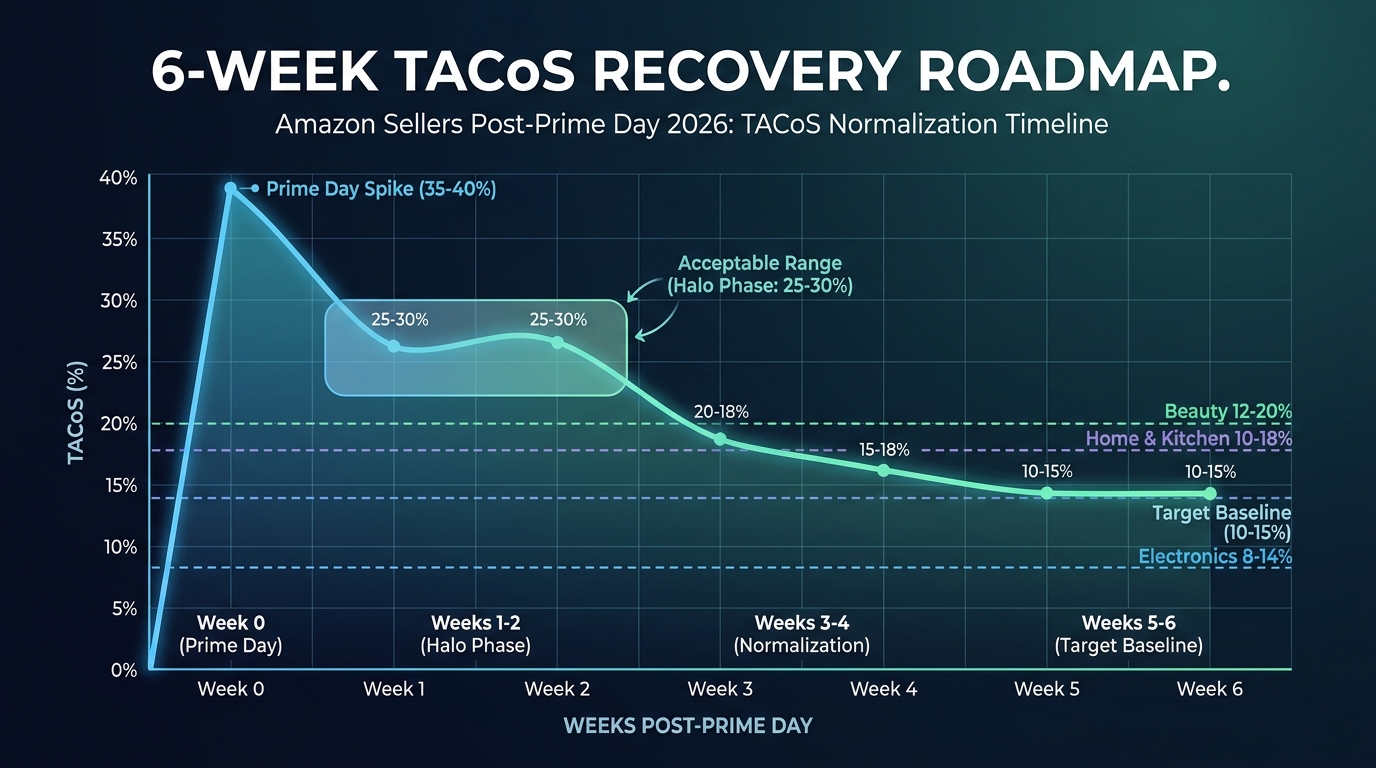
TACoS normalization is the medium-term challenge that most post-Prime Day guides don’t address with enough specificity. Yes, bids come down. Yes, campaigns get cleaned. But TACoS — total advertising cost as a percentage of total revenue — doesn’t normalize just because you reduced bids. It normalizes when your organic sales recovery matches the pace of your ad spend reduction. And getting that balance right requires a framework, not just intuition.
Where TACoS should land by category
Current 2026 benchmarks for post-event TACoS targets (once fully normalized, typically 5–6 weeks post-Prime Day) are:
- Electronics: 8–14% TACoS
- Home & Kitchen: 10–18% TACoS
- Beauty: 12–20% TACoS
- Apparel: 15–25% TACoS
For established products with strong organic rank, a normal TACoS might be 8–15%. New products or those still building rank can run higher — 20–30% — while building organic velocity. The post-Prime Day goal is to trend toward these targets by Week 6, not to hit them by Week 1.
The week-by-week TACoS trajectory
Think of the 6-week normalization window in three phases:
Weeks 1–2 (Halo Phase): TACoS will be elevated — potentially 25–40% for products that ran heavy event-level ad spend. This is expected and acceptable if your BSR is holding and organic impressions are growing. The halo effect (non-participating brands seeing ~46% sales lift, Days 3–4 post-event up 236% versus prior year) means conversion rates are still above baseline. Elevated TACoS against elevated organic revenue is a different story than elevated TACoS against flat organic revenue.
Weeks 3–4 (Normalization Phase): TACoS should be trending down toward the 15–20% range as CPCs ease and organic rank stabilizes. This is when your search term cleanup starts showing results — negative keywords reducing wasted spend, harvested terms improving relevance and conversion efficiency. Run weekly TACoS reviews and compare to the previous week’s trend rather than to an absolute target.
Weeks 5–6 (Rebaseline Phase): By this point, TACoS should be approaching category-normal benchmarks. If you’re still running 30%+ TACoS at Week 5, something structural needs to change — either your bids are still too high, your keyword list is still bloated, or your organic rank gains didn’t hold and you’re paying for conversions that should be organic.
The margin-anchored TACoS cap
One tactical tool worth adopting is a margin-based TACoS ceiling calculated as:
Max TACoS = Gross Margin − (Discount % + Fulfillment Cost % + Risk Buffer %)
Set this as a hard cap in your bidding automation. Any campaign running above this ceiling is, by definition, eating into profitability rather than building it. Campaigns below the ceiling have room to spend more to defend rank. This simple math — done at the ASIN level — turns TACoS normalization from a gut-feel exercise into a decision with actual numbers behind it.
Inventory Rebalancing After the Storm
The inventory picture after Prime Day 2026 is more complicated than “did you sell out or not?” The headline data tells the real story: brands entered the event with 12% more inventory than the prior year, but still saw a 24% increase in revenue lost to out-of-stocks. The implication is clear — inventory imbalances are SKU-level problems, not total-volume problems.
The three-bucket inventory audit
Run a post-Prime Day inventory audit across your catalog and sort every ASIN into one of three buckets:
Stockout casualties: ASINs that ran out of stock during the event. If a product was out of stock even for 24 hours during Prime Day’s peak, it lost sales it cannot recover through the halo effect. More importantly, the stockout signal affects organic ranking — Amazon’s algorithm reads stockouts as reduced availability and depresses keyword rank accordingly. For these ASINs, the immediate priorities are restocking the fastest possible channel (seller-shipped inventory if FBA stock can’t arrive in time), checking if the listing went inactive, and monitoring BSR and ranking for recovery over the next 2–3 weeks.
Inventory overhang: ASINs where you sent excess units and now face rising storage fees. This is particularly painful in the post-Q2 period because Amazon’s Q3 storage fee rates kick in and inventory-to-sales ratios start to be scrutinized more closely by Amazon’s system. For these ASINs, the decision tree is: Can you sell through with a small promotional push? Is a removal order cost-effective? Or does the excess inventory justify a bundle or multipacks listing to increase sell-through velocity?
Balanced performers: ASINs that sold well without stocking out and have reasonable remaining inventory. These need minimal intervention — just ensure reorder timing is aligned with your Q3 forecast, particularly if October’s Big Deal Days are on your promotional calendar.
FBA fee exposure after Prime Day
One frequently overlooked post-Prime Day task is a review of your FBA fee structure for any ASINs that sold enough volume to cross a size or weight tier threshold. High sales velocity can sometimes shift product configurations in Amazon’s measurement system, and if your product dimensions were borderline for a fee tier, a recheck after a high-volume event is worth the time. Similarly, verify that FBA inventory levels are correctly reflected in Seller Central — event-speed fulfillment sometimes creates temporary discrepancies that self-resolve, but catching them early prevents customer experience problems.
The reorder timing problem
For sellers with inventory leads of 6–12 weeks (typical for overseas manufacturing), the post-Prime Day window is when you should be making Q4 reorder decisions — not in September. Prime Day just gave you the most reliable signal of the year about which ASINs have real demand velocity. Use that data. If a product flew during Prime Day, that’s the clearest possible signal to carry deeper inventory into Q4. If a product sat even with ad support and aggressive pricing, don’t over-order on hope.
Q3 Budget Reallocation: Using Prime Day Data as Your Compass
Prime Day isn’t just a revenue event. For sellers and brands running structured advertising programs, it’s the richest data experiment of the year — four days of unusually high traffic, compressed purchasing intent, and revealing ASIN-level performance data. The sellers who use that data to reshape Q3 budgets outperform those who simply return to their pre-event spend patterns.
The concentration principle
One of the clearest findings from Prime Day 2026 advertising analysis is that accounts allocating 60–70% of their total spend to their top ten converting keywords outperformed more distributed setups on ACoS efficiency. Concentration beats coverage, particularly in a competitive advertising environment where CPCs vary significantly by keyword quality score and conversion relevance.
Use your Prime Day data to identify your true top-ten converting keywords across your catalog. Not the ones you assumed would be top performers — the ones that actually converted under event conditions. These terms should receive the majority of your Q3 budget, defended by exact match campaigns with strong negative keyword lists. Everything else — broad discovery, long-tail testing, experimental placement — gets a smaller budget allocation built on the efficiency gains of your core campaigns.
Building toward October’s Big Deal Days
Prime Day and Amazon’s October Prime Big Deal Days form a paired event structure that smart sellers treat as a single annual planning unit. The 90-day window between the events is your build period. Every dollar of Q3 advertising should be serving one of two objectives: maintaining the rank and organic velocity gained from Prime Day, or building toward the higher-intent shopping environment of Big Deal Days.
The practical implication: don’t treat Q3 as a coasting period between events. Use the first half (July–August) to normalize TACoS and defend BSR. Use the second half (September–early October) to build spend back up toward event-level bids on proven converters, targeting Big Deal Days with the same preparation discipline you applied to Prime Day.
The new-to-brand metric: your hidden Q3 asset
Prime Day typically drives a significant spike in new-to-brand (NTB) purchases — first-time buyers for your brand on Amazon. This is one of the most valuable outputs of the event because NTB buyers, if retained, become organic repeat purchasers who reduce your TACoS over time. Post-Prime Day, pull your NTB data and build a specific follow-up advertising strategy for this audience.
For consumable or repeat-purchase products, this might mean Sponsored Display ads for past purchasers timed to typical repurchase intervals. For durable goods, cross-sell and accessory campaigns targeted at new buyers work well. The cost of retaining a Prime Day NTB buyer through a well-timed follow-up ad is a fraction of the cost of acquiring a new customer cold — and the math compounds across every Q3 campaign you run.
Budget calibration against Q3 benchmarks
Set your Q3 advertising budgets against three anchors drawn from your Prime Day data:
- Your cost per new-to-brand customer during Prime Day — this is your acquisition cost benchmark. Any Q3 campaign spending more per NTB than your Prime Day rate needs justification.
- Your top-10 keyword CPCs from the event — these are your maximum bid ceilings in Q3, since normal-period CPCs should be lower than event-period CPCs in most categories.
- Your ASIN-level ROAS from the halo period (Days 3–7 post-event) — this is a better Q3 baseline than event-day ROAS, which was inflated by event conversion dynamics that don’t persist.
Taken together, these three anchors let you set Q3 budgets with real data rather than estimates, and give you defensible benchmarks for when you need to make mid-quarter adjustments.
The Mental Model Shift: From Event to System
Perhaps the most important takeaway from Prime Day 2026’s data isn’t tactical — it’s conceptual. The sellers who navigated the post-event window best weren’t the ones with the most sophisticated tools. They were the ones who stopped thinking about Prime Day as a discrete event and started thinking about it as one phase in a continuous advertising and commercial system.
In that system, Prime Day is the data-collection and velocity-building phase. The post-event window — Days 1 through 42 — is the analysis, cleanup, and optimization phase. Q3 is the steady-state operation phase, building toward the next event. And the next event (Big Deal Days) is when the cycle repeats with better data and cleaner infrastructure than the previous iteration.
The hangover metaphor is appropriate, but only up to a point. A hangover implies suffering followed by return to baseline. What the best Amazon operators are doing post-Prime Day isn’t returning to baseline — they’re locking in a higher one. Rank gains from Prime Day’s sales velocity don’t disappear overnight if you protect them. Keyword intelligence from Prime Day’s search traffic doesn’t expire if you harvest it. NTB customers from Prime Day don’t vanish if you engage them.
The event is over. The work it generated is just beginning.
Actionable Post-Prime Day Checklist
To make this concrete, here’s the sequenced checklist that brings everything together. Time-box each phase and don’t let the urgency of Day 1 tasks crowd out the strategic importance of Week 3–6 work.
Days 1–3: The triage phase
- Reduce bids 15–20% from event peaks on all manually elevated campaigns
- Switch dynamic bid strategies from “up and down” to “down only”
- Segment catalog into Hero / Performer / Disappointment ASINs
- Reset product prices to full everyday pricing (within 6–12 hours post-event)
- Exclude Prime Day data from bid automation training windows
- Pull search term report and begin Pass 1 (harvest winners)
- Identify stockout ASINs and initiate restocking
Days 4–7: The cleanup phase
- Complete Pass 2 of STR cleanup (add negative keywords)
- Build Prime Day Harvest campaign with exact/phrase match converters
- Activate Tier 1 retargeting (cart abandoners, 7-day window)
- Activate Tier 2 retargeting (PDP viewers, 14-day window, value-led creative)
- Run post-event margin audit by ASIN
- Begin FBA inventory rebalancing decisions
- Review and resolve any stranded inventory
Weeks 2–6: The normalization phase
- Continue staircase bid reductions per BSR and organic impression data
- Monitor TACoS weekly against category benchmarks
- Shift retargeting creative from deal-led to value-led messaging
- Activate Tier 3 retargeting (category browsers, 30-day window)
- Build AMC overlap audiences from Prime Day event data
- Finalize Q3 budget reallocation based on Prime Day concentration analysis
- Place Q4 inventory reorders based on Prime Day velocity data
- Begin Big Deal Days planning and qualification timeline
Conclusion: The Hangover Ends When You Decide It Does
There’s a reason the post-Prime Day window gets less attention than the event itself. Preparation is exciting. Cleanup is work. But the cleanup is where the money actually lands.
Prime Day 2026 drove $26.4 billion in U.S. online sales, a 9.3% year-over-year record. But the conversion rate gains, keyword intelligence, new-to-brand acquisitions, and BSR improvements that the event generated aren’t automatically banked. They require active management to convert into durable, compounding advantages — lower organic TACoS over time, stronger keyword rankings entering Q4, a retargeting pool that reduces cold acquisition costs, and a cleaner campaign structure that performs more efficiently across the back half of the year.
The sellers who treat the post-Prime Day period as a passive cool-down period will watch those advantages evaporate over the next two to four weeks. The sellers who run the structured triage, cleanup, and normalization process outlined here will walk into Q3 carrying something more valuable than the revenue number Prime Day generated: a catalog and campaign infrastructure that’s measurably stronger than it was before the event started.
The hangover ends when the cleanup does. Get started.