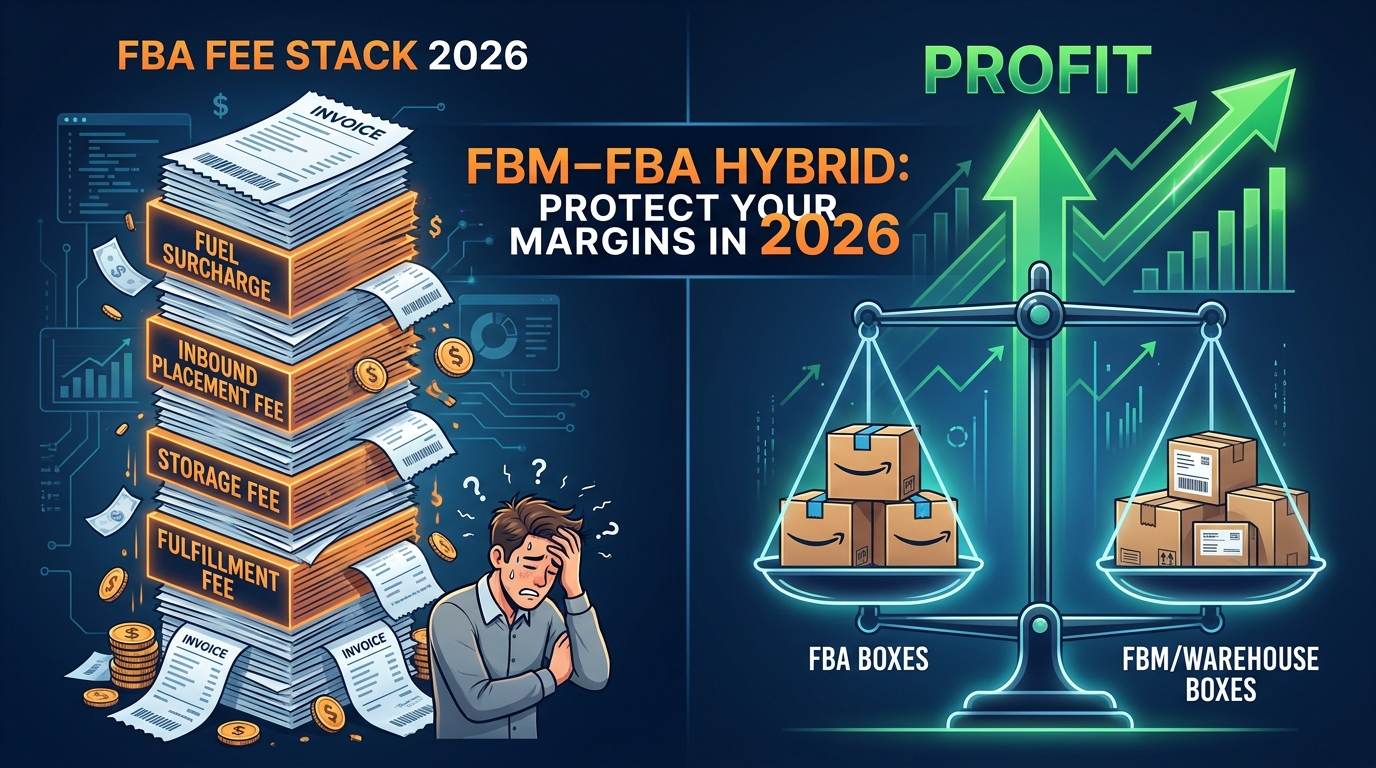
There is a version of this story that Amazon would prefer you tell yourself: that the January 2026 FBA fee increase of roughly $0.08 per unit is barely noticeable — less than half a percent of the average item’s selling price, as Amazon’s own Seller Central framing suggests. If you sell one item at $25, you might not even notice. But that framing obscures what is actually happening across an entire catalog, across an entire year, with compounding effects from multiple fee vectors hitting simultaneously.
In practice, the 2026 fee environment is not defined by a single $0.08 line item. It is defined by a stack: a fulfillment fee increase on top of inbound placement fees that can reach $0.68 per standard unit for single-location shipments, on top of a new 3.5% fuel and logistics surcharge that took effect April 17, 2026, on top of aged inventory surcharges that accelerate sharply after 180 days, on top of Q4 storage rates that are more than three times the off-peak rate. Each layer individually looks defensible. Combined, they are quietly restructuring the margin math for every seller who has not audited their fulfillment model recently.
This post is not about whether FBA is good or bad — it clearly remains indispensable for the right SKUs. It is about the structural decision most sellers are not making carefully enough: which SKUs belong in FBA, which belong in FBM, which belong in a 3PL-backed Seller Fulfilled Prime setup, and how to rotate that assignment across seasons. That decision, made at the SKU level with real numbers rather than defaults, is where 2026 margin protection actually lives.
We will cover the complete fee picture, three concrete hybrid fulfillment models, the Buy Box mechanics FBM sellers need to understand, the 3PL infrastructure required to make it work, and the quarterly audit process that keeps the whole system calibrated.
The Complete 2026 Amazon Fee Stack: What You Are Actually Paying
Before you can build an intelligent hybrid model, you need a precise accounting of every fee layer. Most sellers are familiar with two or three of these. Fewer have modeled all of them simultaneously against the same SKU.
FBA Fulfillment Fees: The Base Layer
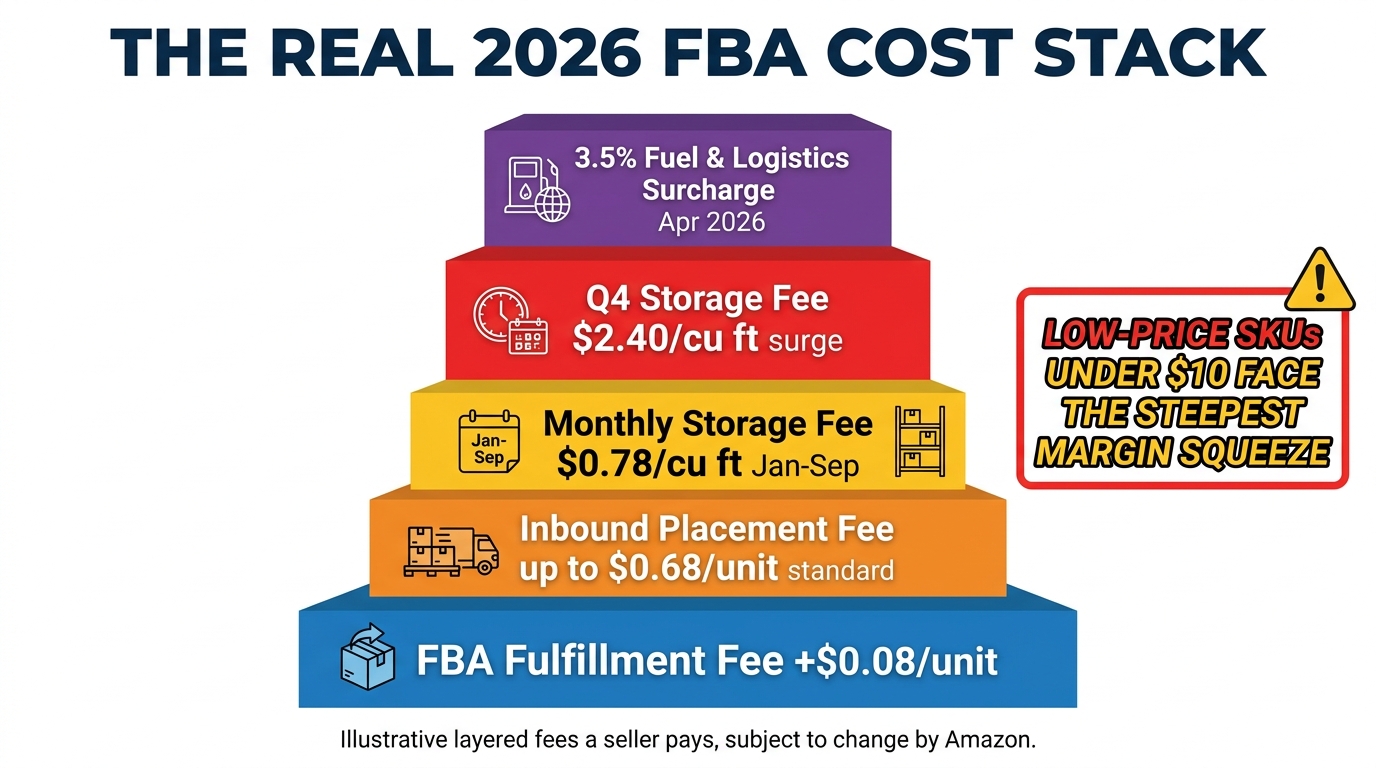
Effective January 15, 2026, US FBA fulfillment fees increased by an average of $0.08 per unit. That average masks significant variation by price tier and size. For items priced below $10, the per-unit increase skews higher — approximately $0.12 on average — because Amazon introduced price-tiered rate structures that create proportionally larger impacts on low-cost goods. An item at $8.99 absorbing a $0.12 fee increase is seeing its contribution to gross margin fall by a meaningfully different percentage than a $40 item absorbing the same charge.
For oversized items, the picture is worse. Bulky and large bulky tiers were already expensive to fulfill through FBA; the 2026 adjustments add to an already-steep per-unit cost, often pushing these items past the threshold where FBA is defensible.
Inbound Placement Fees: The Hidden Killer
If one fee category has the most unrealized impact on FBA profitability, it is the inbound placement fee structure. Single-location (minimal splits) shipments now carry fees of approximately $0.21 to $0.68 per standard-size unit. For large and bulky items, that range stretches to $2.16 to over $6 per unit on single-location shipments.
The alternative — Amazon-optimized splits, where you ship to all Amazon-specified fulfillment centers — brings the placement fee to $0.00 across all size tiers. That is not a typo. The difference between sending inventory to one location versus distributing it across Amazon’s preferred network can be worth $0.40 to $0.68 per standard unit, or $2 to $6 per bulky unit, every single time you replenish. For a seller shipping 5,000 standard units per month at a $0.40 spread, that is $2,000 per month — $24,000 per year — that is either in your pocket or Amazon’s depending on how you route your inbound shipments.
This fee alone is enough justification for many sellers to build an AWD relationship, which can serve as the upstream node that positions inventory for Amazon-optimized distribution automatically.
Storage Fees: The Seasonal Trap
Monthly FBA storage fees run at approximately $0.78 per cubic foot from January through September for standard-size inventory, and $0.56 per cubic foot for oversized. That sounds manageable — until Q4 arrives. October through December, standard-size rates jump to approximately $2.40 per cubic foot, a factor of more than three times the off-peak rate. Oversized goes to $1.40 per cubic foot. Sellers who built their unit economics on the off-peak rate and then allowed excess inventory to sit through the holiday quarter are quietly absorbing costs that were never in their original margin model.
Layered on top of that is the aged inventory surcharge, which activates for inventory that has sat in FBA for 181 to 365 days and escalates sharply at the 366-day mark. The January 16, 2026 update sharpened these penalties for the 366-plus-day tier, meaning the cost of slow-moving FBA inventory is not just high — it compounds. A SKU that sits for 14 months faces per-unit storage costs that can exceed its original purchase price on low-cost goods.
The Fuel and Logistics Surcharge: The April Addition
As if the January fee changes were not enough, a 3.5% fuel and logistics surcharge was added to FBA fulfillment fees effective April 17, 2026. This is not an add-on line item you can directly see on every transaction — it is embedded into the FBA fulfillment fee rate, which means it compounds with the January increase. It also signals something more structural: Amazon is building variable cost recovery mechanisms into the FBA fee framework, which means future surcharge adjustments could arrive with relatively short notice.
The cumulative picture: a seller with a catalog that was marginally profitable under 2024’s FBA fee structure is now operating in an environment where four distinct fee vectors have moved against them within 12 months. That is not incremental. That is structural.
Why the “Just Use FBA” Default Is Quietly Eroding Margins
The default position for most Amazon sellers who achieve any scale is to funnel everything into FBA. It is the path of least resistance. The Prime badge, the Buy Box edge, the customer trust signal, the Amazon-managed logistics — all of it creates a gravitational pull toward a single-model approach. And for the right SKUs, that logic holds. But applying it uniformly across a catalog is no longer a neutral choice. It is an active decision to absorb costs on SKUs where FBA’s benefits do not justify its fees.
The Real Margin Math on Low-Price SKUs
Consider a product selling at $9.99 with a product cost of $2.50. The seller’s gross margin before fees is $7.49 — a 75% gross margin that looks healthy on paper. But apply the full 2026 fee stack: a 15% referral fee ($1.50), an FBA fulfillment fee for a small standard-size item (approximately $3.22 at current 2026 rates, inclusive of the fuel surcharge), plus a proportional share of the inbound placement fee (even at $0.20 for an Amazon-optimized shipment), plus a storage cost allocation. The seller nets somewhere between $2.00 and $2.50 per unit — a real-world margin of 20 to 25%, before advertising, returns, or any operational overhead.
Now move that same SKU to FBM with a competent 3PL partner. The referral fee is identical. But the fulfillment cost through a 3PL for a small package might be $2.50 to $3.00 — comparable to FBA’s rate — while eliminating the inbound placement fee, the aged inventory surcharge risk, and the Q4 storage exposure. The absolute numbers may be similar, but the risk-adjusted economics of FBM are better for this SKU because the downside tail (storage penalties, aged inventory, stranded inventory) simply does not exist.
Heavy and Bulky SKUs: FBA Is Often Net-Negative
For products above a certain weight and dimensional threshold — the bulky and large bulky tiers — FBA economics frequently do not work at all. A 25-pound product with a large dimensional footprint faces FBA fulfillment fees that may exceed $10 to $15 per unit, before storage or placement fees. At typical e-commerce margins, there is no scenario where that product is profitable through FBA unless it is priced above $60 to $80. Most heavy products are not priced that high. The sellers who move heavy SKUs to FBM or direct-3PL fulfillment frequently report margin improvements of 15 to 25 percentage points on those specific items.
The Slow-Mover Penalty Is Cumulative
Perhaps the most underappreciated feature of the current FBA fee structure is how aggressively it penalizes slow inventory turns. A SKU with a 120-day turn cycle does not look alarming until you model the aged inventory surcharge that kicks in at 181 days, the storage costs that accumulate across that period, and the practical difficulty of removing inventory mid-cycle without additional fees. FBA was designed for fast-moving consumer goods. Treating it as general-purpose warehousing for a mixed catalog — including seasonal items, slow-turn accessories, and product line extensions that only sell occasionally — is a choice that has a precise dollar cost. In 2026, that cost has increased.
The SKU Segmentation Engine: How to Decide What Goes Where
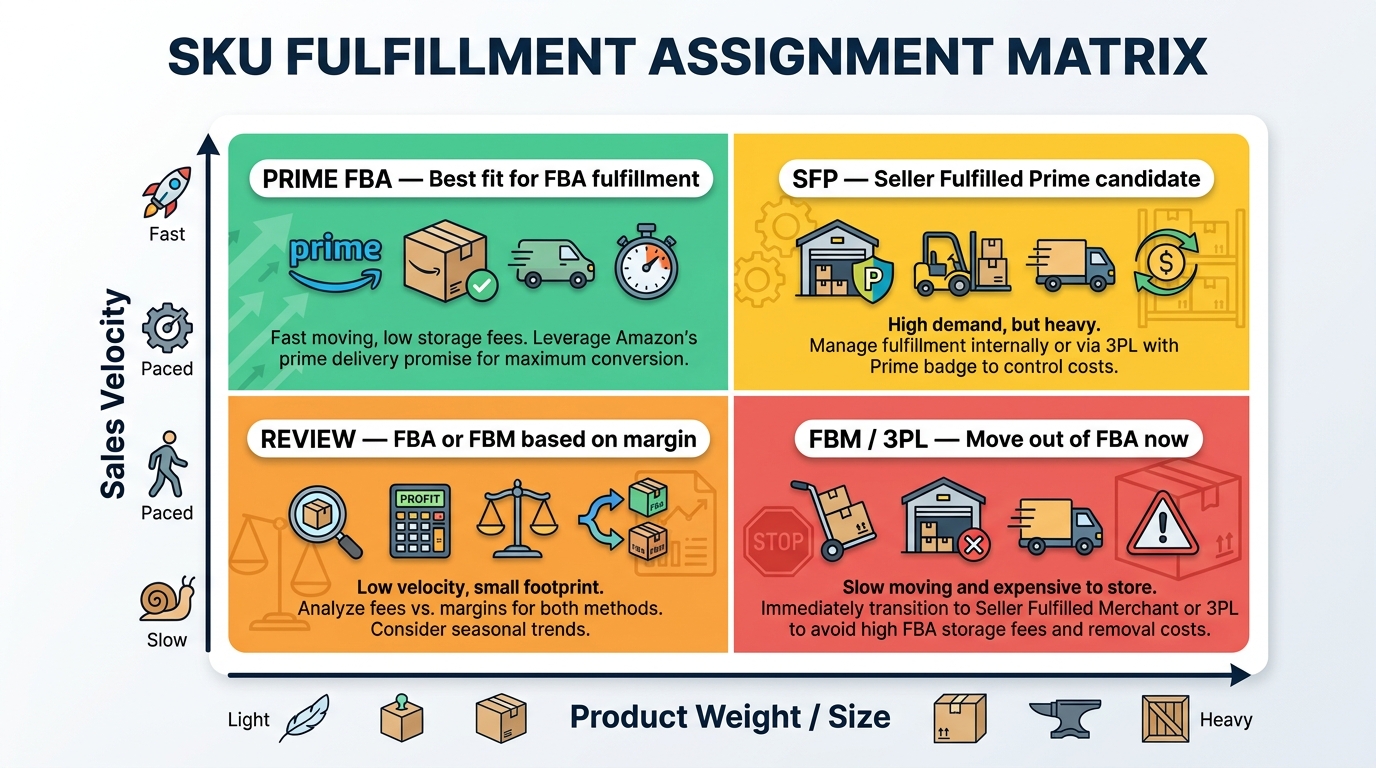
The transition from a uniform FBA model to a true hybrid requires a systematic segmentation process. The goal is not to move everything to FBM — it is to ensure that every SKU’s fulfillment assignment is an active, margin-based decision rather than a default. Research across advanced seller operations suggests that 20 to 30% of a typical catalog may be more profitable under FBM, but that percentage varies widely by category, price point, and product characteristics.
The Four Segmentation Variables
Sales Velocity: How many units does this SKU move per month? High-velocity SKUs (50+ units per month) benefit most from FBA because the Prime badge drives conversion and the fulfillment infrastructure scales without additional operational overhead. Low-velocity SKUs (fewer than 10 units per month) accrue storage costs faster than they turn inventory, creating the aged inventory trap.
Size and Weight Tier: Small standard-size items that weigh under one pound are FBA’s sweet spot. The economics break down incrementally as size and weight increase. Large standard, small oversize, medium oversize, and large bulky categories each have their own fee structures that may or may not pencil out depending on the selling price.
Price Point and Category Margin: Higher-priced items can absorb more FBA fee per unit as a percentage of revenue. A $75 skincare item paying $4.50 in FBA fees (6% of revenue) has very different economics than a $12 kitchen accessory paying $3.80 in FBA fees (31.7% of revenue). The referral fee rate by category adds another dimension — categories with 15% referral fees leave less room for FBA fulfillment costs than those at 8%.
Prime Conversion Sensitivity: Not all categories or customer segments are equally sensitive to the Prime badge. Some categories — high-consideration purchases, items where customers price-compare extensively, or products that sell primarily to Prime members who filter by Prime eligibility — have meaningful conversion lifts from the Prime badge. Others, particularly niche, specialty, or B2B items, convert nearly as well without it.
The Net Profit Per Unit Model
The decision framework must be built on net profit per unit, not on gross margin or revenue. For each SKU under evaluation, calculate:
- FBA Net Profit Per Unit: Selling price minus referral fee, minus FBA fulfillment fee (inclusive of fuel surcharge), minus proportional inbound placement fee (based on your actual shipment routing), minus proportional monthly storage cost allocation, minus a risk reserve for aged inventory exposure
- FBM Net Profit Per Unit: Selling price minus referral fee, minus 3PL pick/pack/ship cost, minus outbound shipping cost to customer, minus 3PL storage fee per unit per month allocation
For SKUs where FBM net profit per unit exceeds FBA net profit per unit by more than $0.50, the case for migrating to FBM is generally strong. For SKUs where FBA leads, the margin of FBA’s advantage relative to its inventory risk should guide how much stock you keep in FBA at any given time. Current expert guidance suggests auditing this comparison on at least a quarterly basis, because the fee environment can shift between cycles.
Segmentation Tiers in Practice
Most sellers operating a mature hybrid model end up with three to four natural tiers. Tier 1 is core FBA: fast-moving, lightweight, Prime-sensitive items that represent the spine of the catalog. These stay in FBA and are always prioritized for Amazon-optimized inbound routing to eliminate placement fees. Tier 2 is hybrid-flex: items that are seasonal, mid-velocity, or approaching the margin threshold where FBA may not justify the cost. These move fluidly between FBA and FBM depending on season and stock position. Tier 3 is permanent FBM: heavy, bulky, slow, or low-margin SKUs that are simply not economic in FBA at 2026 rates and are better served through a 3PL with competitive fulfillment pricing. Tier 4 is under review: items where the math is genuinely unclear and requires additional data or a trial period to resolve.
Model 1 — The Speed Spine: FBA Core Plus FBM Backstop
The most common hybrid structure is what practitioners sometimes call the speed-spine model: a concentrated FBA catalog of your fastest-moving, Prime-converting SKUs, with a parallel FBM listing active on every ASIN as a backstop against stockouts, inventory limits, and fee spikes.
Why the FBM Backstop Matters More in 2026
Amazon’s inventory performance index (IPI) scoring system places limits on how much FBA inventory sellers can hold, creating situations where fast-moving SKUs can sell out of FBA before a restock arrives. Without an active FBM listing on the same ASIN, a stockout is total — you lose the Buy Box, lose conversion, and likely lose rank. With an active FBM listing, the ASIN stays live, orders continue (potentially at a slightly lower conversion rate without Prime), and you protect your rank and review velocity through the gap.
This backstop function has a non-obvious benefit during fee transitions. When Amazon announces a fee change mid-year — as the April 17 fuel surcharge demonstrated — having an active FBM channel means you can temporarily route volume away from FBA while you re-model your profitability. You do not have to make a permanent decision immediately. You have a lever to pull.
Execution Requirements for This Model
To make the speed-spine model work, you need an FBM fulfillment partner that can handle surge volume. When FBA inventory runs thin, FBM order volume can spike without warning. A 3PL that cannot scale to absorb that surge will create service failures that damage your metrics. Look for 3PL partners with same-day pick/pack cutoffs that allow you to offer two-day or faster delivery to most of the US population, which is the threshold that makes FBM offers genuinely competitive for the Buy Box.
You also need to keep your FBM pricing aligned with your FBA pricing at all times. A common mistake is setting FBM prices slightly higher to account for the higher per-unit fulfillment cost, which is economically rational but algorithmically costly — Amazon’s featured offer selection heavily weights landed price, and an FBM offer that is even a few percentage points above a competitor’s FBA offer will rarely win the Buy Box regardless of your performance metrics.
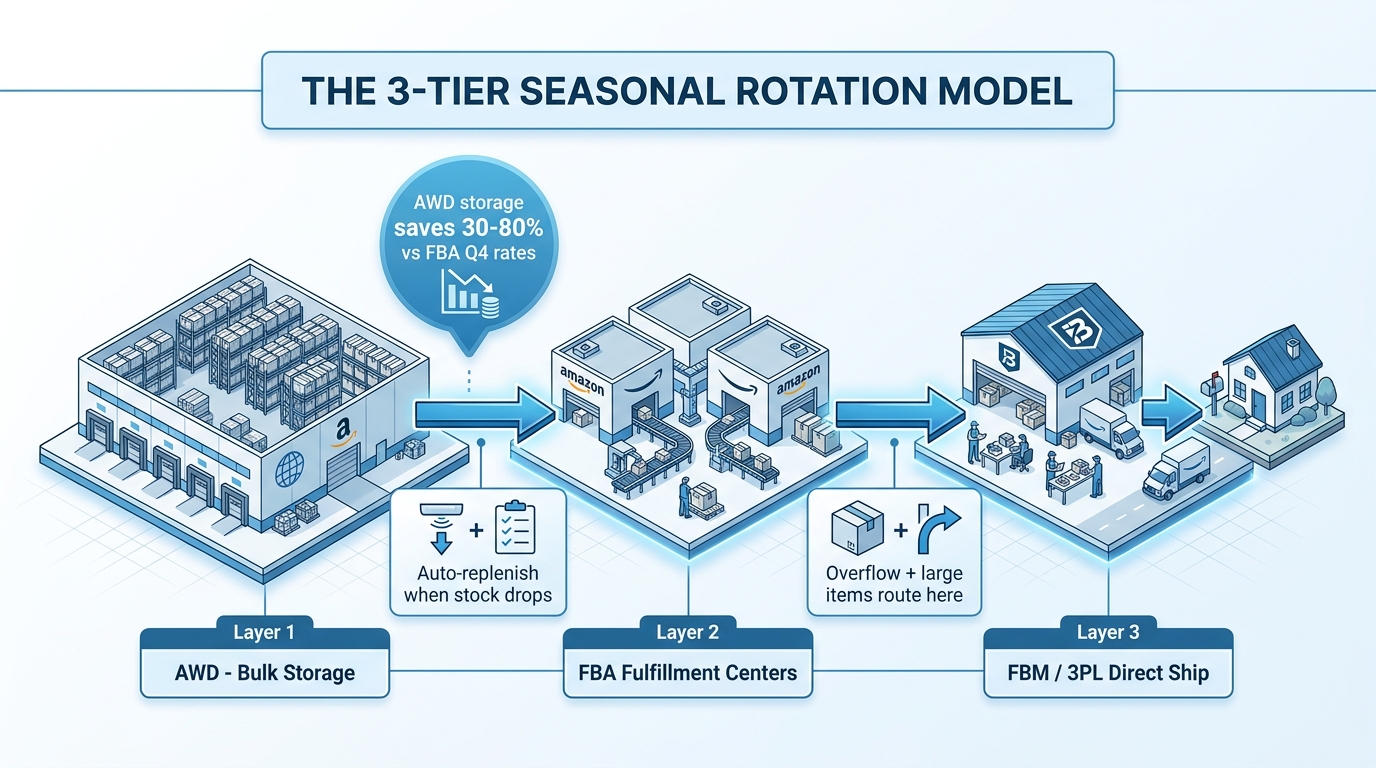
Model 2 — The Seasonal Rotation: AWD Plus FBA Plus FBM in a Three-Tier Stack
For sellers with seasonal demand patterns, high-volume catalogs, or significant import volume, a three-tier stack combining Amazon Warehousing and Distribution (AWD), FBA, and FBM offers the most complete cost and risk management architecture available in 2026.
AWD as the Upstream Cost Lever
Amazon Warehousing and Distribution is Amazon’s bulk storage and upstream replenishment program, positioned between your supplier/import freight and your FBA inventory. AWD storage rates are substantially below FBA rates — approximately $0.48 per cubic foot per month for East/Southeast/South Central locations, compared to FBA’s $0.78 off-peak rate and $2.40 Q4 rate. For West Coast storage, AWD rates run about $0.57 per cubic foot, with Smart Storage discounts bringing that to $0.51 and Managed Storage to $0.46.
The cost delta becomes most dramatic in Q4. When FBA storage rates triple to $2.40 per cubic foot for standard-size items, sellers who have positioned bulk inventory in AWD (at roughly $0.48 per cubic foot, unaffected by the Q4 surge) are paying approximately one-fifth the storage cost for the same inventory. Over a full Q4 quarter with meaningful inventory volume, the savings can run to thousands or tens of thousands of dollars depending on catalog size.
Industry data suggests AWD can deliver total storage cost savings in the 30 to 80% range compared to either FBA storage or a traditional third-party 3PL, depending on season, inventory profile, and region. That is a wide range, and real-world seller feedback suggests reliability issues (replenishment delays, lead time inconsistency) have historically offset some of those savings for certain operators. AWD works best when you build lead-time buffers into your replenishment model rather than relying on just-in-time flows.
How the Three Tiers Interact
In the three-tier model, AWD holds bulk stock and auto-replenishes FBA when inventory levels at fulfillment centers fall below a defined threshold. FBA handles all Prime-eligible, fast-moving fulfillment during normal operations. FBM (via 3PL or self-fulfillment) serves as both an overflow channel for large/heavy SKUs that are permanently excluded from FBA and a safety net for stockout scenarios.
The inbound placement fee benefit is worth calling out explicitly here: when you send inventory into AWD and AWD distributes it to FBA, Amazon typically routes that inventory across its fulfillment center network in an optimized pattern, which can qualify you for the zero-placement-fee Amazon-optimized split. You capture the distribution benefit without managing five-destination inbound shipments yourself. For sellers importing container-scale inventory, this alone can justify the AWD relationship.
Seasonal Rotation Logic
The seasonal rotation strategy means actively managing how much inventory sits in each tier throughout the year. The general cadence looks like this: from January through August, keep lean FBA positions (enough inventory for 30 to 45 days of velocity), maintain bulk stock in AWD, and route low-turn SKUs to FBM. As Q4 approaches, begin pulling higher volumes from AWD to FBA for your confirmed fast movers — but with careful attention to how much lands in FBA before October 1, when storage rates triple. Items that may not fully turn by December 31 should be kept in AWD or 3PL storage rather than FBA, since a December 31 inventory snapshot at $2.40 per cubic foot for items you had hoped to sell but did not is a very expensive miscalculation.
Model 3 — SFP as the Prime Badge Without the FBA Tax
Seller Fulfilled Prime (SFP) occupies a unique position in the hybrid architecture. It allows sellers to display the Prime badge and qualify for Prime delivery commitments while fulfilling from their own warehouse or a 3PL — without paying FBA fulfillment fees, FBA storage fees, or inbound placement fees. For the right SKUs, this is effectively the best of both worlds: Prime conversion without the FBA cost structure.
The 2026 SFP Requirements and the July 6 Update
SFP is not free in operational terms. To maintain the program in 2026, sellers must meet strict delivery speed standards, a validating 30-day trial, and ongoing performance thresholds. Amazon raised the bar further effective July 6, 2026 with tightened delivery-speed requirements by product size — larger items now face stricter speed expectations than before, which narrows the field of 3PL partners that can credibly support SFP fulfillment for bulky goods.
The baseline requirements include maintaining an order defect rate (ODR) below 1%, a late shipment rate (LSR) below 4%, a cancellation rate below 2.5%, and a valid tracking rate (VTR) at or above 95%. These are not dramatically different from standard FBM account health requirements, but they are enforced more stringently under SFP — a sustained period of underperformance will result in the Prime badge being removed, which has an immediate negative impact on conversion.
Which SKUs Belong in SFP
SFP earns its place in the hybrid model for SKUs that have two characteristics simultaneously: they are Prime-conversion-sensitive (meaning the badge materially moves the needle on sales velocity), and they are expensive enough in FBA fees that the fulfillment cost savings from SFP are meaningful. Heavy-but-fast items are the canonical SFP candidates — a 15-pound fitness product that sells 200 units per month may have a Prime conversion sensitivity that makes FBA worth something, but FBA fulfillment costs for a 15-pound item can be $8 to $12 per unit. An SFP setup where you ship via a discounted carrier account at $5 to $7 per unit captures both the conversion benefit and a significant cost reduction.
The tradeoff is operational complexity. SFP requires a fulfillment infrastructure that can reliably commit to and deliver on next-day or two-day delivery promises across a broad geography, seven days a week. Not every 3PL partner can do this. Those that can — particularly regional 3PLs with multi-node footprints or national partners with weekend processing capability — become meaningful strategic assets for SFP-enabled brands.
SFP vs. Standard FBM: The Decision Point
If your 3PL can meet the SFP performance bar, SFP is generally worth the operational complexity for any SKU where you believe the Prime badge drives a conversion lift of 10% or more over standard FBM. If your operation or 3PL cannot reliably meet the speed and performance standards, standard FBM with competitive pricing is the safer choice — a failed SFP program that loses the badge mid-peak season is more damaging than never having started one.
The Buy Box Math: Can FBM Actually Win in 2026?
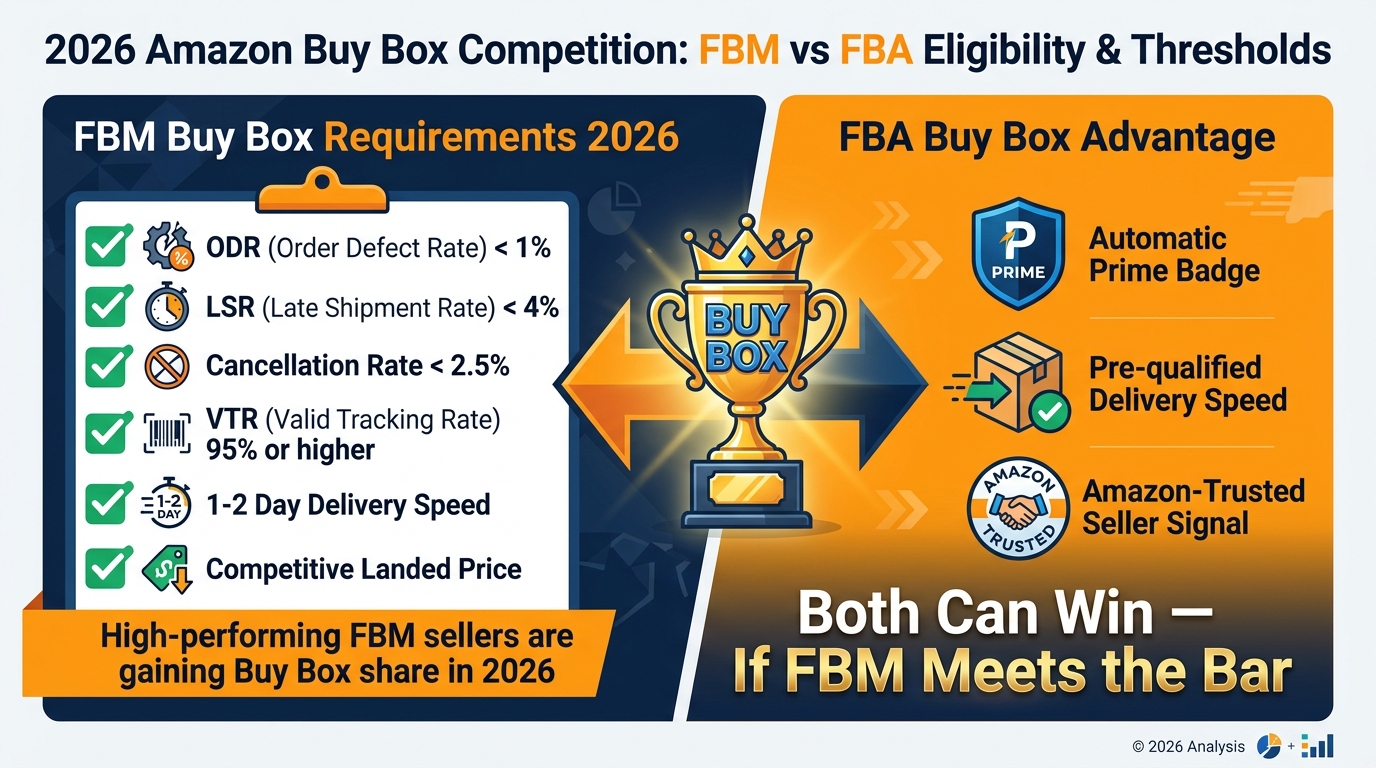
One of the most persistent misconceptions about FBM is that it simply cannot win the Buy Box (now called the Featured Offer) against FBA. That is not accurate in 2026. High-performing FBM sellers are gaining Featured Offer share, and Amazon’s algorithm has evolved to reward delivery performance more heavily than it did two to three years ago. But winning the Buy Box as an FBM seller requires meeting a precise set of conditions.
The Account Health Thresholds That Gate Eligibility
To be Buy Box–eligible as an FBM seller, you must maintain a Professional selling account and hit all of the following thresholds consistently:
- Order Defect Rate (ODR): Below 1%. This composite metric includes A-to-Z claim rate, chargeback rate, and negative feedback rate. A single rough month can disqualify an otherwise strong seller.
- Late Shipment Rate (LSR): Below 4%. Orders shipped past the promised date — even by a few hours — count against this metric. Your 3PL’s cutoff times and carrier pickup reliability directly drive this number.
- Pre-Fulfillment Cancellation Rate: Below 2.5%. Cancellations due to stock unavailability are particularly damaging. If your FBM inventory position is not reliably monitored, this metric will drift.
- Valid Tracking Rate (VTR): At or above 95%. Every FBM shipment that leaves your or your 3PL’s facility must have a valid tracking number uploaded to Amazon within a defined window. This is an operational execution requirement, not a strategic one.
Delivery Speed: The Weight Has Shifted
Account health is the threshold requirement; delivery speed is the competitive differentiator. Amazon’s 2026 algorithm places significantly higher weight on delivery speed estimates than earlier versions of the Featured Offer selection logic. An FBM offer that promises two-day delivery and consistently delivers on that promise is treated more favorably than it was under older algorithm versions — and in some cases can compete directly with FBA offers when pricing is equivalent.
This means that FBM’s Buy Box eligibility is not primarily a pricing question anymore. Matching FBA on delivery speed (which requires a 3PL with genuine two-day ground coverage to the bulk of the US population, or premium shipping contracts) is the prerequisite. Price competitiveness is layered on top of that, not the other way around.
The Pricing Window and Buy Box Rotation
Amazon’s Featured Offer algorithm does not require FBM sellers to exactly match FBA prices to win Buy Box share. It evaluates landed price (item price plus shipping cost to the customer) against the full competitive set and rotates the Featured Offer based on value delivered. An FBM offer priced at $24.95 with free two-day shipping competing against an FBA offer at $24.75 is not automatically excluded. The algorithm’s weighting factors — price, delivery speed, seller metrics, historical performance — interact to produce a probability-weighted Buy Box rotation rather than a winner-take-all assignment for most competitive ASINs.
In practical terms, experienced FBM operators aim to keep their FBM landed price within 1 to 3% of the best FBA offer on the same ASIN, and maintain their delivery metrics in the top tier. Under those conditions, real-world Buy Box share for well-run FBM operations can reach 30 to 50% of the rotation on competitive listings — meaningful volume, even if FBA takes the majority.
Building the 3PL Layer That Makes FBM Viable at Scale
Running FBM as anything more than a backstop requires a 3PL infrastructure that can match, or nearly match, the reliability and speed that FBA provides. This is not a given. The quality and capability of third-party logistics providers varies enormously, and choosing the wrong 3PL for your FBM channel will produce account health deterioration faster than almost any other operational decision.
What to Look For in an FBM-Capable 3PL
Two-day ground coverage: The single most important capability for competitive FBM fulfillment is the ability to reach the majority of the US population within two business days via ground shipping. Not all 3PLs can offer this. Regional 3PLs with a single warehouse may cover the coasts or the Midwest but leave the opposite region on three-day or four-day ground times. National 3PLs with two to four distributed nodes can typically achieve 90% or more of the US population in two days via standard ground carriers, which is the threshold that makes Prime-competitive delivery promises achievable.
Same-day processing with late cutoffs: For two-day delivery promises to be reliable, the 3PL must process and ship orders with same-day handling up to a late afternoon cutoff — ideally 4 to 5 PM local time. Earlier cutoffs compress your effective two-day reach because orders received in the afternoon miss the day’s outbound freight.
Amazon-native API integration: Your 3PL should pull orders from Amazon automatically, upload tracking numbers back to Seller Central in real time, and flag exceptions without manual intervention. Any 3PL that relies on manual order export and tracking upload introduces human error into the metrics that determine your Buy Box eligibility. This is non-negotiable at meaningful volume.
Returns processing capability: FBM returns come back to your 3PL, not to Amazon. The 3PL must be able to receive, inspect, grade, and restock (or dispose of) returned inventory within a defined SLA. Poor returns processing leads to inventory discrepancies, delayed refund issuance, and A-to-Z claims — all of which hit your ODR.
The Multi-Node Strategy for SFP Candidates
If you are pursuing Seller Fulfilled Prime for any part of your catalog, the 3PL requirement becomes more demanding. Post-July 6, 2026, Amazon’s tightened delivery-speed thresholds by product size mean that a single-node 3PL is rarely sufficient for SFP qualification on anything other than the smallest SKUs. To reliably offer next-day or two-day delivery to all contiguous US customers, you need fulfillment from at least two geographically distributed nodes — typically one in the East (Pennsylvania, New Jersey, Ohio) and one in the West (California, Nevada, Arizona) — with a third central node (Texas, Illinois, Tennessee) significantly expanding your same-day and next-day coverage zone.
Several national 3PLs have built SFP-specific fulfillment programs that meet these requirements as a package service, including the carrier rate negotiation, the Amazon API integration, and the performance monitoring. If you are evaluating 3PL partners for SFP fulfillment, ask specifically about their existing SFP client roster, their per-location two-day ground coverage statistics, and their historical VTR and LSR performance across SFP accounts. A 3PL that cannot provide these metrics clearly is not yet operationally mature enough for SFP.
Cost Benchmarking: What FBM Fulfillment Should Actually Cost
For the hybrid model to close its math, FBM fulfillment through a 3PL must come in at a competitive rate relative to FBA. Typical 3PL pick, pack, and ship costs for a standard-size unit (under 1 pound, in a standard mailer) run approximately $2.25 to $3.50 per unit depending on provider, volume tier, and service level. Adding outbound shipping (USPS Ground Advantage, UPS SurePost, or FedEx SmartPost for economy; USPS Priority or UPS/FedEx Ground for speed) brings the all-in cost to $4.50 to $7.00 for most sub-one-pound items shipping to the continental US. Compare that to FBA’s 2026 rates for a small standard item in the $4.50 to $5.50 range inclusive of the fuel surcharge, and the cost parity is closer than most sellers expect — and the 3PL route eliminates all the additional fee risks (storage surcharges, placement fees, aged inventory penalties) that the FBA model carries.
The Quarterly Audit Cadence: Keeping Your Hybrid Model Calibrated
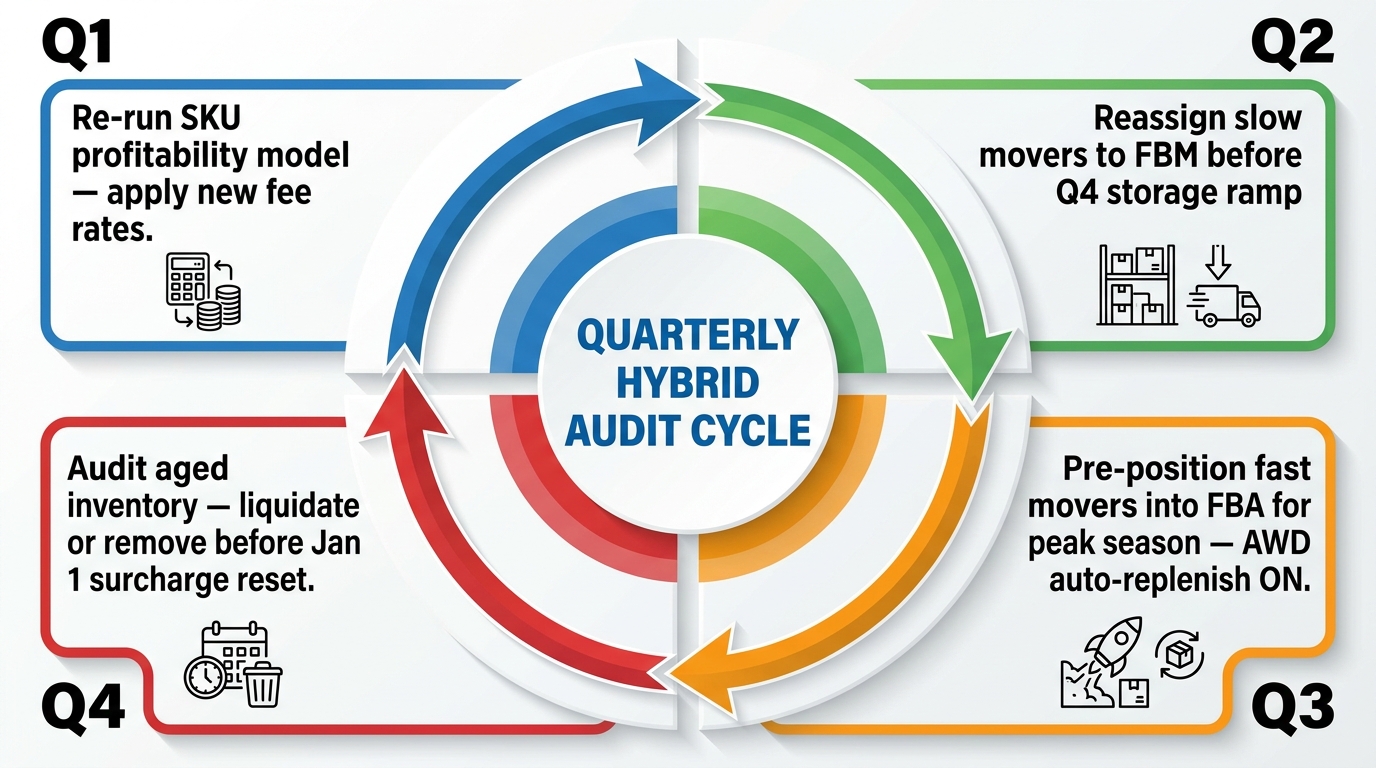
A hybrid fulfillment model is not a one-time setup. The fee environment changes. Your catalog changes. Velocity patterns shift. Competitors enter and exit. The model that was correctly calibrated in January may be meaningfully miscalibrated by July if you have not run the numbers again. Building a formal quarterly audit process is what separates sellers who capture the full benefit of a hybrid model from those who set it up once and let it drift.
Q1 Audit: Re-Run the Profitability Model
The Q1 audit, ideally run in January after any new-year fee changes have taken effect, is the foundational profitability refresh. Every SKU in your catalog should be re-run through the net profit per unit model with current fee inputs. Amazon’s January 15, 2026 fee changes make this especially time-sensitive this year — any SKU that was marginally profitable under 2025 fee rates may have crossed into negative contribution territory under the new stack.
The output of the Q1 audit should be a revised tier assignment for every SKU: confirmed FBA, candidate for migration to FBM, immediate migration required, or under observation. SKUs that show negative net contribution under FBA at 2026 rates should be migrated within 60 days or evaluated for removal from the catalog entirely if FBM economics are not better.
Q2 Audit: Pre-Position for the Slow-Mover Trap
The Q2 audit, run in April or May, focuses specifically on inventory age and velocity. Any SKU sitting in FBA with a current stock position that suggests it will still have units remaining at the 181-day aged inventory threshold — which triggers the first surcharge tier — should be evaluated for removal, liquidation, or at minimum a velocity-boosting pricing action (a promotional price reduction, a coupon, or an advertising push) before the surcharge clock catches up to it.
This is also the audit cycle where you reassign SKUs that are heading into their slow season to FBM. If you sell a product that is primarily purchased in autumn, keeping it in FBA through May, June, July, and August means paying $0.78 per cubic foot per month for inventory that is not turning — and then watching it slide toward the 180-day surcharge threshold right around the time it starts to move again in September. Moving it to 3PL storage during the slow window and replenishing FBA in August is almost always cheaper.
Q3 Audit: Peak Season Preparation
The Q3 audit, conducted in July or August, is primarily a forward-looking exercise focused on Q4 preparation. Three questions drive this audit: Which SKUs are confirmed fast movers for Q4 and need FBA positions built up before October? How much of that inventory can you position through AWD to take advantage of auto-replenishment and lower storage rates? And which SKUs should stay entirely outside FBA during Q4 because the risk of unsold inventory at $2.40 per cubic foot storage rates outweighs the conversion benefit of the Prime badge?
Sellers who systematically answer these three questions by August 15 are better positioned to optimize their Q4 fee exposure than those who make reactive decisions in October or November when the storage clock is already ticking.
Q4 Audit: The Post-Peak Clearance
The Q4 audit — run in December, ideally before December 15 — focuses on preventing the most expensive mistake in FBA management: carrying excess inventory through the December 31 snapshot and into January, where the combination of the reset annual aged inventory surcharge cycle and the Q4 storage rates can create a compound penalty. Inventory that did not sell through Q4 should be evaluated for removal, liquidation pricing, or FBM routing. Paying to ship inventory out of FBA before December 31 is almost always cheaper than the combination of the Q1 storage fees and the aged inventory risk that accumulates if it stays.
The post-Q4 audit also serves as the baseline for the next Q1 audit — the data you generate about which SKUs outperformed FBA projections and which underperformed feeds directly into the tier assignment decisions for the coming year.
Practical Tools and Metrics for Managing a Hybrid Model
Managing fulfillment assignment across two or three channels, multiple fee structures, and a seasonal rotation requires more structured tooling than most sellers start with. A spreadsheet model that was sufficient for a pure-FBA catalog becomes inadequate when you are tracking FBM metrics, 3PL costs, AWD positions, and Buy Box share simultaneously.
The Core Metrics Dashboard
A hybrid model should be monitored against a core set of metrics that cut across both fulfillment channels. On the FBA side: IPI score, aged inventory percentage (units older than 90 days as a share of total FBA units), storage utilization versus limits, and inbound placement fee cost per unit (to track whether you are successfully routing into Amazon-optimized splits). On the FBM side: VTR, LSR, ODR, Buy Box win rate on your FBM-active ASINs, and 3PL cost per unit (broken down by pick/pack versus outbound shipping).
Looking at these metrics in isolation by channel misses the purpose of a hybrid model. The right dashboard integrates both, allowing you to see blended cost per unit across your full catalog and identify which fulfillment channel is performing better on a per-SKU basis in any given month.
Software Tools That Support Hybrid Management
Several third-party tools have built meaningful features for hybrid fulfillment management. Profit-modeling tools — including Sellerboard, InventoryLab, and Helium 10’s Profits module — allow you to input 3PL costs alongside FBA fees to generate side-by-side net profit comparisons by SKU. Inventory management platforms like Skubana (now Extensiv), Linnworks, and Veeqo support multi-channel inventory synchronization across FBA and FBM, which is essential for keeping your 3PL stock levels aligned with FBM availability settings on Amazon. Missing that sync is how you end up with a surge in FBM orders after FBA stockout and a 3PL that runs dry within 48 hours.
For sellers operating at scale with an AWD + FBA + FBM three-tier stack, the replenishment automation tools built into AWD’s managed replenishment program can eliminate much of the manual calculation involved in deciding when to pull inventory from AWD into FBA. The tradeoff is that AWD’s auto-replenishment algorithms are not always optimally calibrated for unusual velocity patterns — seasonal sellers and those with promotional spikes should still apply manual overrides during predictable demand events.
What the Numbers Say: Hybrid Models in Practice
The evidence from sellers who have implemented systematic hybrid models is consistent enough to be directional, even if individual results vary. Research across advanced seller operations and 3PL partner data suggests that a thoughtfully implemented hybrid model — with FBA reserved for the 60 to 80% of catalog units that genuinely benefit from it, and FBM or 3PL handling the rest — produces net profit improvements in the 10 to 20% range relative to a uniform FBA approach across the same catalog.
That range is broad because results depend heavily on how much of a given catalog is currently in FBA unnecessarily. Sellers with catalogs skewed toward heavy items, slow movers, or low-price goods in high-referral-fee categories tend to see larger improvements. Sellers whose catalogs are already naturally suited to FBA — small, light, fast-moving consumer goods in the $15 to $40 price range — may see more modest gains from hybridization, though the backstop value of a parallel FBM channel still adds insurance value that does not show up in normal-state profitability comparisons.
The 22 to 35% of Amazon sellers who currently use some form of hybrid model represents a minority, but it skews heavily toward higher-volume, more sophisticated operations. As the 2026 fee environment compounds on the 2025 changes, and as the April fuel surcharge embeds as a permanent feature rather than a temporary addition, that percentage is expected to grow. The sellers who build the operational infrastructure now — the 3PL relationships, the SKU segmentation models, the quarterly audit processes — will be better positioned than those who react to each fee announcement in isolation.
Conclusion: Building a Fulfillment Model That Holds Up
The argument for a hybrid FBM–FBA model in 2026 is not that FBA is failing. FBA remains a genuinely powerful fulfillment infrastructure that drives real conversion and velocity for the SKUs where it pencils out. The argument is more precise than that: the 2026 fee stack has raised the threshold at which FBA’s benefits justify its costs, and every seller with a catalog of more than 20 or 30 SKUs has items below that threshold — items that would be more profitable through FBM, SFP, or a 3PL-backed hybrid arrangement.
Finding those items, building the infrastructure to serve them through an alternative channel, and maintaining the discipline of quarterly SKU-level audits is the operational work that separates sellers who absorb the fee stack from sellers who architect around it.
Actionable Takeaways
- Run a full fee audit on every SKU this week. Use current 2026 FBA fees — inclusive of the January increase and the April fuel surcharge — and compare FBA net profit per unit against a realistic FBM cost estimate from a 3PL quote. You will likely find 20 to 30% of your catalog should move.
- Activate FBM listings on every FBA ASIN. Even if you never route meaningful volume through FBM, the active listing protects your rank during FBA stockouts and gives you a no-lag lever to pull if fees shift again mid-year.
- Optimize every inbound shipment for Amazon-optimized splits. The $0.00 placement fee on Amazon-optimized routing versus $0.40 to $0.68 per unit on single-location shipments is the single easiest per-unit cost reduction available in 2026.
- Evaluate AWD for any catalog with seasonal demand or container-scale imports. The Q4 storage cost differential alone often justifies the relationship before any other benefit is considered.
- Pressure-test your 3PL partner. If your current FBM fulfillment partner cannot offer two-day ground delivery to 80%+ of the US, consistent same-day cutoffs, and automated Amazon API integration, it is limiting your ability to compete for the Buy Box through FBM.
- Build the quarterly audit into your operating calendar. The fee environment will continue to change. A hybrid model that is not regularly recalibrated will drift back toward suboptimal SKU assignments within two to three quarters.
- Evaluate SFP for heavy, Prime-sensitive, fast-moving SKUs. If you have items above 5 pounds that consistently move 50+ units per month and convert measurably better with the Prime badge, the SFP economics may be significantly better than FBA for those specific items — particularly post-July 6, 2026 if your 3PL can meet the tightened delivery-speed requirements.
The Amazon fee environment is not going to get simpler. Fee structures will continue to evolve, new surcharges will arrive with limited notice, and the economic case for running everything through FBA will continue to erode for the parts of your catalog where it was never truly strong. The sellers who treat fulfillment assignment as a dynamic, data-driven decision rather than a set-it-and-forget-it default are the ones whose margins will hold.