
There is a version of the Amazon fee story that Amazon likes to tell. Referral rates didn’t change. The average FBA fee increase is less than half a percent of a typical item’s selling price. These are technically accurate statements, and they are also almost completely beside the point.
The real story in 2026 is not any single line item. It is the simultaneous movement of every cost category a seller depends on — fulfillment, inbound logistics, advertising, landed goods, and now payment timing. Each individual change looks manageable in isolation. Stacked together across a single P&L, they represent the most sustained margin compression event in Amazon’s history as a third-party marketplace.
This article isn’t about listing fee changes you can already find on Seller Central. It’s about understanding how the full cost stack interacts — and then working through the specific, tested tactics that sellers with resilient catalogs are using to rebuild unit economics from the ground up.
The sellers who will come out of 2026 in better shape are not the ones who complained the loudest about the fee schedule. They are the ones who treated every cost line as a variable they could engineer around — even when that meant making difficult calls about pricing, packaging, fulfillment method, and catalog composition.
That’s what this analysis covers. Not theory. Not a complaint thread. The actual math, the actual levers, and the decision framework that makes margin recovery possible without sacrificing the sales rank you’ve spent years building.
Why This Year Feels Different: The Compounding Cost Problem
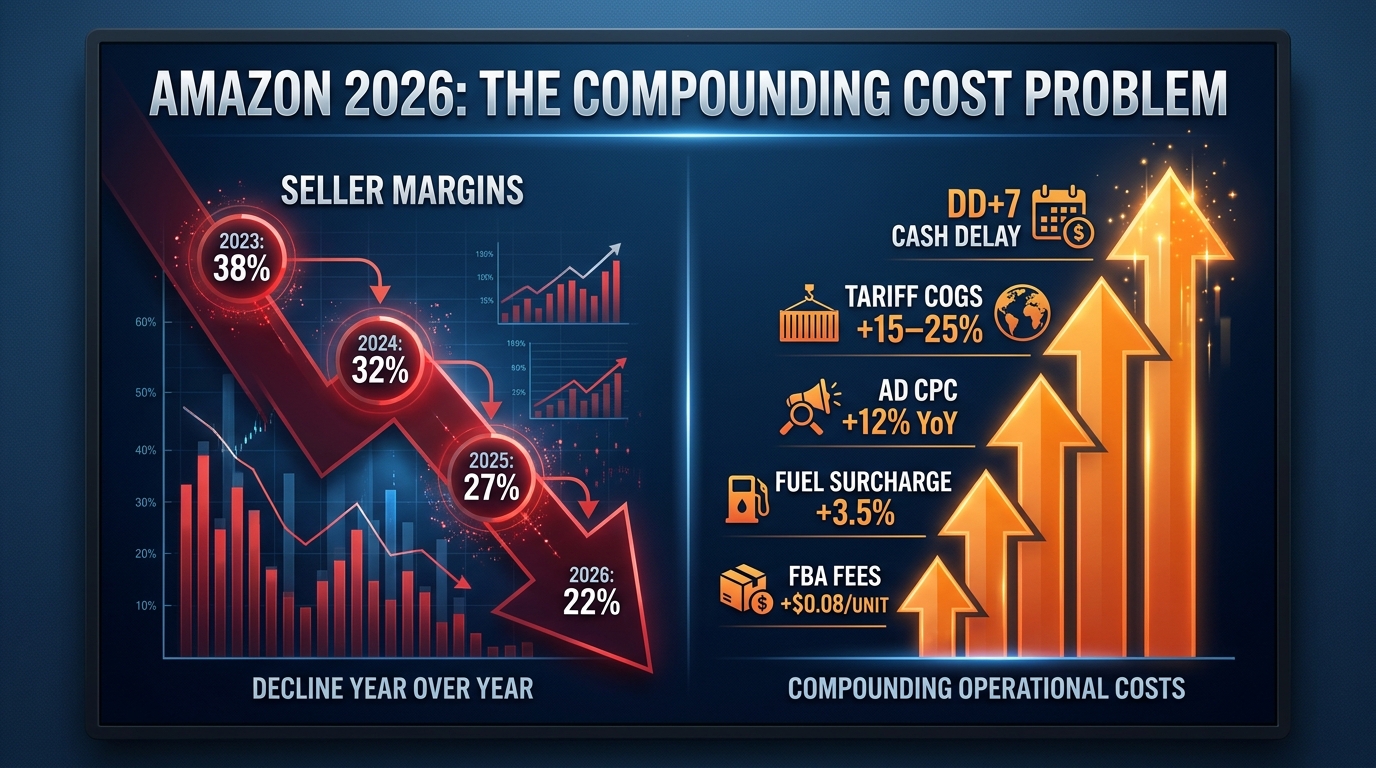
Amazon sellers have absorbed fee increases before. What distinguishes 2026 is not the size of any single change — it’s the number of unrelated cost drivers that all moved in the same direction within a twelve-month window.
A useful way to think about this is the cost-stack model. Every unit you sell on Amazon passes through a sequence of cost layers before a cent of profit reaches your bank account. In 2026, four of those layers have inflated simultaneously:
- Fulfillment costs: FBA base fees increased in January, then a 3.5% fuel and logistics surcharge was layered on top in April.
- Inbound costs: Placement fees rose for standard-size products using minimal splits, and the bulky tier was restructured in ways that increased per-unit inbound cost for many sellers.
- Advertising costs: Blended Amazon CPC is running at approximately $1.18–$1.22, up 8–12% year over year, with Sponsored Display notably higher.
- Goods costs: Sellers sourcing from China are absorbing tariff-driven COGS increases that show up as higher landed costs — an input that compounds every other margin pressure downstream.
And that’s before accounting for the DD+7 payout policy that began rolling out in March 2026, which doesn’t reduce your revenue but does extend your cash conversion cycle — creating a permanent working capital drag that becomes more expensive the faster you try to grow.
The problem isn’t that any one of these is new. The problem is that historically, one or two might worsen while others stabilized. In 2026, the entire stack moved at once — and many sellers who modeled their unit economics in late 2025 are now running with assumptions that are structurally wrong.
The Full Fee Stack: What Amazon Actually Changed in 2026
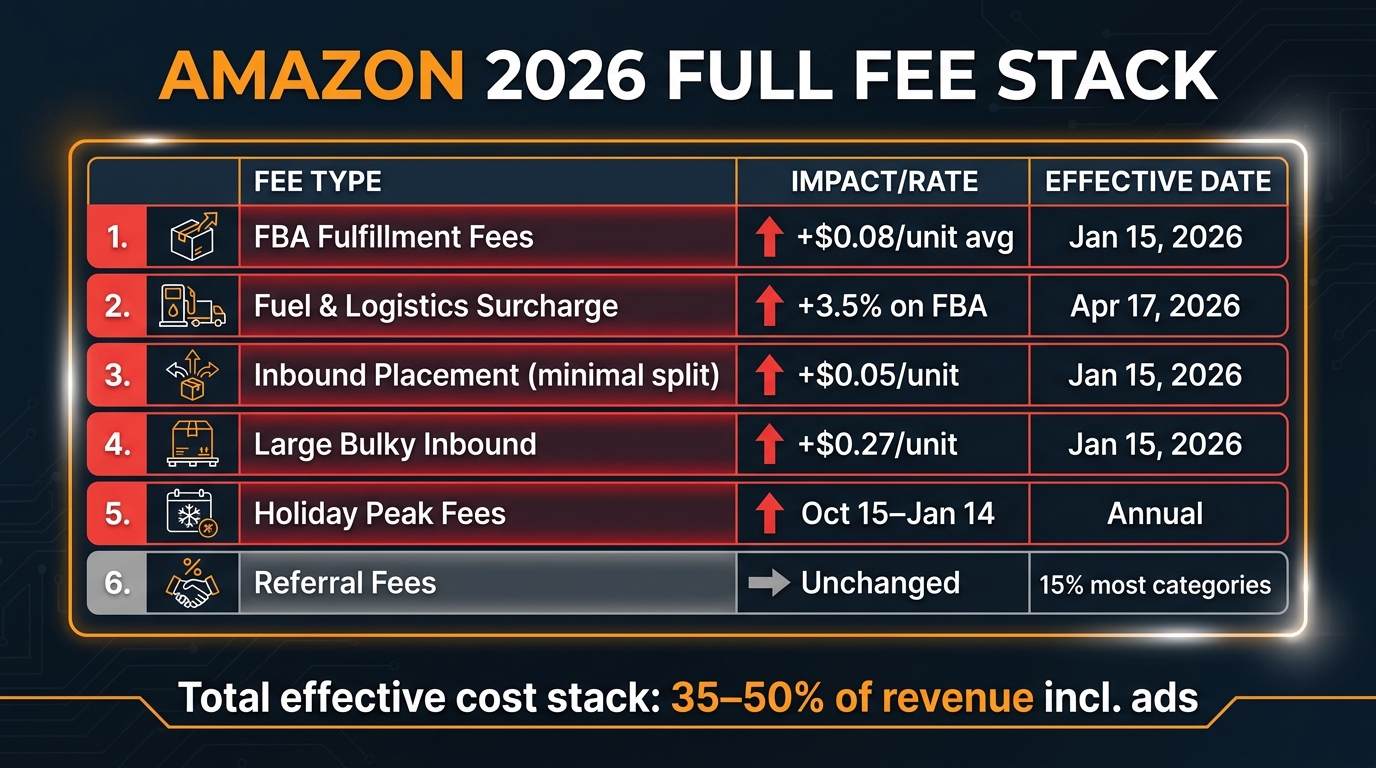
Before building a recovery strategy, you need an accurate read of what changed. Here is a consolidated view of the 2026 U.S. fee updates, based on Amazon’s official announcements.
FBA Fulfillment Fee Increases (January 15, 2026)
Amazon’s January update raised base FBA fulfillment fees by an average of $0.08 per unit across all size tiers. The average figure, however, masks meaningful variation by product type and price band:
- Small standard-size, priced $10–$50: fee increase of approximately $0.25 per unit — more than three times the average
- Large standard-size, priced $10–$50: approximately $0.05 per unit increase
- Products priced below $10: small standard-size fee increases also apply, though at different rates depending on exact tier
For the mid-price small standard-size seller — one of the most common product profiles on Amazon — that $0.25 per unit increase is not trivial. On a product selling at $25 with a 10% net margin, a $0.25 fee increase represents a 10% reduction in absolute profit per unit before any other change is factored in.
The 3.5% Fuel and Logistics Surcharge (April 17, 2026)
This is the update that received less coverage than the January changes but carries significant cumulative weight. Starting April 17, 2026, Amazon applied a 3.5% fuel and logistics surcharge to all U.S. and Canada FBA fulfillment fees. The surcharge also applies to Buy with Prime and Multi-Channel Fulfillment orders.
What makes this surcharge meaningful is its compounding nature. It is applied on top of already-increased January fees. If your FBA fee for a given item rose from $3.80 to $3.88 in January, the April surcharge adds approximately $0.14 on top — bringing the effective fee to around $4.02. That’s a combined increase of $0.22 per unit from a base that Amazon describes as averaging only $0.08.
The surcharge is also an open-ended mechanism. Amazon has used fuel surcharges before and has the structural precedent to adjust the rate or extend the timeline. Sellers should model it as a semi-permanent cost input rather than a temporary line item that disappears next quarter.
Inbound Placement Fee Changes (January 15, 2026)
Amazon also restructured inbound placement fees for 2026, adding new weight bands for standard-size products and splitting the old Large Bulky tier into Small Bulky and Large Bulky. The fee impact:
- Standard-size, minimal split: average increase of $0.05 per unit
- Large Bulky, minimal split: average increase of $0.27 per unit — the most significant per-unit change in the entire 2026 update
- Amazon-optimized splits: no fee, as before
The practical effect is a strong financial incentive to route inventory through Amazon’s preferred split model rather than using minimal-split shipments. Sellers who continue defaulting to minimal splits on bulky or standard-size items are now paying a larger premium for that operational convenience.
Holiday Peak Fulfillment Fees
Amazon has also announced holiday peak fulfillment fees running from October 15, 2026 to January 14, 2027. These seasonal surcharges are layered on top of all existing fee structures and apply to FBA, MCF, and Buy with Prime fulfillment. For sellers with high Q4 velocity, peak fees can materially erode the margins on what should be the most profitable quarter of the year.
What Didn’t Change
For balance: Amazon did not increase referral fee percentages across the U.S. marketplace in 2026. For most categories, referral fees remain at 15%, 12%, or 8% depending on product type. This is meaningful because referral fees represent a significant portion of total Amazon costs — keeping those stable while fulfillment costs rise changes the composition of the cost stack, but it is not the relief some sellers interpreted it as.
Storage fees also saw minor regional adjustment rather than broad increases, with rates of $0.57 per cubic foot per month in the West and $0.48 in East and South regions. Low-inventory-level fees now apply to Small and Large Bulky items at the FNSKU level, creating a new trigger for sellers who run lean on slower-moving oversized inventory.
The 3.5% Surcharge No One Is Adequately Modeling
Let’s spend more time on the fuel and logistics surcharge because it is genuinely underweighted in most seller P&L models right now.
Amazon describes the surcharge as a mechanism to offset increased transportation and logistics costs in its fulfillment network. That framing is legitimate — carrier costs, warehouse labor, and fuel-related expenses have all remained elevated through 2026. But from a seller’s perspective, the framing matters less than the math.
How the Surcharge Compounds Over Volume
Consider a seller moving 5,000 units per month of a large standard-size product with a current FBA fulfillment fee of $5.10 after the January increase. The 3.5% April surcharge adds $0.18 per unit, bringing the fee to $5.28. At 5,000 units per month, that is $900 in additional monthly cost — or $10,800 annualized — from a surcharge that many sellers have not yet built into their pricing models.
Now add the January base increase on top. If that same SKU saw a $0.15 per-unit rise in January (reasonable for large standard-size), total additional FBA cost per unit is now $0.33. Annual additional cost: $19,800. That’s not a rounding error — it’s a material P&L impact that should have triggered a pricing review the day the surcharge was announced.
The Multi-Channel Fulfillment Problem
The surcharge is not limited to FBA orders. It also applies to Multi-Channel Fulfillment, which means sellers who use Amazon’s warehouse network to fulfill orders from their own website, Shopify store, or other channels are paying the surcharge on those units too. For sellers who built MCF into their cost model as a competitive fulfillment option, this reduces the spread between MCF and third-party 3PL alternatives significantly.
If you are using MCF at scale for off-Amazon channels, now is the time to run a fresh comparison against regional 3PL rates. The surcharge may have shifted the break-even point materially.

Inbound Placement Fees: The Operational Decision Hiding Inside a Fee Change
The inbound placement fee restructure deserves its own section because it is not purely a financial change — it is an operational decision embedded in a pricing mechanism. Amazon is, in effect, using the fee structure to push sellers toward a specific inbound behavior: use Amazon-optimized splits, accept multi-FC routing, and avoid the minimal-split penalty.
For sellers who can comply, the financial outcome is clear: no inbound placement fee. For sellers who cannot — because of cash flow constraints, supplier lead times, or shipment size limitations — the new fee structure is simply a higher cost of doing business in a particular operational configuration.
Understanding the Split Options and Their Trade-offs
Amazon offers several inbound placement options:
- Amazon-optimized split: Amazon routes your inventory to multiple FCs based on demand modeling. No placement fee, but you give up control over destination and may face split shipments with higher prep complexity.
- Partial split: You ship to two or more locations; a reduced placement fee applies in most cases.
- Minimal split: You ship everything to one or two FCs. Full placement fee applies. Simplest operationally; most expensive under the 2026 structure.
The $0.27 per unit increase for Large Bulky minimal-split shipments is the sharpest single-line fee change in the entire 2026 update. A seller shipping 1,000 Large Bulky units per month using minimal splits is now paying an additional $270 per month in placement fees compared to the pre-2026 structure — simply because of how they route their inventory inbound.
When Minimal Splits Still Make Sense
Despite the financial incentive to avoid minimal splits, there are legitimate operational reasons some sellers maintain them:
- Suppliers shipping direct-to-Amazon need a single destination address for freight logistics
- Sellers with highly concentrated regional demand who can tolerate the fee as a cost of serving a specific geography efficiently
- High-velocity products where inbound placement fees are small relative to the total FBA cost and where single-FC routing simplifies replenishment management
The right answer is not to blindly migrate to Amazon-optimized splits. It is to model the all-in cost of each option per ASIN and make the decision that optimizes total landed cost — including increased prep complexity, potential split shipment losses, and the operational burden of multi-FC receiving.
DD+7: The Working Capital Problem That Looks Like a Policy Change

Amazon’s DD+7 payout policy — funds released seven calendar days after confirmed delivery — began its U.S. and Canada rollout on March 12, 2026. Amazon described it as a “one-time cash flow impact” during the transition. That framing is partially accurate. There is a one-time transition hit as sellers’ existing receivables convert to the new reserve schedule. But the more important impact is ongoing.
What the Math Actually Looks Like
Consider the cash conversion cycle for a typical FBA shipment:
- Day 0: Customer places order
- Day 1–4: Amazon picks, packs, ships, and delivers (average transit)
- Day 4: Delivery confirmed
- Day 11: Funds become available for disbursement (DD+7)
For a seller doing $50,000 per month in revenue, that means roughly $18,333 in capital is permanently deferred relative to what the cash conversion cycle looked like under the previous shipment-based reserve model. That capital has to come from somewhere — inventory financing, credit lines, or reduced reinvestment capacity.
The impact scales directly with revenue. A seller at $200,000 per month has approximately $73,000 in permanently deferred capital. A seller at $500,000 per month has $183,000 tied up in the reserve cycle at any given time — capital that can’t be used to buy inventory, fund ads, or cover supplier payments.
Why Growth Makes It Worse
The working capital trap embedded in DD+7 has a particularly damaging interaction with growth. When a seller accelerates — launching a new product, scaling ad spend, increasing inventory levels — the dollar value of deferred funds grows proportionally. Every dollar of new revenue creates more capital locked in the reserve cycle.
This means sellers who are trying to grow their way out of margin compression may be simultaneously making the working capital problem worse. The playbook of “spend more on ads to drive volume and make up margin in scale” runs directly into the reality that more volume means more capital tied up in DD+7 reserves.
The practical response is to build DD+7 math explicitly into your working capital model before scaling. Know exactly how many additional days of capital your growth plan requires, and secure that capacity — whether through credit lines, supplier terms negotiations, or revenue-based financing — before increasing velocity, not after the cash crunch arrives.
Ad Cost Inflation: The Second Fee Bill Sellers Keep Paying
Amazon’s platform fees are the visible cost. Advertising is the invisible one — and in 2026, the invisible bill has grown substantially.
Blended Amazon CPC is running at approximately $1.18–$1.22 across the platform, representing 8–12% year-over-year inflation. In competitive categories and in formats like Sponsored Display, the picture is worse: Sponsored Display CPC is reported at approximately $3.72, with roughly 49% year-over-year growth. That is not a marginal cost change. For sellers relying heavily on Sponsored Display for retargeting and audience campaigns, it is a structural margin problem.
The Break-Even ACoS Trap
The relationship between CPC inflation and margin compression operates through break-even ACoS. Your break-even ACoS is the maximum percentage of revenue you can spend on ads before your advertising contribution goes to zero. The formula:
Break-even ACoS = (Price − COGS − FBA fees) ÷ Price
When FBA fees increase and COGS increases due to tariffs, break-even ACoS falls. When break-even ACoS falls and CPCs rise, the acceptable bid range for profitable advertising shrinks from both directions simultaneously.
A product with a $30 selling price, $8 COGS, and $5.50 FBA fee (post-2026 increases) has a break-even ACoS of 55%. If CPCs average $1.20 and conversion rate is 10%, cost per sale is $12, giving an ACoS of 40% — still within break-even. But if CPCs rise to $1.40 and conversion rate slips to 9%, cost per sale becomes $15.56, ACoS climbs to 52%, and the margin window for profitable advertising has nearly closed.
This is not hypothetical — it describes the economics many sellers in mid-competition categories are navigating right now.
What Profitable Advertisers Are Doing Differently
Sellers who are maintaining advertising profitability in 2026 are generally doing three things that distinguish them from those watching ACoS inflate unchecked:
- Migrating converting search terms to manual campaigns: Harvesting high-performing auto campaign search terms and running them in manual exact-match campaigns at controlled bids. This eliminates wasted spend on broad match variance and keeps CPC discipline tighter.
- Setting explicit bid ceilings tied to break-even ACoS: Rather than letting dynamic bidding run freely, profitable sellers set maximum bids calculated backward from their actual contribution margin. When break-even ACoS drops because fees rise, bid ceilings drop with it.
- Reducing Sponsored Display dependency: Given the disproportionate CPC inflation in Sponsored Display ($3.72 vs. ~$1.20 blended), sellers with tight margins are deprioritizing SD campaigns in favor of Sponsored Products where cost-per-click is more controllable.
The overarching theme: ad spend in 2026 needs to be managed to margin targets, not to volume or rank targets. Revenue growth funded by advertising that exceeds break-even ACoS is not growth — it’s a slower version of losing money.
Tariff Pressure: When Your Cost Structure Changes Before You Check Your P&L
For sellers sourcing from China, the 2026 cost environment includes a dimension that Amazon’s fee schedule doesn’t capture at all: higher landed costs driven by tariff changes on Chinese imports.
Amazon CEO Andy Jassy has publicly acknowledged that tariff costs are already appearing in marketplace prices, as sellers pass through higher import duties either partially or fully. The sellers who haven’t yet raised prices are typically those still working through pre-tariff inventory purchased at lower cost. As that inventory runs out — which is already happening across many categories — the full cost impact will translate directly to retail pricing or margin compression, with no middle ground.
How Tariffs Interact With the Rest of the Cost Stack
The insidious effect of tariff-driven COGS increases is that they amplify every other margin pressure downstream. Consider:
- Higher COGS reduces gross margin percentage
- Reduced gross margin means a lower break-even ACoS
- Lower break-even ACoS means you can profitably bid less on ads
- Lower maximum bids mean reduced ad visibility
- Reduced ad visibility can lower sales velocity
- Lower velocity can trigger low-inventory-level fees on slower-moving items
The cascade is real. A 15–20% COGS increase from tariffs is not just a gross margin problem — it is a fee interaction problem, an advertising competitiveness problem, and potentially a storage and inventory velocity problem too.
Practical Sourcing Responses
The longer-term responses being explored by sellers facing tariff-driven COGS pressure include:
- HTS code audit: Working with customs brokers to verify that products are classified under the most accurate harmonized tariff schedule code. Misclassification typically errs toward higher duty rates, and a correction can reduce landed cost without changing the product at all.
- Supplier cost negotiation: With tariffs raising effective landed costs, some suppliers are absorbing a portion of the increase to maintain relationships and order volumes. This is more viable for high-volume buyers with established supplier relationships, but worth pursuing explicitly rather than assuming all of the cost increase will land with you.
- Selective sourcing diversification: For products with sufficiently large volumes to justify tooling investment, Vietnam, India, and Mexico have emerged as production alternatives with different tariff profiles. The economics don’t work for all SKUs — minimum order quantities and tooling costs must be modeled honestly — but for core catalog items, the math increasingly favors the conversation.
SKU-Level Economics: The Only Model That Survives 2026

The single most common reason sellers are surprised by margin deterioration in 2026 is that they are running their business at the account level rather than the ASIN level. Account-level metrics — total revenue, blended margin, overall ACoS — feel like meaningful indicators until the environment changes. When fees move at different rates across size tiers and every SKU has a different ad spend profile, account-level math hides which parts of your catalog are destroying value.
The shift to SKU-level economics is not optional in 2026. It is the foundation of every other recovery strategy in this article.
Building the True Contribution Margin Per ASIN
True contribution margin per ASIN is not what Seller Central shows you. It requires assembling inputs from multiple data sources:
- Revenue: Average selling price (after returns and refunds, not gross sales)
- COGS: Fully landed cost including product cost, freight, import duties, prep, and inbound shipping to Amazon
- Referral fee: Category-specific percentage × selling price
- FBA fulfillment fee: Post-2026 rate for the specific size tier and price band
- Inbound placement fee: Based on your actual shipment split configuration
- Monthly storage fee: Allocated to the ASIN based on cubic footage and average monthly units
- Return rate cost: Return rate × (selling price loss + FBA return processing fee)
- Ad spend: Actual attributed ad spend per unit sold (total spend ÷ ad-attributed units)
The number that results — revenue minus all of the above — is your true contribution margin per unit. For many sellers who have not built this model recently, the output is a revelation. Some ASINs that look profitable at the account level are actively destroying margin. Some that look like underperformers based on revenue are carrying the catalog on thin-but-real positive contribution.
Using the Model to Make Decisions
Once you have true contribution margin per ASIN, the decision framework becomes significantly clearer:
- Positive contribution, strong velocity: Core catalog. Protect and potentially scale.
- Positive contribution, weak velocity: Investigate why. Can repricing or ad reallocation improve velocity without destroying margin? If not, these are candidates for cost reduction via packaging or sourcing changes.
- Negative contribution, strong velocity: The most dangerous category. These ASINs are destroying value at scale. Immediate action required — price increase, cost reduction, or removal.
- Negative contribution, weak velocity: Cut. The opportunity cost of capital tied up in these ASINs exceeds any potential recovery scenario.
This framework does not ask you to build a perfect spreadsheet in one sitting. It asks you to have current, accurate data per ASIN and to make decisions based on that data rather than intuition or historical performance.
The Three Levers: Price, Bundle, Cut
With SKU-level economics in hand, margin recovery comes down to three categories of action. They are not equally available to every seller on every product, but they represent the complete menu of levers that work — and that experienced sellers are actively using in 2026.
Lever 1: Selective Price Increases
The most direct margin recovery tool is also the most underused by sellers who fear conversion-rate erosion. The evidence from 2026 operator experience suggests that fear is often overstated — particularly for products with strong review profiles, limited direct substitutes, or brand recognition that creates switching cost.
The tested approach is disciplined, incremental testing rather than large jumps:
- Start with a 2–5% price increase on your highest-rated, most defensible ASINs
- Monitor unit session percentage (conversion rate) for 14–21 days — not shorter, because organic rank adjustments take time to settle
- Keep the increase if unit volume falls less than 10%; roll back if it falls more than 15%
- For products priced at natural anchors ($19.99, $24.99, $29.99), consider the psychological impact of crossing a price threshold before raising
The goal is not maximum price. It is the highest price at which conversion rate remains strong enough to maintain your organic rank and ad efficiency. A product that holds rank at a 5% higher price is worth more than a product priced to win the lowest-cost positioning in a fee environment where low-cost often means negative contribution.
Lever 2: Bundling and Multi-Pack Architecture
Bundling is one of the most effective margin recovery tools available because it works on multiple economic variables simultaneously. A properly structured bundle or multi-pack:
- Increases average order value without proportionally increasing FBA fulfillment fee (a 2-pack in the same size tier as a single unit pays a similar absolute fulfillment fee while doubling revenue)
- Reduces effective referral fee percentage if the bundle hits a category price-band threshold where the rate steps down
- Creates a new ASIN that is harder for competitors to price-match directly, reducing head-to-head price pressure
- Can improve ad efficiency by spreading a fixed CPC cost across higher revenue per unit
The most effective bundles are built around products that customers already buy together rather than arbitrary quantity packs. If your category data shows that customers who buy your product tend to also purchase a complementary item, a curated bundle of both creates genuine perceived value — not just a quantity play.
Multi-packs work best for consumables, accessories with repeat-purchase cycles, or gift-context products where higher quantities have natural purchase logic. For durables with long replacement cycles, multi-packs rarely convert well and shouldn’t be the default bundling strategy.
Lever 3: Catalog Pruning
The hardest lever to pull is often the most valuable one. Removing or delisting ASINs with negative contribution margin is counterintuitive for sellers who built their catalog by adding products — but in 2026, catalog sprawl is a direct cost, not just an organizational nuisance.
Every negative-contribution ASIN on FBA is generating storage fees, inbound placement costs, return processing overhead, and account management complexity. It is also consuming the finite time and attention of whoever manages your advertising and catalog operations. Cutting these ASINs does not reduce your business — it concentrates resources on the parts of your catalog that are actually building value.
Before pruning, confirm that the contribution margin calculation is accurate and current. An ASIN that looked marginal three months ago may look different after a price increase test or a packaging change. But an ASIN that has been cash-flow negative for two or more consecutive review cycles — with no clear path to improvement — is a cost center, not a product.
Packaging Engineering: The Fee Reduction That Requires No Price Change

Packaging optimization is one of the highest-leverage, lowest-visibility margin recovery tools available to Amazon sellers — and it is systematically underutilized because it requires cross-functional work between operations, sourcing, and the supplier relationship.
Amazon’s FBA fee tiers are determined by the dimensions and weight of the packaged product as it enters Amazon’s fulfillment network. Not the product itself — the package. If your current packaging places a product in a higher size tier than it needs to be in, you are paying a fee premium on every unit that ships for as long as that packaging design remains unchanged.
Size Tier Economics in 2026
The fee difference between small standard-size and large standard-size FBA tiers is significant at 2026 rates. Moving a product from large standard to small standard — by reducing packaging dimensions so the item fits within the small standard boundaries — can reduce per-unit FBA fees by $1.00–$1.80 depending on weight and exact dimensions.
At 1,000 units per month, a $1.50 per-unit fee reduction through packaging optimization saves $1,500 per month, or $18,000 per year. That’s a return on investment that typically justifies a packaging redesign investment within six months — often much faster.
How to Audit Your Packaging
The starting point is to pull your current FNSKU labels from Seller Central and identify the actual size tier classification for each ASIN. Then measure the physical packaged dimensions of your product and compare them to Amazon’s published size tier boundaries.
For products that are close to a tier boundary — within half an inch or a few ounces — it is worth requesting that your packaging supplier explore whether a minor structural redesign could bring the package within the lower tier. Small reductions in box wall thickness, insertion tray removal, or polybag-versus-box packaging changes can shift tier classification without any change to the product inside.
Note: dimensional accuracy matters. If Amazon measures a package at a different dimension than your FBA fee was calculated on, you may receive a fee adjustment — in either direction. Run a product measurement audit through Amazon’s FBA Dimensions tool before and after any packaging change to confirm the intended tier classification is reflected correctly.
FBM as a Margin Shield: When Fulfilling Yourself Pencils Out
Fulfilled by Merchant (FBM) is not a fallback for sellers who can’t get FBA right. In 2026, it is a strategic option that deserves explicit consideration for specific SKU types — and the 2026 fee environment has expanded the category of products where FBM or Seller Fulfilled Prime (SFP) produces better unit economics than FBA.
Which SKUs Make Sense for FBM in 2026
The fee structure changes make FBM most attractive for:
- Oversized or heavy products: Large Bulky items now carry both higher fulfillment fees and significantly higher inbound placement fees. For products where your own shipping costs to the customer are competitive with the full Amazon fee stack, FBM can produce meaningfully better contribution margin.
- Slow-moving inventory: Products with low monthly velocity face disproportionate storage fee exposure. FBM eliminates the Amazon storage cost entirely, replacing it with your own warehouse cost — which is almost always lower for slow-moving items than Amazon’s monthly storage fee at low volumes.
- High-return-rate products: FBA return processing fees apply each time a customer initiates a return. FBM gives you control over the return process, which can reduce the net cost of returns for product categories with structurally high return rates.
- High-margin, low-velocity premium products: For products where the unit economics are strong but velocity doesn’t justify FBA inventory commitment, FBM avoids inbound, storage, and placement costs while maintaining marketplace presence.
The SFP Middle Ground
Seller Fulfilled Prime sits between FBA and standard FBM. It requires 1-day or 2-day delivery from your own warehouse, with a premium carrier label, and your listing displays the Prime badge. The trade-off: you maintain fulfillment control and avoid FBA fees, but you pay premium carrier rates to meet Prime delivery windows.
SFP works best for sellers with existing warehouse infrastructure, carriers who have negotiated national 2-day rates, and products where the difference between FBA fees and SFP carrier costs is positive. At 2026 fee levels, that positive spread exists for more product types than it did two years ago.
Building a Cost-Resilient Catalog: Putting It All Together
The common thread across every tactic in this article is that margin recovery in 2026 is not a one-time exercise — it is an ongoing operating discipline. The sellers who will be in the strongest position twelve months from now are those who build the capability to identify and respond to cost-stack changes at the SKU level, as a continuous practice rather than a crisis response.
The Quarterly Margin Review Cadence
Sustainable margin management in the 2026 environment requires a structured review cadence. At a minimum, every quarter:
- Rebuild true contribution margin per ASIN using current fee rates, current CPC data, and current COGS
- Classify every ASIN into the four-quadrant framework: strong/weak contribution × strong/weak velocity
- Run a packaging audit on any ASIN within range of a tier boundary
- Test or re-test price sensitivity on core ASINs, particularly if competitive pricing has shifted
- Review inbound placement fee exposure and assess whether Amazon-optimized splits can reduce total inbound cost
- Check DD+7 working capital requirements against current credit facility capacity and projected growth plans
This is not six hours of work. For most catalog sizes, a well-structured quarterly review takes two to four hours once the data templates are in place. The alternative — discovering mid-quarter that three of your top ten ASINs have flipped to negative contribution because fee inputs weren’t updated — is a far more expensive use of time.
What “Fee Resilience” Actually Means
Fee resilience doesn’t mean building a catalog that is immune to Amazon’s cost structure. No such catalog exists. It means building a catalog where:
- Every active ASIN has documented true contribution margin updated at least quarterly
- Pricing decisions are made against current economics, not launch economics
- Fulfillment method choices are revisited when fee structures change, not locked in based on initial product setup
- Packaging decisions factor in fee tier implications as part of the design brief, not as an afterthought
- Working capital planning accounts for Amazon’s payout timing before growth plans are set
The fee environment Amazon has built in 2026 is more complex, more layered, and more demanding of operational precision than at any point in the platform’s history as a third-party marketplace. The sellers who are growing profitably inside this environment are not doing so by finding loopholes or waiting for fees to come back down. They are doing it by knowing their numbers at a level of granularity that was optional before 2026 but is now the baseline for operating a sustainable Amazon business.
Actionable Takeaways
- Build or update a per-ASIN contribution margin model immediately using current 2026 fee inputs — including the April fuel surcharge, updated inbound placement rates, and actual ad spend per unit sold.
- Identify every ASIN running at negative contribution margin and classify each as: price-increase candidate, bundle candidate, packaging redesign candidate, FBM/SFP migration candidate, or cut candidate.
- Run a price sensitivity test on your three best-selling ASINs at a 3–5% price increase. Monitor for 21 days before drawing conclusions.
- Audit every Large Bulky ASIN’s inbound configuration and compare the total cost of minimal-split versus Amazon-optimized split routing. The $0.27/unit minimal-split increase may have already made optimized splits the better option.
- Calculate your DD+7 working capital requirement based on current monthly revenue and confirm that your credit or liquidity capacity covers it before your next growth phase.
- Review MCF pricing for off-Amazon fulfillment against current 3PL alternatives. The April surcharge may have shifted the break-even point enough to justify a channel-by-channel fulfillment review.
- Set explicit bid ceilings in all Sponsored Products campaigns based on updated break-even ACoS calculations that incorporate 2026 fee rates — not 2025 inputs.
The 2026 fee environment is not a temporary disruption. It is a new baseline. The sellers who treat it that way — and build operating discipline around that reality — will finish the year with stronger unit economics than they started with. The ones who are still waiting for conditions to normalize are paying the cost of that optimism in real margin, every month.