
When Amazon announced its 2026 FBA fee changes, the headline figure was almost reassuring: an average increase of $0.08 per unit, less than 0.5% of a typical item’s selling price. For most sellers reading that press release, the instinct was to exhale and move on.
That exhale was premature.
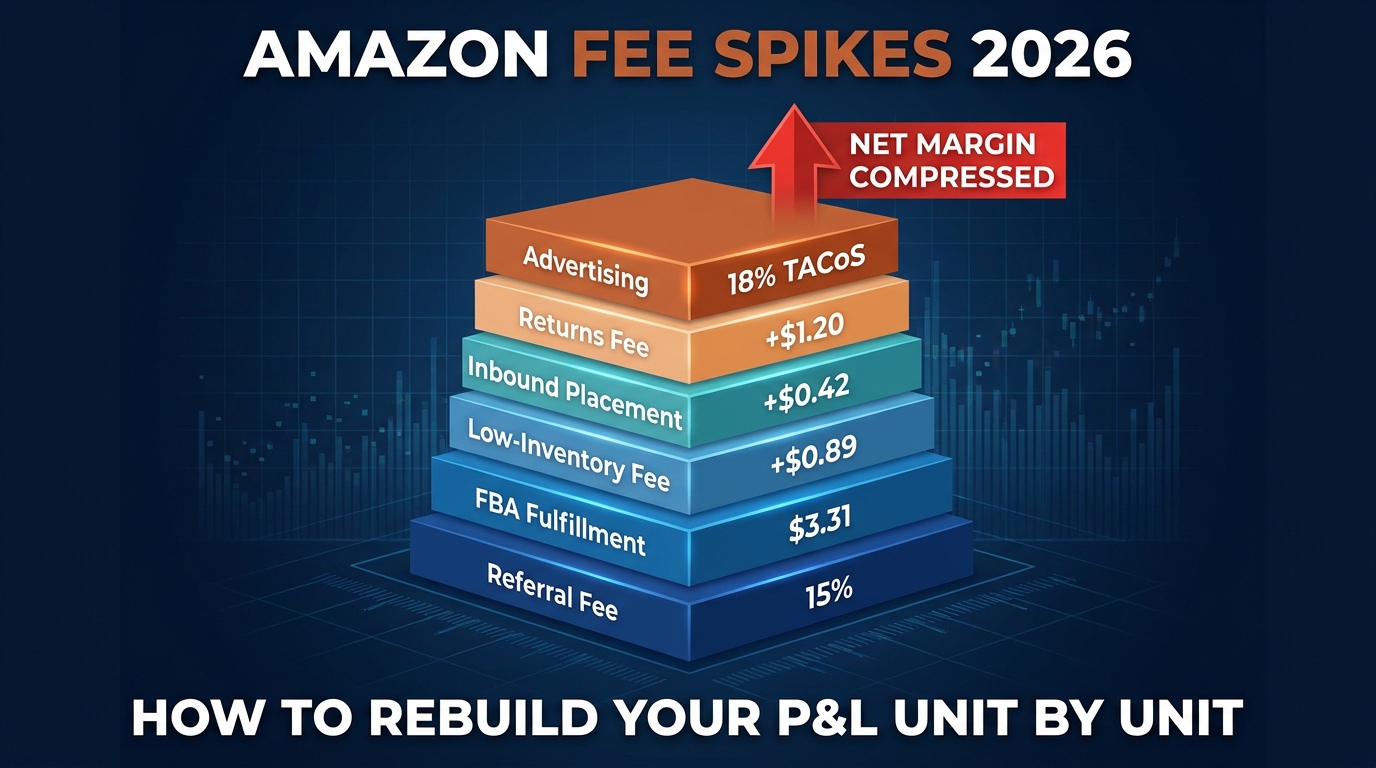
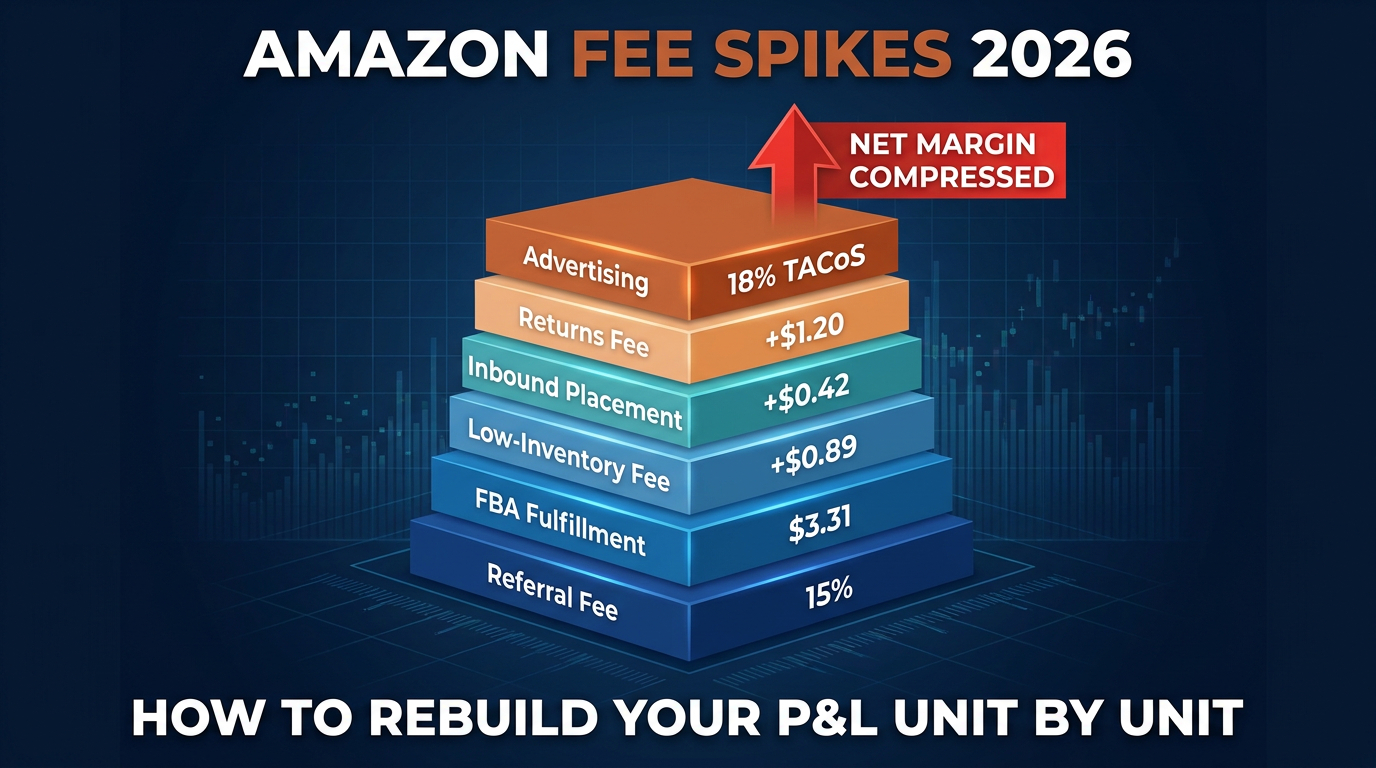
The $0.08 average is real — but it’s a single line in a much longer equation. When you factor in the expanded low-inventory-level fee now applied at the FNSKU level, inbound placement fees that can run $0.42 to $3.00+ per unit for sellers still using minimal splits, a returns processing fee that now applies across nearly every product category, a 3.5% FBA surcharge, and advertising CPCs that have climbed 8–12% year-over-year to an average of $0.95–$1.25 per click — the math tells a very different story.
Amazon’s total take from a typical FBA transaction now runs between 30–45% of the sale price before a single dollar of product cost or ad spend is counted. Net margins across the platform are clustering in the 10–20% range for established sellers and falling into single digits for anyone running a catalog of thin-margin, high-volume SKUs.
This isn’t a crisis that can be solved by cutting one cost. It’s a structural compression problem — and the only way to address a structural problem is with a structural response. That means rebuilding your P&L from first principles: not at the account level, not at the brand level, but at the individual SKU level, where every fee, every ad dollar, and every inventory decision either adds to or destroys contribution margin.
This guide walks through exactly how to do that — the fee stack you’re actually carrying, the specific levers that move the needle fastest, the triage framework for your catalog, and the 90-day sequence that turns analysis into recovered margin.
The Full Amazon Fee Stack in 2026 — What You’re Actually Paying
Before you can rebuild a P&L, you need to know precisely what you’re paying. Most sellers have a general sense of their fee exposure, but the 2026 fee environment includes several layers that are easy to miss, underestimate, or attribute to “cost of doing business” without ever quantifying them explicitly.
The Core Fee Categories
For a standard FBA seller in the US, the full fee stack looks like this:
- Selling Plan: $39.99/month flat for Professional sellers — a fixed overhead that scales down in impact as volume grows, but matters enormously at low SKU counts.
- Referral Fee: Typically 8–15% of the sale price depending on category. Most general merchandise sits at 15%. Some electronics and computers are 8%. Clothing and accessories hits 17%. This is Amazon’s core commission and it doesn’t move much — but the category you’re in dictates your structural starting point.
- FBA Fulfillment Fee: The primary per-unit shipping and handling charge. For a standard small-size item (6–12 oz), this sits around $3.06–$3.31 post the January 2026 increase. Large standard items can run $4.75–$7.00+. Bulky and oversize items climb significantly higher, with some large oversize tiers exceeding $150 per unit.
- Monthly Storage Fee: $0.78 per cubic foot (January–September) and $2.40 per cubic foot (October–December). At face value this seems minor, but slow-moving inventory compounds this cost quickly.
- Aged Inventory Surcharge: Units stored more than 181 days incur an additional $1.50 per cubic foot above the standard storage fee. Units exceeding 365 days trigger even steeper charges. This is where distressed inventory becomes genuinely destructive to your P&L.
- Low-Inventory-Level Fee: A per-unit charge of $0.32–$2.09 applied when both your 30-day and 90-day historical days of supply fall below 28 days. As of January 15, 2026, this fee expanded to Small Bulky and Large Bulky size tiers — meaning more SKUs are now eligible to trigger it.
- Inbound Placement Fee: Charged per received unit based on the shipment split option you choose when creating a shipment plan. Minimal splits (shipping to a single fulfillment center) now run approximately $0.42 per unit for standard-size items and can reach $2.00–$3.00+ for bulky products. Amazon-optimized splits — where Amazon routes your inventory to multiple FCs — are still charged at $0.00 per unit.
- Returns Processing Fee: Once limited to apparel and similar high-return categories, this fee now applies across nearly all product categories. It’s triggered when a SKU’s return rate exceeds the category threshold, and it’s billed in the third month following the returns — creating a delayed P&L hit that many sellers fail to account for in real time.
- FBA Surcharge: A 3.5% surcharge applied to FBA fulfillment fees in the US and Canada, separate from the base rate increases.
The Advertising Layer
None of the above includes advertising — which for most active sellers represents an additional 5–18% of gross revenue. Average CPCs in competitive categories now run $0.95–$1.25 per click, up roughly 8–12% year-over-year. A mature seller with well-managed campaigns might run at 8–12% TACoS. A seller launching aggressively or defending market share in a crowded category could easily be at 20–25% TACoS.
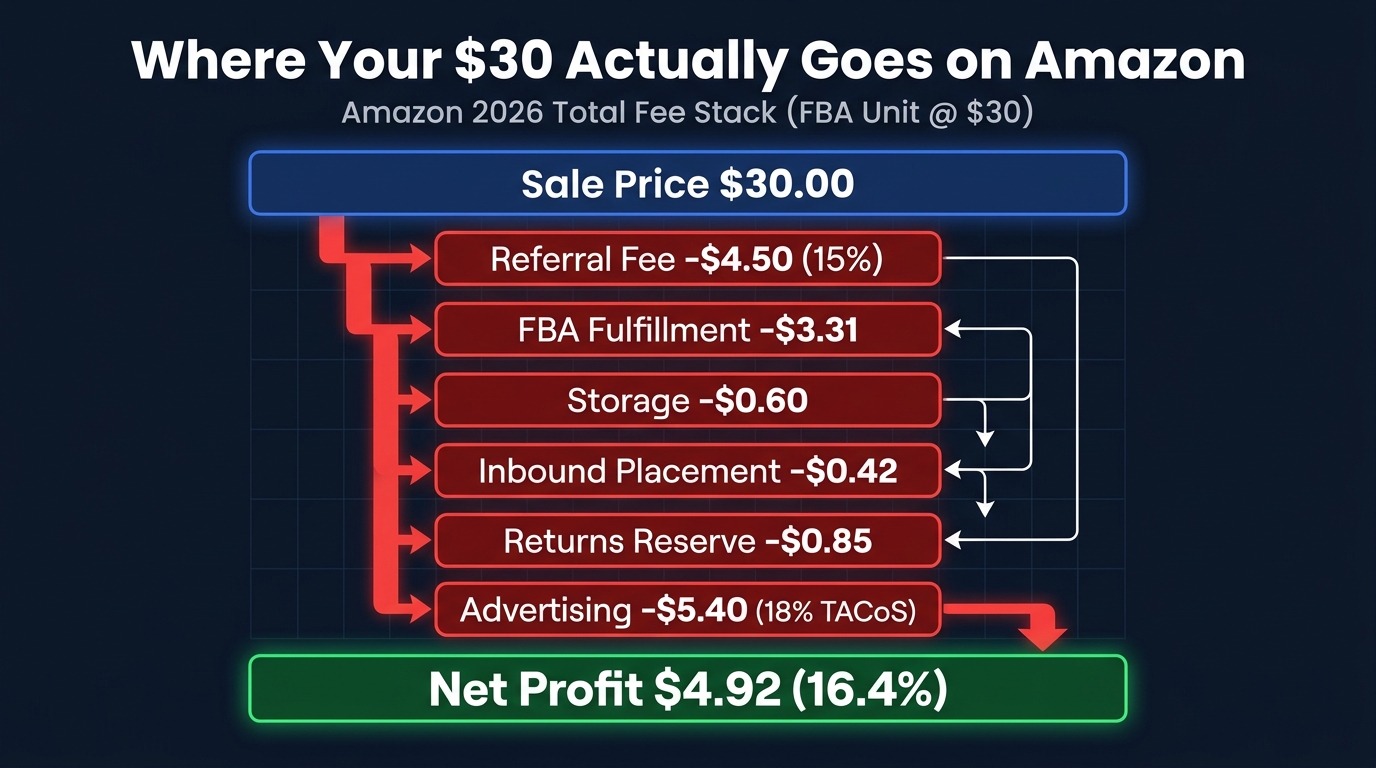
Add all of this together and the math is stark. For a product selling at $30 with a 15% referral fee, standard FBA fees, modest storage, a single inbound placement fee, returns provisions, and a 15% TACoS on advertising — you’re looking at total costs exceeding $20 before a single dollar of COGS or overhead. That’s a structural take rate approaching 67% of revenue, leaving $10 to cover product cost and generate profit. On a $10–$12 COGS item, that’s a net margin measured in the low single digits, if at all.
This is the actual problem. Not $0.08 per unit.
Why the “Average $0.08 Increase” Is a Misleading Headline
Amazon’s communication about the 2026 fee changes was technically accurate but practically incomplete. The $0.08 average increase in FBA fulfillment fees is a real number — but it’s an average across an enormous range of size tiers, product weights, and category types. The lived experience for individual sellers is far more variable.
Who Gets Hit Hardest
The sellers most exposed to 2026’s fee changes are not necessarily those with the highest absolute fee bills — they’re the ones where the marginal fee increase pushes a SKU from marginally profitable to structurally unprofitable.
Consider three seller profiles:
Profile 1 — Low-price, high-volume standard-size seller: Selling a $12 household product with a $1.80 referral fee and a $3.06 FBA fee. The 2026 fee increase adds $0.25 to the FBA charge, moving it to $3.31. That $0.25 increase represents a 14% jump in FBA fee cost and, for a seller running at 12% net margin ($1.44 per unit), a 17% reduction in net profit per unit. That’s not $0.08 average talk — that’s material.
Profile 2 — Bulky item seller with inventory fluctuation: A seller of kitchen appliances with irregular sales velocity is frequently triggering the low-inventory-level fee ($0.89–$2.09 per unit) on their bulky SKUs, now newly included in the fee’s scope as of January 2026. Combined with the inbound placement fee on minimal splits and the returns processing fee (appliances have above-average return rates), this seller’s actual per-unit fee load is running $3–5 above what a simple referral-plus-fulfillment calculation would suggest.
Profile 3 — Apparel or high-return-rate seller: The expansion of the returns processing fee to nearly all categories hits apparel sellers twice — once through the fee itself and again through the delayed billing cycle, which means return-driven fee charges can surface weeks after the sales data that caused them. A seller with a 15% return rate who hasn’t explicitly modeled the returns processing fee into their SKU P&L is running on an incorrect cost basis.
The Compounding Effect
What makes 2026’s fee environment particularly difficult is that none of these charges are new in isolation. The low-inventory fee, the inbound placement fee, the returns fee — all existed in some form before. What’s changed is the simultaneous tightening of multiple parameters: expanded eligibility (more size tiers, more categories), increased rates (inbound placement up from $0.37 to $0.42 per unit), and new interactions (the FNSKU-level calculation for low-inventory fees that makes it harder to manage exposure across a multi-SKU catalog).
The compounding effect of four or five fees each moving by 5–15% is not a 0.5% margin problem. For sellers whose catalogs have a meaningful portion of low-margin, volume-dependent SKUs, it can be a 3–7 point swing in net margin — the difference between a profitable Amazon business and one bleeding cash every week.
Building Your SKU-Level P&L from Scratch
The most important shift a seller can make in 2026 is moving from account-level financial thinking to SKU-level financial thinking. Your Seller Central account gives you revenue and a rough profit summary. What it doesn’t give you is a precise, fee-explicit contribution margin for every ASIN in your catalog — and without that, every strategic decision you make about pricing, advertising, inventory, and pack sizing is based on incomplete data.
The Two P&L Views You Need
Experienced Amazon operators typically maintain two distinct P&L views simultaneously:
Account-Level P&L: This is your standard financial statement — total revenue, COGS, gross margin, all fees in aggregate, advertising spend, overhead (software tools, employees, warehouse costs if applicable), and net profit. This view is what you’d show an investor or accountant. It tells you whether the business is profitable overall, but it doesn’t tell you which products are responsible for that profitability or its absence.
SKU-Level Contribution Margin P&L: This is the operational tool. For every ASIN, you calculate:
- Sale Price (average realized price after coupons/promotions)
- Less: Referral Fee (category % of sale price)
- Less: FBA Fulfillment Fee (size/weight tier rate)
- Less: Storage Cost (cubic footage × monthly rate × avg days stored)
- Less: Inbound Placement Fee (per-unit, based on shipment split option)
- Less: Returns Provision (return rate × estimated returns processing fee per unit returned)
- Less: COGS (landed cost including freight and duties)
- = CM1 (Pre-Advertising Contribution Margin)
- Less: Advertising Spend (actual ad cost attributable to this ASIN)
- = CM2 (Post-Advertising Contribution Margin)
CM1 vs. CM2 — Why Both Matter
CM1 tells you the structural health of a SKU — whether it can be profitable at all, regardless of how much advertising you run. A negative CM1 is a write-off scenario; no amount of ad optimization will save it. A low but positive CM1 is a “fix the fundamentals” scenario — pricing, pack size, sourcing cost, or fee exposure needs to change before you scale advertising.
CM2 tells you whether the SKU is profitable given your actual marketing investment. Sellers targeting 15–25% CM2 in 2026 are operating in a healthy range. Below 10% CM2, you’re generating revenue but not meaningful profit, and that becomes a serious issue when cash cycles tighten. The target TACoS range for a mature SKU in most categories should be 5–10% — meaning ad spend represents 5–10% of total revenue, not just attributed sales.
Setting Up the Model
Building this model doesn’t require expensive software. A well-structured spreadsheet with live pulls from your Seller Central reports will work. The key columns to add that most sellers miss are: a returns provision column (estimated, based on your actual return rate per ASIN), a storage aging column (units × days held × cubic footage × rate), and an inbound placement column (units received × fee per unit based on your split selection). Most P&L templates skip at least two of these three. Most sellers are therefore working from an overstated margin number.
The Low-Inventory Fee Trap — and the 28-Day Rule
Amazon’s low-inventory-level fee is one of the most misunderstood charges in the 2026 fee structure — partly because of how it’s calculated, and partly because many sellers assume good sell-through rates automatically protect them. They don’t.
How the Fee Actually Works
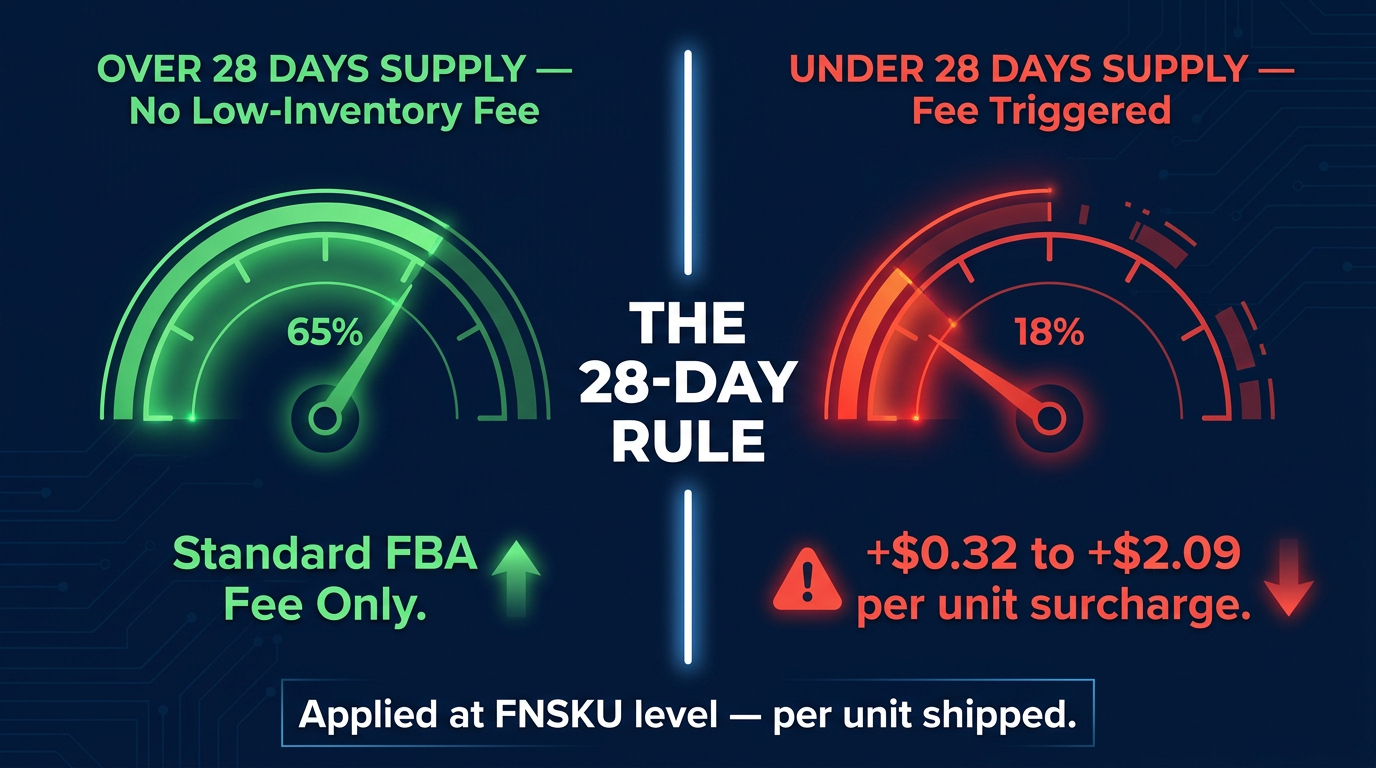
The fee is triggered when both your 30-day historical days of supply and your 90-day historical days of supply fall below 28 days — simultaneously. Amazon calculates this at the FNSKU level, not at the parent ASIN or brand level. This matters enormously for sellers with multiple size variations or color variants of the same product: a single variant running low can incur the fee independently of your other variants, even if your total inventory position looks healthy at first glance.
The fee range is $0.32 to $2.09 per unit shipped — not per unit stored, but per unit fulfilled from low-inventory stock. This means the more you sell when you’re in the danger zone, the more you pay. For a fast-moving SKU that routinely sells 50–100 units a day and occasionally dips below 28 days of supply during a peak demand period, this fee can add up to hundreds or thousands of dollars in a single month.
The Inventory Squeeze Paradox
The structural challenge here is that the 28-day safe zone sits in direct tension with the aged inventory surcharge that kicks in at 181+ days. Amazon effectively penalizes you for both running too lean (low-inventory fee) and running too heavy (aged inventory surcharge). The sweet spot — maintaining 28–120 days of supply consistently — requires precise demand forecasting, disciplined replenishment cycles, and the operational capacity to send inventory to Amazon reliably and on schedule.
Many sellers, particularly those sourcing from overseas with 30–60 day lead times, find it genuinely difficult to maintain this balance without buffer stock. And buffer stock is expensive — it ties up working capital and risks becoming aged inventory if velocity slows unexpectedly.
Practical Mitigation Strategies
The most effective approaches for managing low-inventory fee exposure in 2026 involve a combination of tactical and structural changes:
- Build FNSKU-level dashboards: Track days of supply at the variant level, not the parent ASIN level. An alert system that flags any FNSKU approaching 35 days of supply (7 days above the threshold) gives you a replenishment runway before the fee triggers.
- Stagger send quantities: Rather than sending one large shipment every 90 days, send smaller shipments every 30–45 days. This reduces the probability of hitting multi-week stockouts while also managing the aged inventory risk on the other side.
- Use Amazon Warehousing and Distribution (AWD): AWD allows you to hold upstream inventory at Amazon-operated warehouses at lower storage rates, with Amazon auto-replenishing your FBA nodes as needed. For high-velocity SKUs with irregular production schedules, AWD can be a genuine solution to the supply-side of the low-inventory fee problem.
- Model the fee into your minimum order quantity: If your typical reorder quantity leaves you exposed to the low-inventory fee in the last two weeks of a cycle, the cost of that fee over time may justify either a larger MOQ or a shift to more frequent, smaller orders — even at slightly higher per-unit freight costs.
Inbound Placement Fees — The $0 Hack Most Sellers Are Missing
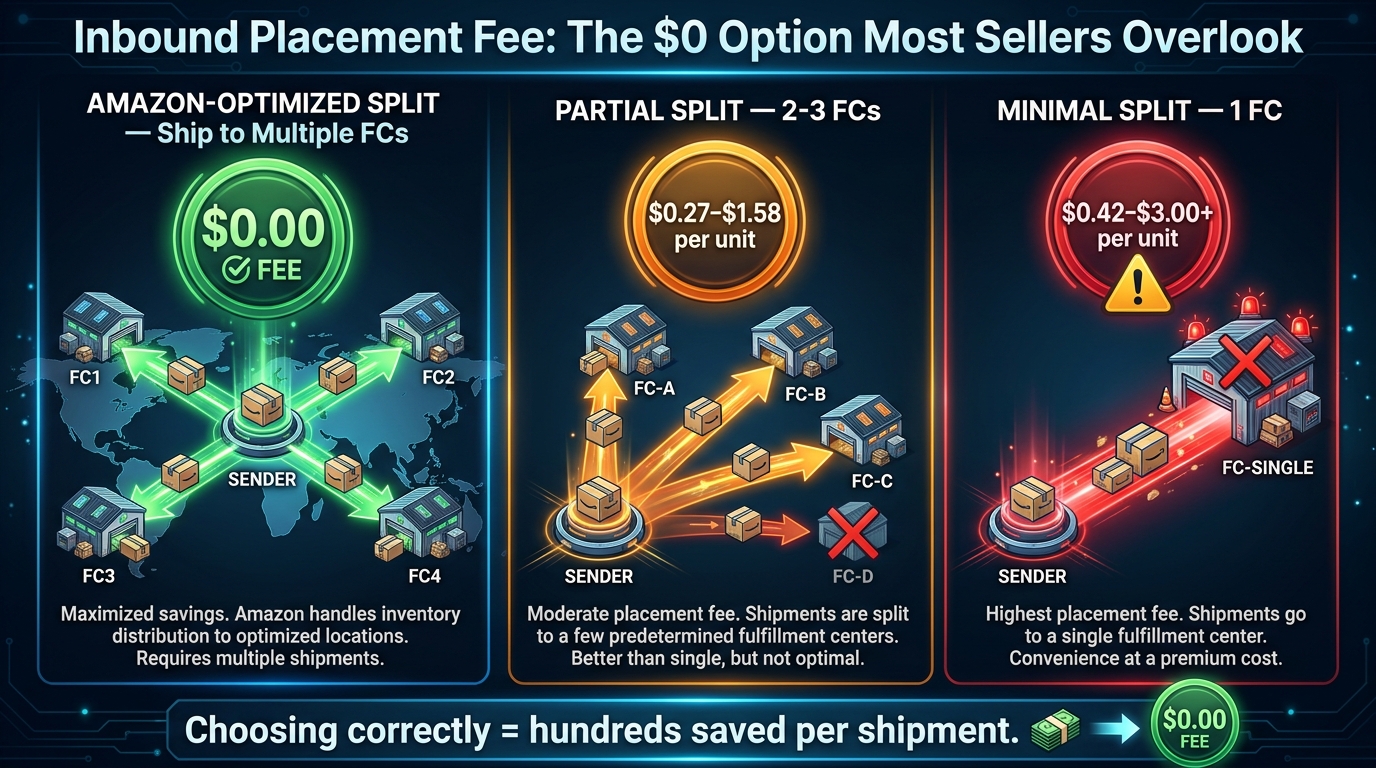
The inbound placement fee is the fee that has created the most confusion and frustration in seller communities since it was introduced — and the 2026 rate increase to $0.42 per unit for minimal splits hasn’t helped. But it also contains what is arguably the most straightforward margin recovery opportunity in the entire 2026 fee structure: choosing Amazon-optimized splits, which carry a $0.00 per-unit fee.
The Three Options and What They Actually Cost
When you create an inbound shipment in Seller Central, Amazon gives you several options for how your inventory will be distributed across its fulfillment network:
Amazon-Optimized Splits: Amazon determines which fulfillment centers receive your inventory and routes it automatically for optimal placement across the network. The inbound placement fee for this option is $0.00 per unit. In exchange, you’ll be sending inventory to multiple destinations — which means more freight legs on your end.
Partial Splits (2–3 FCs): You ship to a smaller number of fulfillment center destinations. The fee runs approximately $0.27–$1.58 per unit depending on size tier and the specific split arrangement.
Minimal Splits (1 FC): You ship everything to a single fulfillment center. Convenient from a freight coordination standpoint, but the fee now runs $0.42 per unit for standard-size items and climbs to $2.00–$3.00+ for bulky or oversize products.
The Real Freight Cost Comparison
The common objection to Amazon-optimized splits is that splitting shipments to multiple fulfillment centers increases freight cost, offsetting the fee savings. This is sometimes true — but rarely by as much as sellers assume, and it depends heavily on your freight carrier, shipment size, and origin.
For sellers using small parcel shipments (UPS, FedEx, USPS), splitting into 3–4 destinations typically adds $0.05–$0.15 per unit in additional freight costs. Against a $0.42 minimal split fee, that’s a net saving of $0.27–$0.37 per unit. On a 1,000-unit shipment, that’s $270–$370 recovered on a single inbound — every time you ship.
For LTL (less-than-truckload) shippers, the math is more nuanced: splitting a pallet shipment across multiple FCs involves separate pickup/delivery legs. In these cases, sellers sometimes find a single FC shipment is cheaper all-in. The right answer depends on your specific freight rates. The key point is to run the math each time rather than defaulting to minimal split out of habit.
Practical Implementation
Sellers who’ve restructured their inbound strategy around Amazon-optimized splits consistently report saving $0.20–$0.40 per unit on standard-size products — and that’s a direct, repeatable P&L improvement that requires no product changes, no pricing changes, and no negotiation. It’s a process change, and it compounds with every shipment you send. On a catalog generating 10,000 inbound units per month, that’s a potential annual saving of $24,000–$48,000 at those rates.
Pack Size Engineering — How Changing Units Per Pack Shifts Your Fee Tier
Pack size engineering is one of the most underutilized P&L levers available to Amazon sellers, and it’s particularly powerful in the 2026 fee environment because FBA fulfillment fees are charged per unit fulfilled — meaning how you define a “unit” directly affects your fee load per dollar of revenue.
The Fee Tier Mechanics
Amazon calculates FBA fees based on the dimensional weight and actual weight of each individual unit as it arrives at the fulfillment center. The fee schedule moves through size tiers (small standard, large standard, small oversize, etc.), with substantial jumps between tiers. A product that weighs 15 oz in single-unit packaging might sit near the boundary between small standard ($3.06–$3.31) and large standard ($4.75+) — a difference of $1.44+ per unit shipped.
Now consider selling that same product as a 2-pack or 3-pack. The combined package weighs more and is larger, which may push it into a higher tier — but if the tier jump is less than the referral fee and fulfillment fee savings per dollar of additional revenue, the multipack is more efficient. The key calculation:
Effective FBA Fee Rate = FBA Fee ÷ Sale Price
Single unit at $15: FBA fee $3.31 = 22.1% of revenue consumed by FBA alone.
2-pack at $27 (slight bundle discount): FBA fee $4.50 = 16.7% of revenue consumed by FBA.
Net FBA fee efficiency gain: 5.4 percentage points per sale.
Bundling for Higher AOV, Lower Fee Intensity
Multi-unit bundles and complementary product bundles serve a dual purpose in 2026. First, they increase average order value, which dilutes the percentage impact of fixed fees (like the inbound placement fee) across a larger revenue base. Second, they often shift products into a more favorable referral fee tier — Amazon’s referral fee percentages are flat percentages, but higher-priced items in certain categories see stepped reductions at specific price thresholds.
For example, in Baby Products, the referral fee is 8% on items under $10 and 15% on items over $10. A product that sells individually for $9.50 carries an 8% referral fee, but selling it as a 3-pack at $28 triggers the 15% rate — making the multipack less efficient from a referral fee standpoint, even though the FBA fee per dollar of revenue drops. The category fee schedule matters enormously when modeling pack size changes, and every scenario needs to be modeled explicitly before a packaging change is made.
When Pack Size Engineering Backfires
The risks in pack size changes are real. A higher-priced multipack typically has a lower conversion rate than the same product sold individually — price-sensitive buyers are filtered out, and you may win fewer Buy Box competitions at the initial listing launch. Returns can also be more complicated: a customer returning a 3-pack creates more inventory processing complexity than a single-unit return. And if your multipack moves you into a higher size tier without sufficient revenue uplift, you’ve increased your fee load without the compensating benefit.
The rule of thumb: model the scenario first, test with limited inventory, and don’t roll out pack size changes across your entire catalog simultaneously. Run parallel SKUs for 30–60 days to compare real-world performance before sunsetting the old format.
Advertising Costs Are the Silent Margin Killer
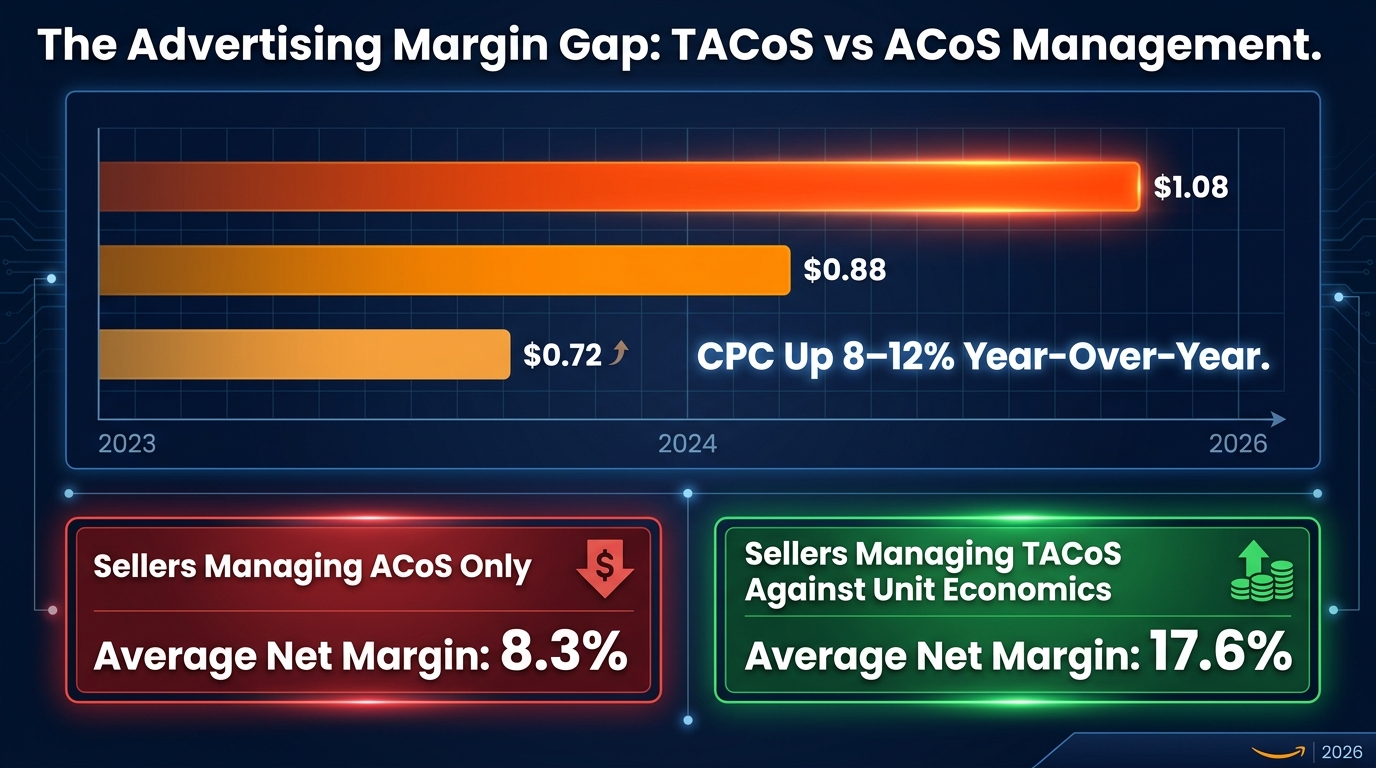
Amazon’s fee changes get the headlines. Advertising is where the real margin is disappearing for most sellers — quietly, one click at a time.
Average CPCs have climbed from roughly $0.72 in 2023 to the current $0.95–$1.25 range in 2026 — an increase of 32–74% over three years. Average ACoS across the platform is approaching 30% for competitive categories. For sellers who are still managing campaigns primarily against ACoS targets — rather than against contribution margin and TACoS — this environment is bleeding them dry without an obvious P&L line to blame.
The ACoS vs. TACoS Problem
ACoS (Advertising Cost of Sale) measures ad spend against attributed revenue — the sales Amazon’s attribution system credits to your ads. It’s a useful campaign-level metric, but it has a critical flaw: it doesn’t account for organic sales that occur alongside your paid activity, and it ignores the full fee stack that determines whether those attributed sales are actually profitable.
TACoS (Total Advertising Cost of Sale) measures ad spend against total revenue — attributed plus organic. This is the metric that connects your advertising investment to your overall business performance. A seller running a 28% ACoS might feel their campaigns are performing reasonably. If their organic sales are minimal, their TACoS is also near 28%. But if they have strong organic velocity, that same 28% ACoS might represent a 10% TACoS — a very healthy position.
The problem is that most sellers don’t know their TACoS by SKU, let alone how it interacts with their full CM2 calculation. They’re flying on partial instruments, and in 2026’s fee environment, partial instruments aren’t enough.
Setting Margin-Based Bid Caps
The correct approach to advertising management in 2026 starts with your SKU-level P&L, not your campaign dashboard. For each ASIN, calculate:
- Maximum allowable ad spend per sale = CM1 minus your target CM2
- Break-even ACoS = Maximum allowable ad spend ÷ Sale price × 100
- Target TACoS ceiling = Maximum allowable ad spend ÷ Total revenue (including organic) × 100
These numbers become your bid cap framework. Any campaign, keyword, or ad group consistently spending above break-even ACoS is destroying margin. Any campaign spending significantly below break-even might be under-investing in velocity. The goal is not to minimize ACoS — it’s to keep every keyword’s conversion economics above the break-even threshold while maximizing reach within that constraint.
Structural Waste in Amazon Campaigns
Beyond bid-level discipline, most sellers have significant structural waste in their campaign architecture. Auto campaigns that haven’t been harvested for negative keywords in months are clicking on irrelevant search terms at full bid rates. Broad match campaigns are serving ads to searches with zero purchase intent. Product targeting campaigns are bidding on competitor ASINs with worse conversion rates but the same CPC as the seller’s own brand terms.
A quarterly campaign audit — not just a bid adjustment, but a full structural review of match types, targeting logic, and negative keyword lists — typically reveals 15–25% of ad spend that can be redirected to higher-performing placements or simply recovered as margin. On a $20,000/month ad budget, that’s $3,000–$5,000/month in recovered spend without touching a single bid.
SKU Triage: Scale, Fix, or Kill
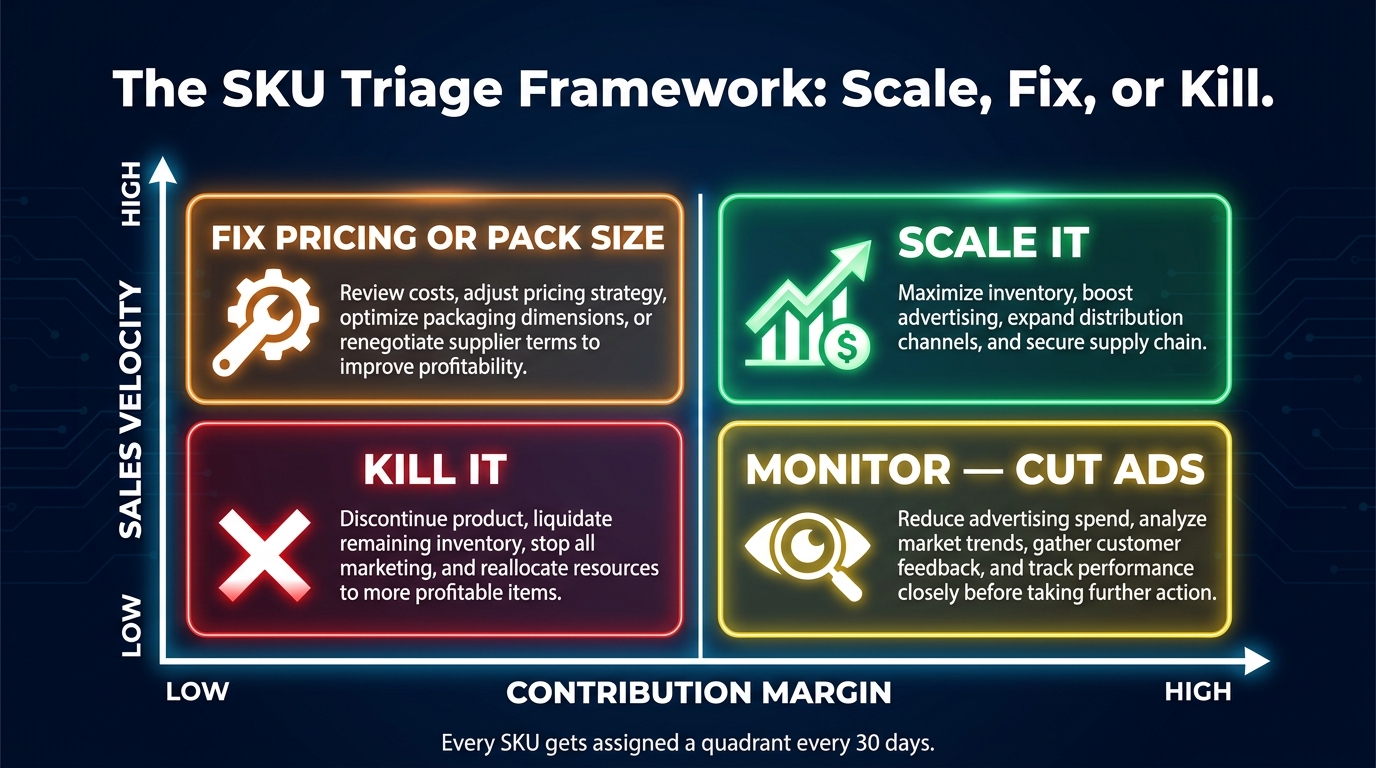
Once you have SKU-level P&L data in hand, the next step is applying a systematic triage framework to your entire catalog. Not every product deserves the same response to margin pressure, and treating your catalog uniformly — either by applying blanket price increases or cutting advertising across the board — typically creates more problems than it solves.
The Four-Quadrant Sort
Sort every SKU in your catalog using two axes: contribution margin (CM2) and sales velocity (units sold per day, trailing 30 days). The resulting four quadrants each call for a different response:
High Margin + High Velocity — Scale It: These are your winners. They’re generating strong CM2 and moving meaningful volume. In 2026’s margin-compressed environment, this quadrant deserves more investment: more advertising, more inventory, potentially bundling into higher-AOV configurations, and proactive competitive defense. Don’t take your winners for granted.
Low Margin + High Velocity — Fix It: These SKUs are doing a lot of revenue work but aren’t generating proportional profit. The fix could be a price increase (test incrementally — even $1–2 can dramatically change CM2 on a $15–20 item), a pack size restructure to improve fee efficiency, a sourcing renegotiation to reduce COGS, or an advertising pull-back to lower TACoS. These are your highest-priority operational projects. Fix them before scaling them.
High Margin + Low Velocity — Monitor and Investigate: These SKUs are profitable when they sell, but they’re not moving. The question is whether low velocity is a fixable problem (better listing content, more aggressive advertising, better category fit) or structural (the market is small and you’re capturing your fair share of it). Don’t kill these — but don’t over-invest in them either until you understand why velocity is low.
Low Margin + Low Velocity — Kill It: These SKUs are consuming cash, storage capacity, working capital, and management attention without generating meaningful profit or revenue. In 2026, the opportunity cost of keeping these alive is higher than most sellers realize. Every unit of slow-moving, thin-margin inventory you’re storing is occupying a fulfillment center slot that costs you monthly and risks triggering the aged inventory surcharge. Liquidate, remove, or discontinue these — and do it faster than feels comfortable.
Running the Triage Every 30 Days
SKU triage is not a one-time exercise. Product economics change: CPCs shift, competitors enter or exit, demand seasonality moves velocity, and your own supply chain changes can affect COGS. The sellers who maintain SKU-level P&L visibility on a monthly refresh are the ones who catch margin problems early — before a negative CM2 SKU has been running hot for six months and consuming thousands of dollars in invisible losses.
Build this into your operations calendar: on the first or second week of each month, refresh your SKU-level P&L with the previous month’s actuals, re-sort the triage matrix, and adjust your advertising and inventory decisions accordingly.
FBM as a Strategic Lever — Not a Last Resort
Fulfilled by Merchant (FBM) has a reputation problem. Most Amazon sellers view it as a fallback option — what you do when FBA inventory runs out, when you get suspended from FBA, or when a product is deemed hazmat and can’t be stored in Amazon’s network. In 2026’s fee environment, that framing is costing sellers money.
The Cases Where FBM Actually Wins
FBM isn’t better than FBA in most situations — Amazon’s fulfillment infrastructure is genuinely hard to beat on speed, customer trust, and Prime eligibility. But there are specific SKU profiles where FBM generates better economics:
Heavy or bulky items with poor FBA fee-to-price ratios: An item that sells for $45 but weighs 12 lbs in a large oversize configuration might carry FBA fees of $25–$30+ per unit — nearly 60% of revenue before referral fees. If you can self-ship this item for $8–12 using your own carrier rates, FBM dramatically improves the margin, even accounting for the operational overhead and customer service burden.
Slow-moving inventory at risk of aged inventory surcharges: For products with unpredictable demand, keeping a portion of inventory in your own warehouse (or a 3PL) and fulfilling FBM while sending a conservative amount to FBA eliminates the aged inventory risk on your tail stock. You pay for your own storage rather than Amazon’s escalating surcharges, and you maintain control over when (and whether) to liquidate.
B2B and high-AOV orders: Large-volume, high-AOV orders from business customers — particularly through Amazon Business — can often be fulfilled more profitably via FBM when the order size makes Amazon’s per-unit fulfillment fee disproportionate. A single business order of 50 units shipped directly from your warehouse avoids 50× the FBA fee.
The Hybrid FBA/FBM Strategy
The most sophisticated approach isn’t choosing FBA or FBM — it’s running both in parallel on the same ASIN, with FBM as a secondary fulfillment option that captures orders when FBA inventory is depleted, during peak demand periods when your FBA stock runs thin (and the low-inventory fee kicks in), or as an explicit test to compare per-unit economics. Many sellers find that maintaining an FBM listing on their borderline-margin SKUs gives them a data-driven way to evaluate whether the FBA fee load is actually justified by the Prime conversion lift — and the answer is sometimes no.
Cash Flow Timing and Fee Accrual — What Most Sellers Underestimate
There’s a dimension of the fee spike problem that goes beyond per-unit economics: cash flow timing. Amazon’s fee structure involves several charges with delayed billing cycles, and sellers who manage their P&L on a cash-received basis rather than an accrual basis are routinely blindsided by the gap between what they think they’re paying and what Amazon actually charges them.
The Delayed Fee Problem
Returns processing fees, for example, are billed in the third month following the return event. A high-return month in January doesn’t show up as a fee charge until March. For a seller monitoring their P&L monthly on a simple revenue-minus-fees basis, that March charge looks anomalous — and unless they’ve been accruing for it correctly, it represents an unexpected cash outflow.
Aged inventory surcharges have a similar dynamic. The charge for inventory that ages past 181 days is assessed in the month the inventory crosses the threshold, but the decision to send that inventory to Amazon was made months earlier. If your P&L doesn’t include a forward-looking aged inventory provision, you’re understating future liabilities every time you send a speculative restock.
The Working Capital Squeeze
Amazon’s payment disbursement cycle (typically every 14 days for established sellers) creates a structural lag between when you sell goods and when you receive the proceeds. In a rising-fee environment, this lag means you’re often selling at higher effective costs than your current P&L shows — because the fee charges for those sales haven’t fully settled yet when you check your balance.
Sellers who are growing rapidly face this problem acutely: more sales means more capital tied up in inventory, more fee accruals in flight, and more working capital needed to fund the next production run before the proceeds from the last one have arrived. The faster you grow, the more the cash flow timing problem compounds.
Building an Accrual-Based Fee Tracker
The solution is an accrual-based fee model alongside your standard P&L. For every category of delayed fee (returns processing, aged inventory, settlement holdbacks), maintain a rolling provision based on historical actuals and current inventory exposure. Update this monthly. When a large fee charge lands unexpectedly, the provision has already recognized the cost — so your actual cash balance, while lower, doesn’t represent a surprise P&L event. It’s already been accounted for.
This sounds like an accounting exercise, and it is — but for Amazon sellers in 2026, it’s also a survival tool. Sellers who don’t have this visibility are making pricing, advertising, and inventory decisions on inaccurate margin data. The downstream consequences of that range from under-pricing products to over-investing in advertising to stocking inventory at volumes that create future aged inventory exposure.
The 90-Day P&L Rebuild Action Plan
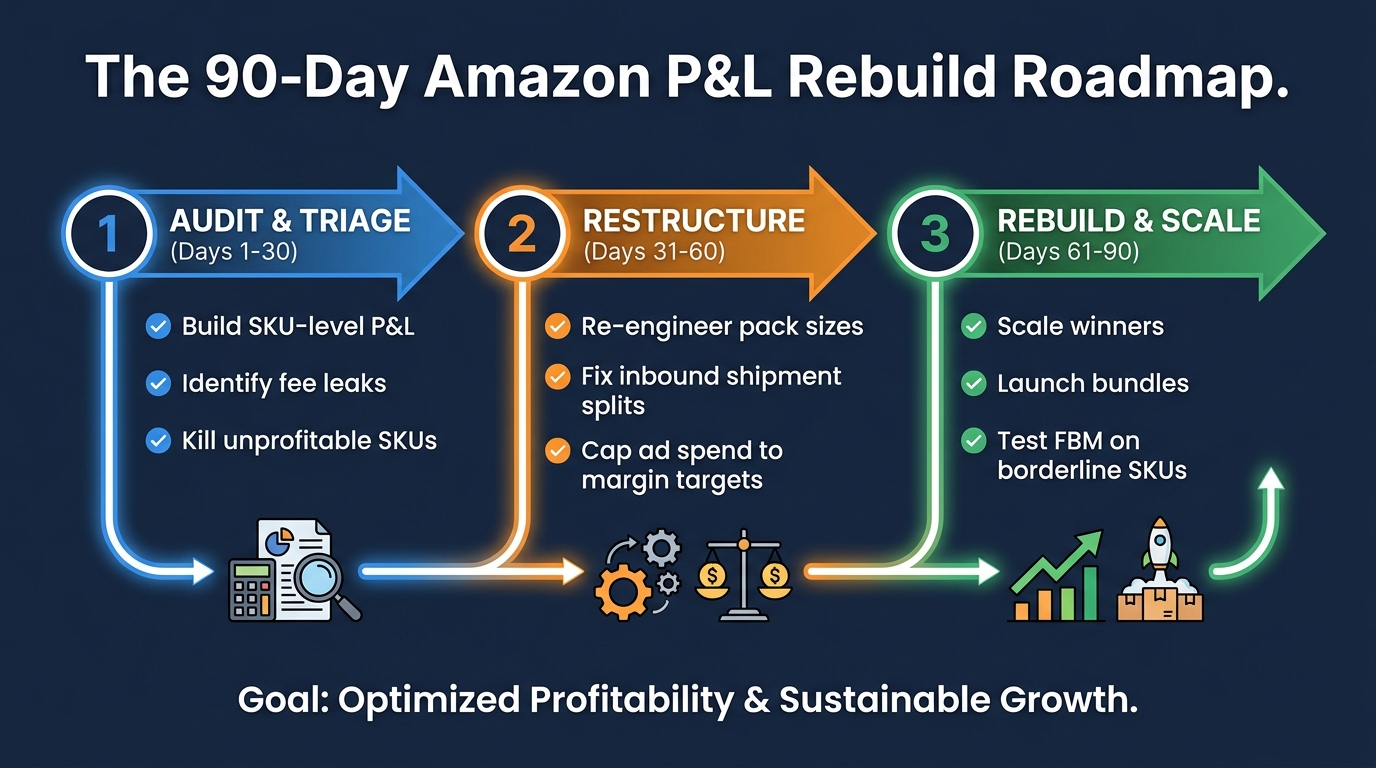
Everything above describes what to understand and why it matters. Here’s how to actually execute a P&L rebuild in a compressed 90-day window — the sequence that moves fastest from diagnosis to recovered margin.
Days 1–30: Audit and Triage
The first 30 days are entirely diagnostic. The goal is to get to a complete, accurate picture of where your margin is and isn’t before taking any action that might make the wrong problem worse.
Week 1 — Build the SKU-level P&L: Pull your last 90 days of transaction data from Seller Central. Build or update your SKU-level contribution margin spreadsheet with all fee components explicitly modeled: referral fee, FBA fee, storage (allocated by cubic footage and days held), inbound placement, returns provision, COGS, and advertising spend. Every ASIN needs its own CM1 and CM2 figure.
Week 2 — Fee audit: Pull your Settlement Reports from the last six months and look for fee categories you haven’t been explicitly tracking. Check your low-inventory fee charges by FNSKU. Check your inbound placement fee charges by shipment. Check your returns processing fee accrual against your actual return data. Calculate what these fees have cost you in aggregate — not in your P&L model, but in actual dollars deducted from your settlements. The delta between what you modeled and what Amazon actually charged is your fee visibility gap.
Week 3 — SKU triage: Apply the four-quadrant sort. List every ASIN in one of four buckets: Scale, Fix, Monitor, or Kill. Assign a specific action item and owner to each Fix and Kill SKU. For Kill SKUs, initiate removal or liquidation orders immediately — the aged inventory clock is running.
Week 4 — Advertising audit: Run a full structural review of your campaign portfolio. Identify campaigns spending above break-even ACoS by ASIN. Pull your search term report and identify the top 20 negative keyword opportunities across your auto and broad campaigns. Calculate your actual TACoS by ASIN using total revenue, not just attributed revenue.
Days 31–60: Restructure
With the audit complete, the second 30 days are about implementing targeted changes to the highest-impact variables identified in phase one.
Inbound shipment restructuring: Switch to Amazon-optimized splits on your next inbound shipment for every SKU where the freight cost comparison supports it. Track the per-unit placement fee savings and compare against incremental freight costs for the first two shipments to establish your actual savings rate.
Inventory replenishment cadence: For any SKU that triggered the low-inventory-level fee in the audit period, recalibrate your reorder point and reorder quantity to maintain a 35–45 day supply at all times. Set FNSKU-level alerts in your inventory management tool for any variant approaching 35 days of supply.
Pack size testing: For your top three Fix SKUs where the CM1 analysis shows pack size change could improve fee efficiency, create new bundle or multipack ASINs and send initial test inventory of 50–100 units. Run both the original and new format simultaneously to collect real-world conversion data before making a full transition.
Advertising restructuring: Implement the margin-based bid caps calculated in phase one. Pause or reduce bids on keywords and product targets consistently spending above break-even ACoS. Add the top 20 negative keywords identified in the search term audit. Do not cut overall budget yet — reallocate it to better-performing placements.
Price adjustments on Fix SKUs: For SKUs with CM2 below 10%, test a $1–3 price increase using a controlled rollout. Monitor conversion rate, velocity, and Buy Box percentage for two weeks before committing. Price elasticity on Amazon is often more favorable than sellers expect — particularly for products with strong review profiles.
Days 61–90: Rebuild and Scale
The final 30 days shift focus from cost reduction to intelligent reinvestment. By this point, the triage and restructuring work should have freed up meaningful margin. The question is where to deploy it.
Scale your winners: Increase advertising investment on high-CM2, high-velocity SKUs. These are the products that can generate incremental revenue profitably — every additional dollar of ad spend here has positive expected value. Increase your restock quantities on these ASINs to ensure you never hit the low-inventory threshold.
Evaluate bundle and multipack results: With 30–45 days of data on your pack size tests, compare CM2 between the original and new format. Scale the winner, phase out the loser. For successful bundle tests, consider adding complementary product bundles (different item types packaged together) on your strongest category SKUs.
Review Kill SKU outcomes: Check the removal or liquidation progress on discontinued SKUs. Ensure aged inventory is being processed. Redirect the working capital recovered from discontinued SKUs into inventory for your Scale quadrant products.
Set ongoing monitoring cadence: Establish the monthly operating routine that maintains the gains from the 90-day rebuild: monthly SKU-level P&L refresh, quarterly campaign structural audit, FNSKU-level inventory alert system, and a 30-day rolling review of inbound placement fee performance.
The Margin Mindset Shift That Makes Everything Else Work
There’s a deeper pattern in sellers who successfully navigate fee environments like 2026’s, and it’s not about finding a single clever tactic that others have missed. It’s about a fundamental shift in how they measure success.
Revenue-first sellers optimize for top line. They want more orders, more units, more sales rank. They measure performance in revenue growth and unit volume, and they make advertising, inventory, and pricing decisions in service of those metrics. In a low-cost, rapidly growing Amazon environment, this approach works — rising tide lifts most boats.
In a margin-compressed, cost-escalating environment, it fails systematically. Revenue growth financed by thin or negative CM2 is not growth — it’s an accelerating cash drain with a revenue label on it. The more units you sell at negative CM2, the faster you lose money.
Margin-first sellers think differently. Every decision — what products to source, what price to set, what to spend on advertising, how many units to send to FBA — runs through a contribution margin filter first. Revenue is a downstream consequence of selling profitable products at sustainable volumes. It’s a means, not the end.
The practical implication: in 2026, your single most important metric is not your total revenue or your account-level profit percentage. It’s your weighted average CM2 across your active catalog — the aggregate picture of how much genuine profit you’re generating per dollar of revenue, after every cost that actually depletes cash. That number should be going up every quarter, regardless of what Amazon’s fee schedule does next. When it is, you have a business that can absorb the next fee change without a crisis. When it isn’t, every fee announcement is an emergency.
Conclusion: The Rebuild Is a System, Not a One-Time Fix
Amazon’s 2026 fee environment is genuinely more challenging than it was three years ago — not because any single fee has become outrageous, but because the simultaneous tightening of multiple parameters has compressed the margin window that most catalog-style FBA businesses were built to operate within.
The sellers who come out of this period stronger are not the ones who found a clever workaround or avoided the fees through some structural accident. They’re the ones who used the fee pressure as a forcing function to build the financial discipline they should have had from the start: SKU-level P&L visibility, systematic triage, fee-aware operational decisions, and advertising managed against real economics rather than platform metrics.
The 90-day plan outlined above is a starting point, not an endpoint. The specifics of your catalog — which SKUs fall into which quadrant, which fee category is your biggest exposure, which pack size changes make sense — require your own data. But the framework holds across categories, business sizes, and sourcing models: audit with precision, triage without sentiment, restructure the high-impact variables, and scale only what you can prove is profitable.
Amazon will announce fee changes again. CPCs will continue to fluctuate. The sellers who’ve built margin-first operations will absorb those changes as operational adjustments. The ones who haven’t will keep treating each announcement as a crisis. The rebuild isn’t about surviving 2026’s fees — it’s about building an operation that doesn’t need to panic when fees change, because the math is tight enough to withstand the movement.
Start with your SKU-level P&L. Build the model this week. The rest follows from what you find there.