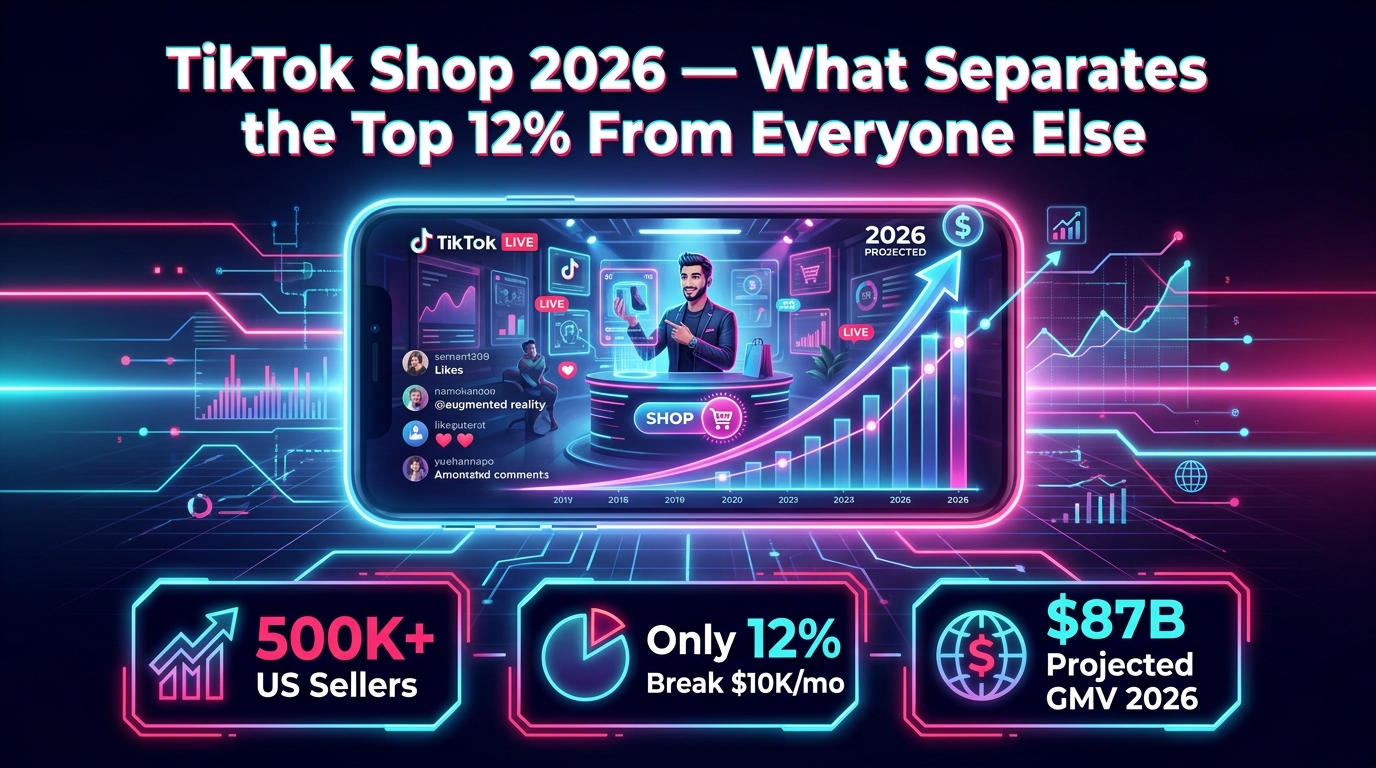
TikTok Shop crossed 500,000 active US sellers in 2026. That number sounds like an opportunity. Look closer and it starts to feel more like a warning.
Of those half a million sellers, only 12% consistently generate more than $10,000 per month in revenue. The median seller earns $1,150 per month. The top 1% — roughly 5,000 accounts — capture 22% of all US GMV, each averaging $215,000 monthly. That is a 180-fold gap between the median and the top.
These are not the statistics of a rising tide lifting all boats. They are the statistics of a platform that has matured into a winner-take-most marketplace, one where platform mechanics, operational discipline, and creator economics have become the actual levers of success — not just having a good product or getting lucky with a viral video.
This piece is not about the basics of setting up a TikTok Shop or finding trending products. Those topics have been covered extensively elsewhere. Instead, this is a data-driven look at the specific structural advantages that top-performing sellers have built — and why most sellers plateau without them. We will cover LIVE commerce performance gaps, the mechanics of affiliate management at scale, category dynamics that are shifting faster than most sellers realize, the fulfillment policy reversals that changed operational strategy in early 2026, the Account Health Rating system that now controls visibility, the paid advertising formats showing the strongest returns, and the retention science behind why 89.7% of purchases come from repeat buyers on top-performing accounts.
If you are building a TikTok Shop business for the long term, here is what the data actually says.
The Power-Law Problem: Understanding Why Most Sellers Plateau
The revenue distribution on TikTok Shop follows what economists call a power law — a small number of players capture a disproportionate share of the total market. This is not unique to TikTok; it appears across most competitive e-commerce platforms. But on TikTok Shop, the concentration is particularly steep, and understanding why it happens is the first step toward escaping it.
The Numbers Behind the Skew
According to data compiled by Dashboardly in Q1 2026, the revenue distribution among US TikTok Shop sellers breaks down as follows: the top 1% of sellers (averaging $215,000 per month) account for 22% of all GMV. The top 10% (averaging $26,500 per month) account for 48% of all GMV. That means the bottom 90% of sellers divide among themselves just 52% of the total market — with a median monthly revenue of $1,150.
New sellers who enter the platform realistically cap their early performance at around $6,800 per month unless they hit a viral product. That ceiling is not arbitrary. It reflects a structural reality: organic reach on TikTok is algorithmically distributed based on engagement signals, not storefront quality. Without a system that generates consistent content, consistent affiliate activity, and consistent live sessions, a seller’s visibility remains bounded by their individual content output.
Why the Gap Keeps Widening
The top 12% are not simply luckier. They operate fundamentally different businesses. Where median sellers post content sporadically and manage a handful of affiliate creators, top performers run systematic creator recruitment programs, host multiple LIVE sessions per week, and allocate paid advertising budgets specifically to amplify proven organic content. Each of these behaviors compounds over time, and each creates a flywheel that widens the performance gap between them and the rest of the field.
The implication for sellers stuck below $10,000 per month is uncomfortable but clear: incremental improvements to product listings or posting frequency will not close the gap. The gap is structural, and closing it requires structural changes to how you operate.
“Top sellers spend approximately $32,000 per month working with 200 or more affiliate creators at an average commission rate between 3.8% and 5.5%. That is not influencer marketing — it is a managed distribution network.” — Dashboardly, Q1 2026 Seller Report
The LIVE Commerce Conversion Gap Nobody Is Talking About Loudly Enough
If there is one performance gap in TikTok Shop that deserves more attention than it receives, it is the conversion rate differential between LIVE shopping and every other format the platform offers.
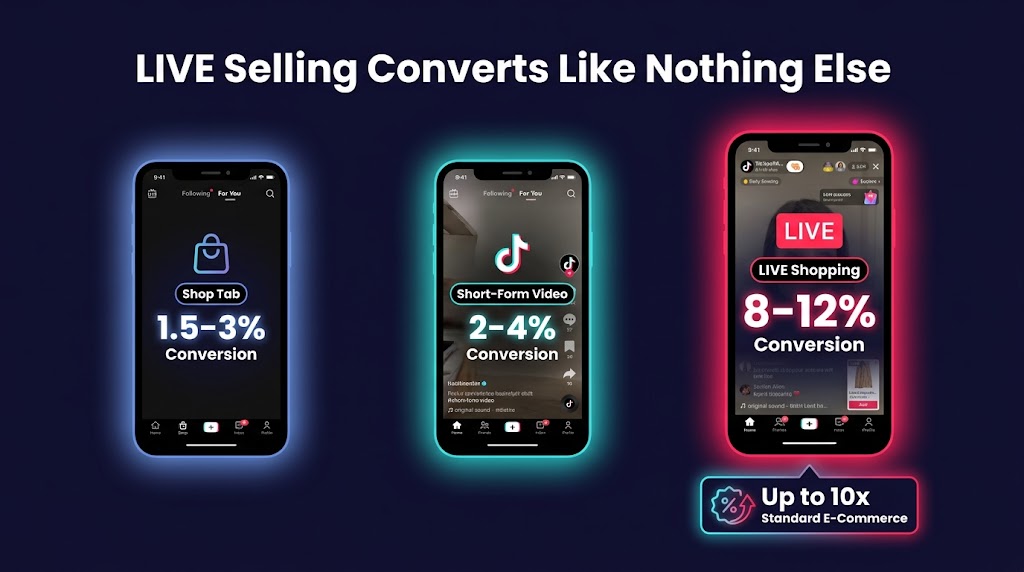
The Conversion Rate Breakdown by Format
Based on 2026 performance data, here is how the three primary TikTok Shop sales formats compare on conversion rate:
- Shop Tab browsing: 1.5–3% conversion rate
- Short-form shoppable video: 2–4% conversion rate
- LIVE shopping sessions: 8–12% conversion rate
That is not a marginal edge. At the upper end, LIVE shopping converts at four times the rate of short-form video and eight times the rate of Shop Tab browsing. Some brands report conversion rates as high as 10 times their standard e-commerce baseline during well-executed LIVE sessions. TikTok’s internal data shows that approximately half of viewers who watch a LIVE shopping session make a purchase during or immediately after the stream.
Despite these numbers, LIVE selling currently accounts for only around 10% of total TikTok Shop sales volume in the US. That gap between the format’s conversion performance and its adoption rate represents one of the clearest opportunities available to sellers in 2026.
What Makes a LIVE Session Actually Convert
The conversion advantage of LIVE shopping is not simply a function of being live. It is a function of specific mechanics that the format enables: real-time product demonstrations, live Q&A that address purchase objections in the moment, time-limited flash deals that create genuine urgency, and the social proof of seeing other viewers purchasing in real time. These elements combine to create a buying environment that short-form video cannot replicate.
Top-performing sellers structure their LIVE sessions deliberately. A typical high-converting session will open with a strong hook in the first 60 seconds, cycle through three to five hero products rather than showcasing their entire catalogue, use countdown timers on flash discounts, and actively solicit questions from viewers to drive comment engagement — which the algorithm reads as a signal to distribute the stream more broadly.
The Frequency Factor
LIVE conversion data also reveals a frequency effect. Sellers who broadcast two to three times per week see significantly higher average session revenue than those who go live once a week or less. This is partly algorithmic — TikTok’s LIVE distribution favors accounts with consistent live activity — and partly about audience conditioning. Regular viewers develop purchase habits around scheduled LIVE events in the same way that cable TV shopping channels built loyal audiences through programming consistency.
For sellers currently generating most of their revenue through short-form video, the data makes a compelling case for investing seriously in LIVE as a second revenue channel. The barrier to entry is real — LIVE selling requires hosting skill, product knowledge, and operational readiness to fulfill sudden spikes in orders — but the conversion premium makes it one of the highest-leverage investments available on the platform.
The Affiliate Pyramid: What Managing Creators at Scale Actually Looks Like
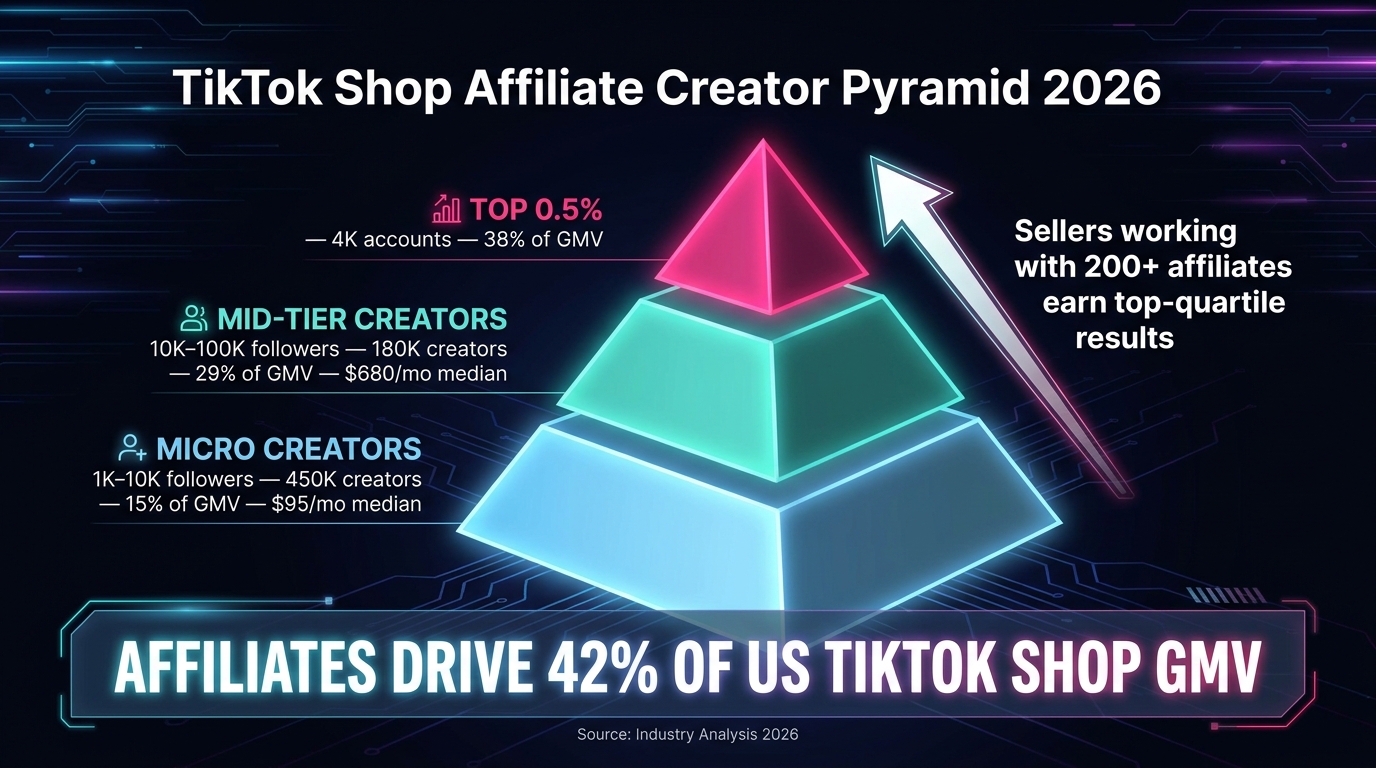
TikTok Shop’s affiliate program has grown to over 2 million registered creators globally, with approximately 800,000 active in the US. Affiliates collectively drive 42% of US GMV — making creator partnerships the single largest sales channel on the platform. Yet how sellers engage with this ecosystem varies enormously, and the approach almost perfectly predicts performance tier.
How the Creator Ecosystem Actually Breaks Down
The affiliate ecosystem has its own power-law structure. According to 2026 data, the top 0.5% of affiliate accounts — roughly 4,000 creators — generate 38% of all affiliate GMV. The picture by tier looks like this:
- Micro-creators (1K–10K followers): ~450,000 US creators, driving 15% of affiliate GMV, with a median monthly affiliate income of $95
- Mid-tier creators (10K–100K followers): ~180,000 US creators, driving 29% of affiliate GMV, with a median monthly income of $680
- Top-tier performers (100K+ followers): A much smaller group commanding the remaining affiliate-driven GMV
Average commissions sit at 15% across the platform, but vary meaningfully by tier and category. Micro-creators in beauty and wellness typically negotiate 18–25% commission rates. Top performers in categories with high competition have been seen demanding 30–50% commissions, particularly in the direct-to-consumer health space.
Why Top Sellers Work With 200+ Creators — and How
The counterintuitive finding from top-seller data is that they do not build their affiliate programs around a small number of big-name creators. Instead, they run what is essentially a managed distribution network with 200 or more active affiliates, the majority of whom fall in the micro-to-mid tier range.
This approach works because of how TikTok’s algorithm responds to volume. When 200 creators each post one piece of content about your product in the same week, the aggregate signal tells the algorithm that the product is generating interest across many different audience segments simultaneously. This broad signal drives discovery in the For You Page in a way that 10 posts from one large creator simply cannot replicate.
Managing 200 affiliates is not a manual task. Top sellers use a combination of TikTok’s Open Collaboration and Targeted Collaboration features to recruit at scale, provide standardized creative briefs and product claim guidelines, automate commission tracking through the Seller Center dashboard, and use performance data to identify which creator profiles convert best for their specific product. Creators who consistently convert get upgraded to Targeted Collaboration with higher commission rates and exclusive deal access. Those who don’t convert get rotated out.
The Free Sample Strategy and Its Risks
Product seeding — sending free samples to creators without requiring guaranteed posts — is a standard practice among top sellers. The economics work when the cost of the sample is low relative to the potential GMV from a viral piece of content. However, it carries risks. TikTok’s new daily posting limits for creators in the Pilot Program (3 videos per day, 3 LIVEs per week for new affiliates) mean that seeded creators have limited slots, and many will deprioritize products that require effort to demonstrate. The most effective seeding programs pair the free product with clear, specific guidance on hook language, demonstration style, and any claims that are compliant under TikTok’s product marketing policies.
Category Dynamics: Where Growth Is Actually Happening in 2026
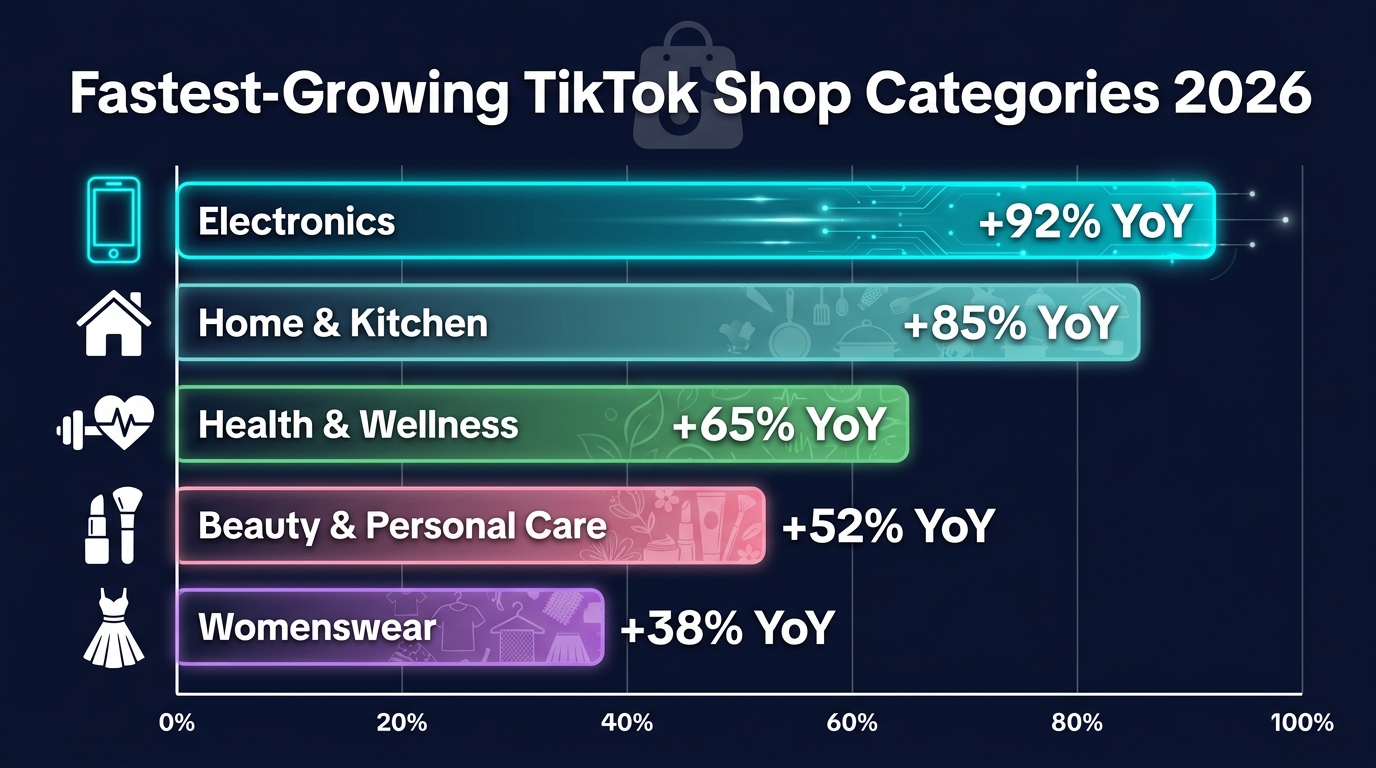
Category selection is one of the most consequential decisions a TikTok Shop seller makes, and the category landscape in 2026 looks significantly different from even twelve months ago. The dominant narrative — that beauty and fashion rule TikTok Shop — is still true in terms of absolute GMV share, but it obscures the growth story happening in other verticals.
The Established Leaders
Beauty and Personal Care still commands the largest share of TikTok Shop GMV globally at 22.5%, with average GMV per seller in the category running around $4,800 per month — a 48% increase year over year. The mechanics driving this category are well understood: #SkinTok transformation content, GRWM (Get Ready With Me) videos, and the enormous appetite for dupes of premium skincare brands all create strong native content formats that convert well.
Womenswear and Underwear holds 12.5% of global GMV, powered by try-on transition videos and seasonal OOTD content. Health and Wellness — protein foods, supplements, functional beverages — has strong performance particularly in the US and Southeast Asia, where creator credibility in the fitness and wellness space drives high-trust purchases.
The Explosive Challengers
The categories showing the most dramatic growth momentum in 2026 are not the traditional TikTok Shop darlings:
- Consumer Electronics: +92% YoY growth, driven by phone accessories, portable chargers, wireless earbuds, and smart home devices. The “curiosity factor” in unboxing and demo content performs exceptionally well algorithmically — viewers genuinely want to see whether products work before buying. This category is capturing the platform’s expanding 25–44 demographic, which has greater disposable income and higher average order values.
- Home and Kitchen: +85% YoY growth, fueled by the “does this actually work?” content format. Products like silicone organizers, multi-use kitchen tools, and space-saving furniture hacks generate high watch-through rates because the utility payoff is visible within seconds. The category benefits from TikTok’s tendency to surface satisfying, practical demonstrations.
- Health and Wellness (beyond supplements): +65% YoY growth, broadening beyond traditional protein powder into sleep aids, stress-relief products, posture correction devices, and at-home diagnostics. The aging of the TikTok user base is a significant driver here.
The Regional Variation Factor
Category performance varies meaningfully by geography for sellers operating across TikTok Shop’s multiple market rollouts. UK buyers skew heavily toward beauty and fast fashion. German buyers show stronger intent in home efficiency and tech products. French TikTok Shop users favor premium beauty and fashion. Italian and Spanish markets show stronger seasonal apparel performance. Sellers with cross-market ambitions need category strategies that account for these regional preferences rather than assuming the US playbook applies everywhere.
Pricing Sweet Spots
Regardless of category, the impulse purchase dynamics of TikTok Shop consistently favor products in the $15–$50 price range. Products below $15 can go viral but often struggle to generate meaningful GMV relative to the creator effort required. Products above $80 face a longer consideration cycle that works against TikTok’s scroll-and-buy model — though high-quality LIVE sessions can bridge this gap through demonstration and social proof. The platform’s average order value of $58 reflects these dynamics, up from $43 in the prior year as the user base matures and premium category adoption grows.
The Fulfillment Flip: What the FBT Mandate Reversal Actually Changed
One of the most significant operational stories of 2026 for TikTok Shop sellers was not a new feature launch or algorithm change — it was a policy reversal. In early 2026, TikTok announced that US sellers would be required to transition from independent shipping to platform-controlled fulfillment through Fulfilled by TikTok (FBT) or approved logistics partners by March 31, 2026. The announcement generated significant merchant backlash, and by late February, TikTok paused the requirement.
Why the Mandate Was Controversial
TikTok’s original reasoning for the FBT mandate was straightforward: standardizing fulfillment would improve delivery times, reduce customer complaints, and increase platform-wide buyer satisfaction metrics. The data supports this rationale. FBT achieves a 96.5% on-time delivery rate with a 2–4 day window, compared to an 88.2% on-time rate for self-fulfilled orders. That 8.3-point gap represents a meaningful difference in customer experience at platform scale.
Sellers’ objections were equally straightforward: mandatory FBT would increase their per-unit costs, reduce their pricing flexibility, and create dependency on TikTok’s warehouse network in ways that felt risky for businesses also operating on Amazon, Shopify, and other channels. Several larger brands pointed out that their existing 3PL relationships and warehouse infrastructure already matched or exceeded FBT’s performance benchmarks. The one-size-fits-all mandate ignored the operational reality of established sellers.
What the Current Situation Means for Operations
As of mid-2026, sellers retain full flexibility to use existing third-party logistics providers, their own warehouse operations, or FBT. However, TikTok has simultaneously introduced stricter fulfillment performance metrics that apply to all sellers regardless of their fulfillment method. These include enforced shipping speed standards, accuracy thresholds, and customer satisfaction scores tied to the new Account Health Rating system (covered in the next section).
The practical implication is this: the FBT mandate may be paused, but the performance pressure it was designed to address has not gone away. Sellers who self-fulfill need to meet benchmark metrics to maintain platform visibility. Those who cannot consistently hit on-time delivery rates above 92% and maintain low cancellation rates should seriously evaluate FBT or a higher-tier 3PL partnership, not because it is mandatory, but because the Account Health consequences of poor fulfillment metrics can be severe.
The Multi-Channel Fulfillment Argument
The sellers most strategically positioned in 2026 are those who have built fulfillment infrastructure that can serve TikTok Shop, Amazon, and their own direct-to-consumer operations without siloed inventory. Multi-channel fulfillment systems that integrate with TikTok’s API and order management flows — through WMS platforms like Shopify or dedicated multi-channel software — allow sellers to manage inventory across channels without maintaining separate stock pools. During viral sales spikes (which on TikTok can produce 10x normal order volume within hours), integrated inventory visibility becomes operationally critical.
The Account Health Rating System: TikTok’s New Enforcement Mechanism
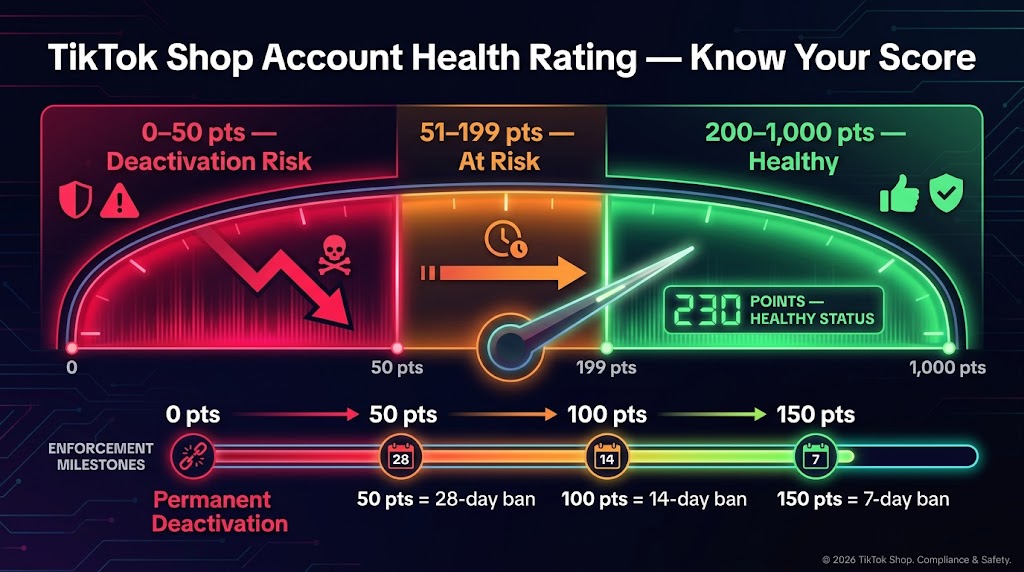
The Account Health Rating (AHR) system replaced TikTok Shop’s previous Milestone-based violation tracking in early 2026, and it represents a fundamental change in how the platform governs seller behavior. Most sellers have not internalized what the system actually does or how aggressively it can impact their operations.
How the Scoring System Works
Every TikTok Shop account starts with a score of 200 points and operates on a 0–1,000 scale tracked over a rolling 180-day window. Scores are modified in two directions:
Points are earned by completing fulfilled orders (4 points per 200 completed orders, capped at 20 points per week) and by passing policy compliance quizzes in TikTok’s Seller University platform. Returns, cancellations, and disputed orders do not count toward points earned.
Points are deducted for policy violations across seven categories: product compliance and safety, listing quality standards, intellectual property infringement, fair trading practices, fulfillment performance, account management, and customer review manipulation. The severity of deductions scales with both the seriousness of the violation and the frequency of repeat offenses.
The Three Zones and What They Mean
The AHR system divides sellers into three operational zones:
- Green Zone (200–1,000 points): Healthy account status. Full access to all platform features, campaigns, and product listings.
- Orange Zone (51–199 points): At-risk status. Sellers in this zone may face restricted access to promotional campaigns and reduced organic distribution. This is the warning zone — recoverable, but requiring immediate corrective action.
- Red Zone (0–50 points): Deactivation risk. Sellers below 50 points face severe operational restrictions.
The Milestone Enforcement Ladder
Beyond the zone thresholds, the AHR system includes four specific enforcement milestones that trigger automatic restrictions:
- 150 points: 7-day ban on creating new product listings and running mega campaigns
- 100 points: 14-day bans on the same activities, with expanded restrictions
- 50 points: 28-day bans, effectively freezing growth activities for nearly a month
- 0 points: Permanent deactivation of the seller account
These milestones are automatic — there is no review period or appeals window before the restrictions engage. A seller who accumulates violations across multiple categories can fall through multiple milestones quickly if they are not actively monitoring their account health dashboard.
The July 2026 Store Rating Update
Alongside the AHR system, TikTok announced updates to the Store Rating mechanism effective July 2026. The Customer Complaint Rate metric is being replaced with a 60-day After-Sales Handling Time (AHT) score, with a target response time below 20 hours. The system is also moving toward category-based benchmarking for Negative Review Rate and Seller-Fault Returns, so performance is assessed against category peers rather than platform-wide averages. For sellers in categories with naturally higher return rates (fashion and apparel, primarily), this is a meaningful protection against unfair scoring.
The practical message for sellers: account health is no longer a secondary concern. In a platform where algorithmic distribution drives discovery, and where AHR violations can restrict your ability to create listings or run campaigns for weeks at a time, maintaining a Green Zone score is as fundamental as inventory management. Treat it accordingly.
The Paid Advertising Shift: GMV Max, Smart+, and What the Performance Data Says
TikTok’s paid advertising ecosystem for Shop sellers has shifted substantially in 2026, with the platform pushing strongly toward automated campaign formats and the performance data increasingly reflecting why.
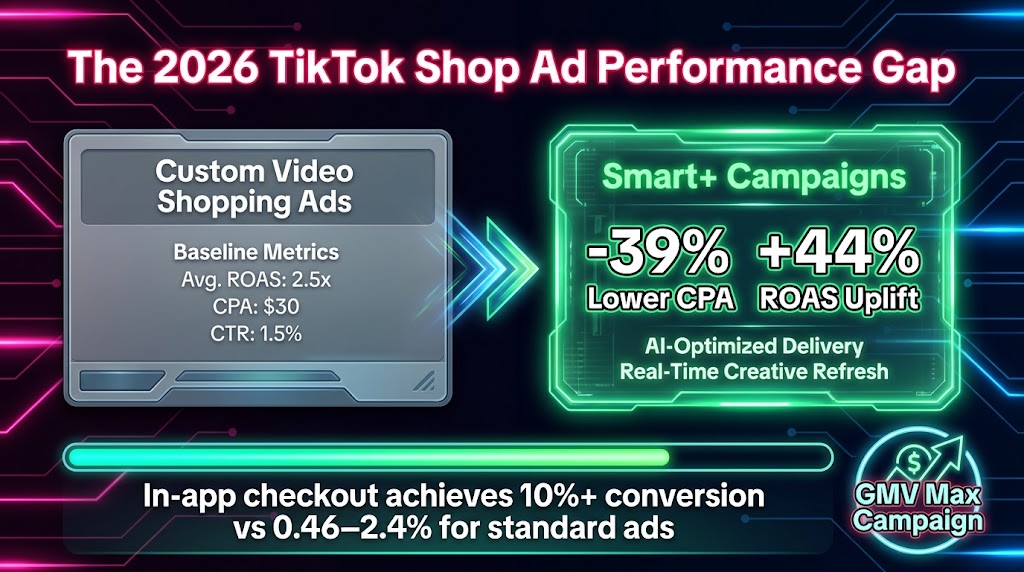
The Three Primary Ad Formats and Their Performance Profiles
Spark Ads remain the most accessible entry point for TikTok Shop advertising. They work by boosting existing organic content — either from your own account or from affiliate creators who have granted usage rights — so the ads appear native to the platform and preserve social proof elements like view counts and comments. Spark Ads carry the lowest CPM ($4–$12) and CPC ($0.17–$1.50) of any TikTok format and require a minimum daily budget of just $20. Their primary limitation is scale — they depend on having strong organic content to boost, which means their performance is upstream of content quality rather than independent of it.
Video Shopping Ads (VSAs) are the mid-tier format designed specifically for driving product page visits and purchases. They integrate directly with the TikTok Shop product catalogue and allow sellers to tag products within the video creative. VSAs perform well for scaling proven products and for retargeting warm audiences, though their CPMs are higher ($6–$15) and they require more active creative management than automated formats.
Smart+ Campaigns and GMV Max represent TikTok’s push toward fully automated campaign management. GMV Max became the platform’s default campaign objective in July 2025, and Smart+ has shown the strongest performance benchmarks of any paid format.
The Smart+ vs. Custom VSA Performance Gap
TikTok’s official advertising playbook data (the most rigorously controlled comparison available) shows Smart+ campaigns achieving a +44% ROAS uplift and a -39% lower cost per acquisition compared to custom Video Shopping Ads across the same campaigns. These are substantial differences that cannot be attributed to testing variance.
The mechanism behind these results is TikTok’s audience optimization algorithm, which in Smart+ mode has full autonomy over audience targeting, bid levels, and creative rotation. The system identifies purchase-intent signals that manual targeting setups consistently miss, particularly at the top of the funnel where interest-based targeting proxies for actual buying behavior.
The limitation of Smart+ is that it requires a sufficient data foundation to optimize against — typically at least 50 purchase events in a rolling 7-day window before the algorithm has enough signal to allocate budget efficiently. New products and new accounts need to build this signal base before Smart+ performs at its documented benchmarks. The standard recommendation is to run manual VSAs at $50–$100 per day to seed the data, then transition to Smart+ once purchase volume threshold is met.
Creative Direction: What Actually Converts in 2026
Across all paid formats, user-generated content and creator-led videos consistently outperform polished brand productions for cold traffic acquisition. Strong hooks drive everything: performance data points to the 0–3 second opening frame as the primary determinant of video completion rate, and completion rate is both the metric TikTok’s algorithm uses to distribute ads and the strongest predictor of downstream purchase behavior.
Optimal creative length for direct-response TikTok Shop ads has converged around 7–15 seconds. Videos in this range achieve higher completion rates, which improve both paid distribution (lower CPMs) and algorithmic organic boosting. Videos over 30 seconds see completion rates drop significantly unless the content category (tutorials, demos) justifies the length through inherent viewer interest.
In-app checkout — available only through TikTok Shop as distinct from link-in-bio redirects — converts at 10% or higher in optimized campaigns, compared to 0.46–2.4% for standard ads that send traffic off-platform. This gap is the core financial argument for keeping the purchase journey entirely within TikTok’s ecosystem rather than driving to external product pages.
The Retention Science Behind 89.7% Repeat Purchase Rates
TikTok Shop is often framed as a platform for customer acquisition — where brands go to find new buyers through viral content and creator reach. That framing misses one of the platform’s most commercially important characteristics. According to Apptopia’s January 2026 loyalty study, 89.7% of purchases on top-performing TikTok Shop accounts come from repeat buyers, who average 6.4 purchases per month and return at a frequency that resembles subscription behavior more than impulse buying.
Why the Platform Generates Strong Repeat Behavior
The mechanics of repeat purchase behavior on TikTok Shop are distinct from other e-commerce platforms. On Amazon, repeat buying is largely driven by convenience — the product is available, Prime shipping is fast, and there is no reason to look elsewhere. On TikTok, repeat buying is driven by content relationship. Buyers return not just to repurchase a product, but to engage with the brand’s ongoing content, follow LIVE sessions they have enjoyed previously, and participate in creator communities that form around certain product niches.
This means that brand-building on TikTok operates differently than on traditional platforms. The content a brand posts after a customer’s first purchase is not just marketing for the next sale — it is the mechanism by which that customer stays connected to the brand and becomes more likely to buy again. Sellers who treat TikTok purely as a traffic channel for first purchases are leaving the retention value entirely on the table.
The Fulfillment-Satisfaction Loop
Repeat purchase rates correlate strongly with fulfillment satisfaction metrics. Dashboardly’s Q1 2026 analysis shows that accounts maintaining FBT-equivalent delivery performance (96%+ on-time, 2–4 day window) see repeat rates significantly above accounts with average fulfillment scores. The causal mechanism is straightforward: fast, reliable delivery is the primary driver of post-purchase satisfaction on any e-commerce platform, and post-purchase satisfaction is the primary predictor of repeat buying behavior.
For TikTok Shop specifically, this loop has an additional layer: customer reviews and star ratings on product listings are visible in the shopping experience and influence both the algorithm’s product ranking and the purchase decisions of new buyers. A strong fulfillment operation does not just retain individual customers — it generates the review volume that improves discoverability for future buyers.
The NielsenIQ Buyer Frequency Finding
NielsenIQ’s 2026 social commerce report (via eMarketer) found that the average TikTok Shop customer makes 3–4 purchases per year and spends approximately $118 annually on the platform. This annual spend figure is still modest compared to the average Amazon Prime member’s annual spend, but it is growing — and critically, it reflects a user base that is expanding beyond TikTok’s historical core demographic. In 2026, approximately 24.9% of US digital buyers have made at least one TikTok Shop purchase, up from 9% of US households who had purchased in 2025. The buyer base is broadening rapidly, and the retention data suggests those new buyers are converting to repeat customers at a high rate when the purchase experience is good.
The $58 AOV Trap: Why Pricing Architecture Matters More Than Product Virality
TikTok Shop’s average order value hit $58 in 2026, up from $43 in the prior year. That $15 increase sounds like positive news for sellers — and for some it is. But it also reveals a common strategic trap that keeps sellers locked into a volume-dependent, low-margin model.
How Sellers Fall Into the Volume Trap
The path-of-least-resistance product strategy on TikTok Shop is to find a trending item in the $15–$30 price range, source it at a low margin, and rely on volume from viral content and affiliate creators to generate revenue. This works until it doesn’t: the product loses trending status, a competitor enters with a lower price or stronger creator partnerships, or platform algorithm changes reduce organic discovery of the product.
The sellers locked in the $1,150 median monthly revenue bracket are disproportionately those running single-product or narrow-catalogue strategies entirely dependent on viral momentum. When the product stops trending, the business stops generating revenue. There is no brand equity, no customer retention base, and no catalogue depth to absorb the traffic loss.
AOV Strategy: Bundles, Upsells, and Offer Stacks
Top sellers systematically engineer higher average order values through several mechanisms. Product bundling — grouping complementary items at a price below the sum of individual components — increases per-transaction revenue while giving buyers a perceived value advantage. TikTok’s Seller Center supports virtual bundle SKUs natively, allowing sellers to create bundle offers without complex back-end inventory management.
Offer stacking is the practice of combining multiple incentive layers — free shipping, a percentage discount, and a bundled add-on item — into a single purchase offer. The aggregate of layered incentives creates a stronger perceived value than any single incentive alone, and the format works particularly well in LIVE sessions where the offer can be presented as a time-limited package exclusive to stream viewers.
Catalogue depth is the structural solution to the viral product dependency problem. Sellers who maintain 15–30 active SKUs in related categories can funnel viral traffic from one product into discovery of complementary items. When a skincare product goes viral, a well-structured catalogue converts those visitors into buyers across toners, serums, and SPF products — increasing both AOV and the probability of repeat purchasing.
The Profitability-First Affiliate Model
A meaningful 2026 shift among top sellers is the move from volume-focused affiliate management to profitability-first affiliate management. This means setting commission structures based on margin by product rather than using a flat rate across the catalogue, and prioritizing creators who drive sales of higher-margin SKUs over those who drive high volume on low-margin products.
The math is simple but often ignored: a 20% commission on a $25 product costs $5. The same 20% commission on a $60 product costs $12 but generates a higher absolute margin if the product carries a 60% gross margin. Sellers who calibrate commission rates to product-level economics rather than category averages consistently outperform those who manage affiliates with flat rate structures across their entire catalogue.
Building for the Long Game: Why Systems Beat Spikes
The defining characteristic of TikTok Shop sellers who sustain performance above the $10,000 per month threshold is not access to better products or more talented creators. It is the presence of systems — repeatable operational processes that generate consistent output regardless of whether any individual piece of content or any individual LIVE session happens to go viral.
The Content Machine vs. the Content Moment
A viral video is an event. A content machine is a system. The distinction matters because TikTok’s algorithm rewards consistency as much as it rewards peak performance. An account that posts three to five pieces of shoppable content per week for twelve consecutive weeks accumulates algorithmic equity — a history of engagement signals that the platform uses to distribute future content more broadly. An account that posts ten pieces of content in a single week and then goes quiet loses that equity rapidly.
Top-performing seller accounts in 2026 treat content production like manufacturing rather than creative inspiration. They maintain a bank of 30 or more evergreen product demonstration scripts, rotate through creator types (educational demos, lifestyle integration, comparison reviews, customer testimonials), and schedule content publication around peak engagement windows rather than posting whenever content is ready. The content itself may not be exceptional in any individual instance — but the consistency creates a distribution flywheel that sporadic excellence cannot match.
The Creator Relationship Infrastructure
Sustainable affiliate performance requires more than recruiting creators — it requires maintaining relationships with the 15–20% of recruited affiliates who consistently convert. Top sellers build this relationship infrastructure through tiered program structures: open commission rates for new affiliates, elevated rates and exclusive product access for proven performers, and dedicated account management relationships with their top five to ten creators.
The practical tools are built into TikTok’s Seller Center: Targeted Collaboration allows sellers to invite specific creators to promote products at custom commission rates, while Affiliate Campaign management provides performance tracking at the individual creator level. Sellers who use these tools to identify and reward their best performers — rather than treating all affiliates as interchangeable — see dramatically lower affiliate churn and higher GMV per active creator over time.
Compliance as Infrastructure, Not Overhead
The Account Health Rating system has effectively reclassified compliance from an administrative burden into a core operational function. Sellers who maintain dedicated compliance monitoring — reviewing listing quality standards, checking product claim language against TikTok’s category-specific guidelines, auditing affiliate content for policy adherence — are building a form of operational infrastructure that protects their visibility and campaign access on an ongoing basis.
The sellers who treat compliance reactively — responding to violations after they occur — are perpetually at risk of falling below enforcement milestones at the worst possible time: a product launch, a high-traffic seasonal event, or a scheduled LIVE session. Proactive compliance monitoring, combined with regular participation in TikTok Seller University quizzes (which directly improve AHR scores), is one of the lowest-cost, highest-leverage investments available on the platform.
Data Infrastructure for a Maturing Platform
TikTok Shop in 2026 is generating significantly more actionable seller data than it did in its earlier growth phase. The Seller Center dashboard now surfaces category-level benchmarking, product-level conversion attribution, creator performance data, and customer cohort analysis. Sellers who build regular data review cadences — weekly at minimum — into their operational routine make materially better decisions on product selection, creator investment, pricing adjustments, and advertising allocation than those who operate primarily on intuition or anecdote.
The platform is becoming complex enough that decisions made without reference to your own performance data — rather than general platform trends — are increasingly likely to be wrong. What works in beauty at the $25 price point may not transfer to electronics at the $55 price point, even within the same seller’s account. Data discipline is no longer optional infrastructure for serious sellers.
The Path Forward: What the Next Twelve Months Likely Bring
Several structural trends in TikTok Shop’s 2026 trajectory point toward where the platform is heading and what sellers need to prepare for.
LIVE commerce adoption will accelerate. The 8–12% conversion rate advantage of LIVE formats is too significant for TikTok to ignore in its seller development programs, and the platform has consistently rolled out features (LIVE flash sales, LIVE-exclusive bundle creation, scheduled LIVE discovery placements) that push sellers toward the format. Sellers who develop LIVE selling competency now will hold a meaningful advantage as the format becomes standard rather than exceptional.
The fulfillment standards floor will rise. The FBT mandate may be paused, but the underlying direction is clear. TikTok wants platform-wide delivery standards that compete with Amazon Prime’s expectations. Whether through mandatory FBT adoption, stricter AHR-linked performance requirements, or both, sellers with weak fulfillment operations face increasing pressure. Building fulfillment infrastructure now — either through FBT adoption or through a 3PL relationship that demonstrably exceeds the platform benchmarks — is risk management as much as performance optimization.
The demographic expansion creates category opportunities. As TikTok Shop’s user base ages upward and broadens economically, categories that struggled with the platform’s historically young, price-sensitive audience are becoming viable. Home and living, consumer electronics, higher-end wellness products, and categories requiring considered purchase decisions are all seeing growth rates that significantly outpace the platform average. Sellers who entered TikTok Shop exclusively through beauty or fast fashion should be evaluating whether adjacent or complementary categories in these growth verticals represent expansion opportunities.
The creator economy will mature toward professionalization. The new daily posting limits for affiliate creators, combined with the Star Shop+ reward structures for top performers, signal TikTok’s intention to improve content quality per post rather than simply maximize posting volume. As the creator program matures, the value will shift from managing the largest possible number of affiliates toward identifying and investing in the subset who combine audience quality, content skill, and category credibility. The quantity strategy for affiliate management has a ceiling; the quality strategy has compound returns.
Conclusion: What the Data Is Actually Telling You
The 180-fold revenue gap between TikTok Shop’s median seller and its top performers is not a reflection of product quality, market timing, or luck. It is the outcome of structural differences in how sellers operate: how consistently they show up with LIVE content, how systematically they manage creator relationships, how proactively they protect their account health, how deliberately they engineer higher average order values, and how rigorously they use platform data to make decisions.
The good news is that none of these structural advantages require resources available only to large brands or well-funded operations. The sellers running $200,000+ per month shops started at the same median as everyone else. What separated them was not a single breakthrough moment — it was the accumulation of operational decisions that compounded over time into a durable distribution advantage.
The actionable takeaways from the 2026 data are clear:
- Invest in LIVE selling — the conversion rate premium (8–12% vs. 2–4%) is the single most underexploited edge available to mid-tier sellers
- Build for 100+ affiliates, not 10 — the GMV contribution of broad micro-creator networks outperforms concentrated reliance on a few large accounts
- Monitor your Account Health Rating weekly — enforcement milestones can restrict your operations for weeks; prevention is far cheaper than recovery
- Engineer AOV through bundles and offer stacks — the viral product model is fragile; catalogue depth and pricing architecture create resilience
- Transition to Smart+ when you have sufficient purchase data — the +44% ROAS uplift is too significant to ignore once your account can support automated optimization
- Treat content as a manufacturing system — consistency of output matters more than the occasional exceptional piece
- Protect your fulfillment metrics — the 89.7% repeat purchase rate of top accounts is earned through delivery reliability, not content quality alone
The platform that TikTok Shop is becoming in 2026 rewards sellers who operate with discipline and data-backed decision-making. The window where you could build a sustainable business on the back of a single viral product or a handful of creator relationships is closing. The sellers who understand that are already building the systems that will still be generating returns when the next algorithm shift arrives.