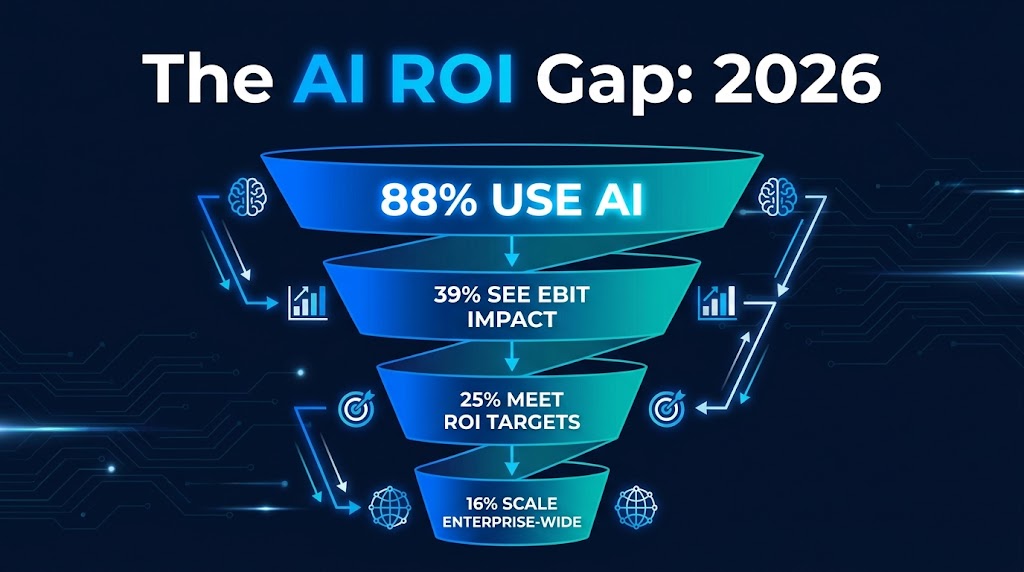
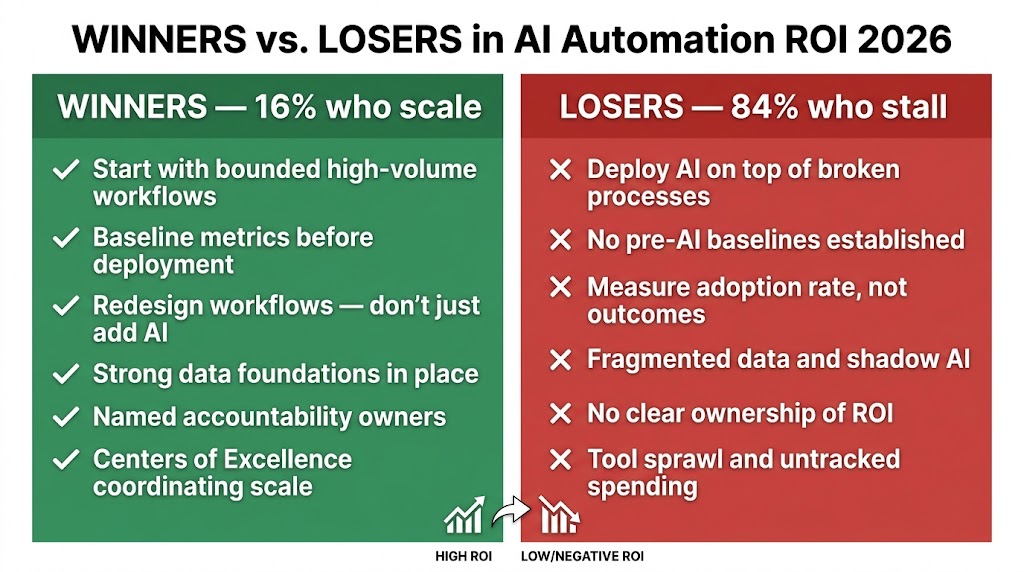
Here is the most counterintuitive fact in enterprise technology right now: 88% of organizations use AI automation regularly, but only 39% report any measurable EBIT impact from it. Meanwhile, 25% of AI initiatives actually meet their stated ROI targets, and just 16% succeed in scaling enterprise-wide. That data comes from a composite of McKinsey, IBM, and Alice Labs benchmarks published in 2026, and it should make every executive running an AI program deeply uncomfortable.
The story being told in most boardrooms goes something like this: AI automation is generating significant productivity at the task level, pilots are delivering impressive results, and the technology is clearly working. And that story is technically true. Where it collapses is in the translation from task-level wins to financial impact on the P&L.
This is not a technology problem. The models work. The automation logic fires. The workflows run. The problem is structural — a gap between how AI automation performs on a micro level and how that performance compounds (or more accurately, fails to compound) into financial outcomes that show up in a CFO’s dashboard.
This article takes a different approach to the “AI ROI” conversation. Rather than another list of use cases or a pilot framework, it examines why the value disappears between the workflow and the balance sheet — and then builds a practical roadmap for 2026 that plugs those specific holes. The goal is a measurement and sequencing architecture that turns AI automation from a cost center with impressive demos into a program that genuinely moves financial needles.
The ROI Illusion: Why Your Metrics Are Lying to You
Most organizations measuring their AI automation programs are measuring the wrong things — not because they are careless, but because the metrics that are easiest to capture happen to be the ones least connected to enterprise financial value.
The problem starts with what consultants sometimes call “level confusion” — mixing metrics from different levels of analysis as if they tell the same story. When a manager reports that AI automation has delivered a 55% productivity improvement on a coding task, they are reporting a task-level metric. When a business analyst says AI has saved their team 3.5 hours per week, that is a worker-level metric. When a department head announces a 25% reduction in process cycle time, that is a team-level metric. All three of these numbers can be simultaneously true — and the company can still show zero improvement in EBIT.
The Four Measurement Layers — and Where Most Organizations Stop
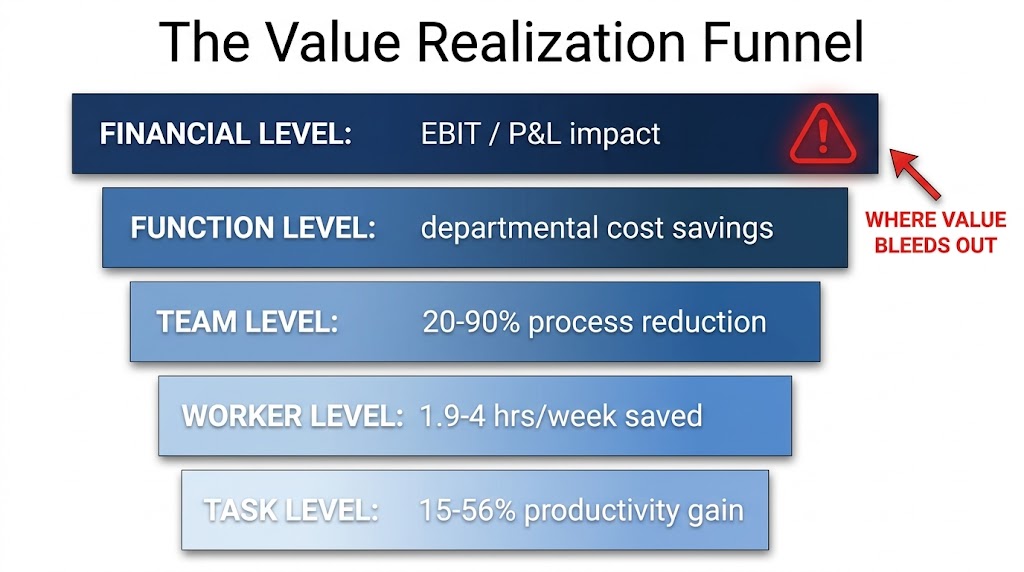
According to the Alice Labs 2026 benchmark report, which analyzed 47 publicly available AI performance metrics across studies and surveys, AI automation value exists across five distinct levels:
- Task level: 15–56% productivity improvement on specific automated tasks
- Worker level: 1.9–4 hours per week saved per individual employee
- Team/workflow level: 20–90% reduction in process cycle time
- Function level: Measurable cost savings or throughput gains per department
- Financial level: EBIT impact, revenue change, or margin improvement
Most organizations measure the first two or three layers well. Very few have systematic measurement at the function and financial levels. This matters enormously, because value created at a task level does not automatically aggregate into financial outcomes. A worker saving 3.5 hours per week does not automatically generate 3.5 hours of additional revenue-producing activity. That time has to be deliberately redirected, the workflow has to be redesigned, and the freed capacity has to be channeled into work that shows up on an income statement.
The Adoption Trap
A related problem is what might be called the adoption trap. Many organizations treat adoption rate — the percentage of employees who use the AI tool at least once per week — as a proxy for ROI. It is not. According to McKinsey research cited in the Alice Labs 2026 report, fewer than 20% of organizations track AI KPIs that are connected to actual business outcomes. The rest are measuring activity, not impact.
This matters especially now because AI spending is accelerating while evidence of financial return remains thin. The PwC CEO Survey from January 2026, which surveyed 4,454 CEOs, found that 56% reported no meaningful revenue gains or cost savings from their AI investments. That is not a technology failure — it is a measurement and management failure, and it starts with tracking the wrong metrics.
“The critical shift is from measuring what AI does to measuring what AI enables the business to achieve. Those are fundamentally different questions that require fundamentally different data.” — Alice Labs 2026 Benchmark Report
The Value Realization Funnel: Where the Returns Disappear
Think of AI automation value as water flowing through a funnel. At the top, there is a large volume — impressive task-level productivity gains that are real and measurable. By the time that value reaches the bottom of the funnel, the vast majority has leaked out. Understanding where the leaks are is the first step to plugging them.
Leak 1: Task Gains Don’t Automatically Transfer to Worker Capacity
When AI automates 40% of a customer service agent’s routine queries, that agent’s workload does not automatically drop by 40%. What typically happens instead is one of three things: the agent fills the freed time with lower-value tasks, the time savings accumulates without being redirected to anything productive, or management increases the agent’s target ticket volume to absorb the efficiency gain. Only in the third scenario does the business actually capture the financial value — and even then, it only shows up as a labor cost saving if headcount is adjusted or if the higher volume generates additional revenue.
This is why Microsoft’s May 2026 research (drawing on 20,000 users across 10 countries) found that organizational factors — culture, workflow design, management support — drive 67% of AI impact, while individual-level productivity gains only drive 32%. The efficiency is created at the individual level. The value is captured (or not) at the organizational level.
Leak 2: Workflow Design Doesn’t Catch Up to Automation Speed
AI tools get deployed faster than workflows get redesigned. An organization installs an AI-powered document processing tool that reduces invoice handling time from 10 days to 1 day. But the approval chain that comes after the processing still takes another 7 days. The downstream bottleneck has not been addressed, so the net cycle time improvement is modest even though the automation itself performed brilliantly.
BCG research cited in the 2026 value realization literature puts this plainly: only 21% of organizations that deploy AI automation successfully redesign the surrounding workflows. The other 79% are essentially inserting a faster engine into a car that still has the same speed governor — the gains are real but partial.
Leak 3: Governance and Accountability Gaps
When no one owns the ROI of a specific AI deployment, nobody notices when the ROI deteriorates. Model performance drifts. Processes change around the automation. Exception rates creep up. Data quality declines. Without structured governance — named owners, monitoring cadences, retraining schedules — even a well-scoped AI deployment will see its returns erode within 12–18 months of production deployment.
Organizations with formal AI Centers of Excellence (CoEs) achieve three times the pilot-to-scale success rate of those with fragmented AI ownership, and they report 35% lower technology costs and 60% higher overall impact from the same investments, according to 2026 CoE benchmarks from multiple sources including Automation Anywhere and Plain Concepts.
Function-by-Function: Where AI Automation Actually Pays Back in 2026
Not all AI automation investments return the same. The function you automate first matters enormously — both for the speed of return and the likelihood of being able to demonstrate credible ROI to a CFO. The 2026 benchmark data shows clear differentiation by business function, and it should directly inform sequencing decisions.
Customer Service: The Highest-ROI Function
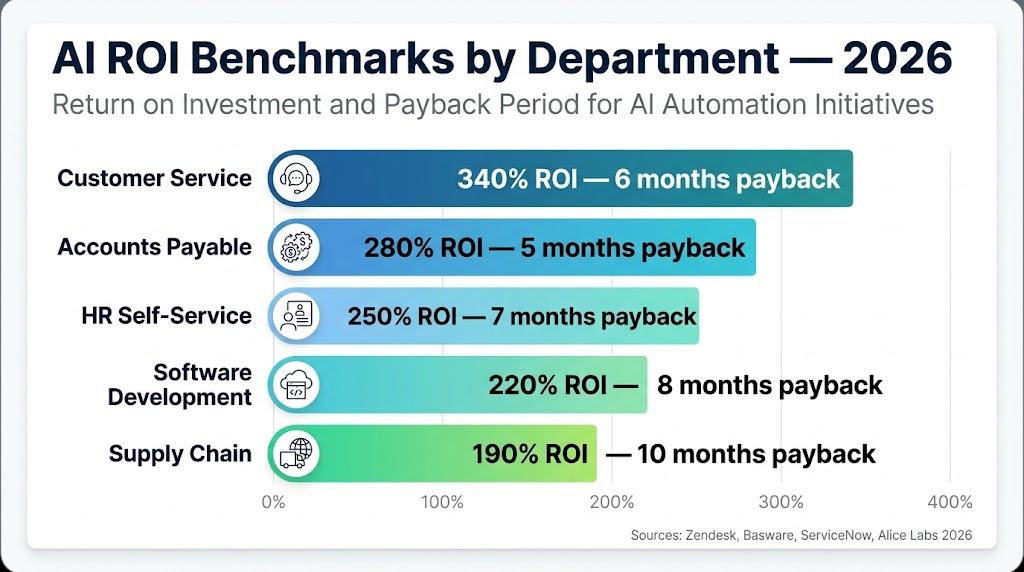
Customer service consistently shows the strongest ROI metrics of any business function for AI automation, and the 2026 data makes this even clearer. Zendesk’s 2026 research shows a 340% average ROI with a six-month payback period. The unit economics are stark: AI-handled customer interactions cost $0.50–$0.70 per query, compared to $6–$8 for a human-handled interaction. Master of Code’s research shows $3.50 in return for every $1 invested, rising to 124%+ cumulative ROI by year three.
Real-world case studies support this. Klarna’s AI customer service deployment reached 2.3 million conversations per month, equivalent to the output of 700 full-time agents, with average resolution time under two minutes. ServiceNow’s implementation saved 410,000 annual hours and generated $17.7 million in cost avoidance. A financial services provider cited in Titanisolutions’ 2026 research automated 55% of incoming inquiries and achieved 48% faster average response times.
The key characteristic that makes customer service the best place to start: it is a bounded, high-volume, repetitive workflow with clear input/output measurement. You know what a ticket costs to handle. You know how many tickets arrive per month. You can measure resolution rate, handle time, and customer satisfaction before and after deployment. This makes the ROI case clean and credible.
Accounts Payable and Finance Operations: Fast Payback, Low Risk
Accounts payable automation shows the second-strongest ROI profile. Basware’s 2026 data shows a 280% average ROI with a five-month payback period. McKinsey’s 2026 research reports 35% operational cost savings in year one for high-volume AP deployments.
The unit economics are equally compelling. Manual invoice processing costs an average of $5–$15 per invoice at mid-market enterprise scale. AI-automated processing brings that below $1. A company processing 5,000 invoices per month could save approximately $900,000 annually — a figure that is easy to model, easy to verify, and easy to communicate to a finance committee.
IBM’s own finance function achieved over 90% cycle time reduction in its AI-assisted financial close process, alongside $600,000 in annual savings. Broader finance benchmarks from Digital Applied’s 2026 research show a median payback period of 10.1 months for finance AI deployments, with 36% hitting year-one ROI. The function level is well-suited to AI because finance workflows are already process-driven, data-rich, and under regulatory pressure to reduce error rates.
HR and People Operations: High Volume, Often Underestimated
HR consistently surprises organizations with the scale of return available from AI automation. IBM’s AskHR deployment achieved a 40% reduction in operational costs, a 94% ticket containment rate, and a 75% reduction in HR ticket volume. ServiceNow’s HR automation generated 410,000 annual hours saved and $17.7 million in cost avoidance.
Broader benchmarks from Phenom’s 2026 research show a median payback period of 11.2 months for HR AI deployments, with 33% hitting year-one ROI. The challenge is that 83% of HR teams remain at an early automation maturity level, meaning most of the available return is still uncaptured. High-volume HR workflows — onboarding, policy queries, benefits administration, candidate screening — share the same characteristics as customer service: they are repetitive, data-driven, and measurable.
Software Development: Real Productivity at Scale
AI-assisted software development has the most extensively documented productivity data of any function. The Alice Labs 2026 benchmark report found 55.8% faster task completion for AI-assisted coding, with developers completing 26% more tasks per sprint when using tools like GitHub Copilot or similar code-generation assistants.
The catch is that development productivity gains are harder to translate into direct financial impact. A developer writing code 55% faster does not generate 55% more revenue unless the organization can deploy more features faster, reduce its time-to-market, or reduce engineering headcount. Teams that capture the financial value of development AI are those that measure it in business outcomes — features shipped per quarter, defect rates, time-to-production — rather than just lines of code or task completion speed.
The Hidden Cost Stack Nobody Budgets For
The single most reliable predictor of an AI automation program failing to meet its ROI targets is an underestimated cost base. According to the Xenoss.io 2026 technology cost analysis, 85% of organizations underestimate their AI project costs by more than 10%, and 25% underestimate by more than 50%. This is not a rounding error. This is a structural planning failure that undermines ROI before deployment even begins.
What Gets Budgeted Versus What Gets Spent
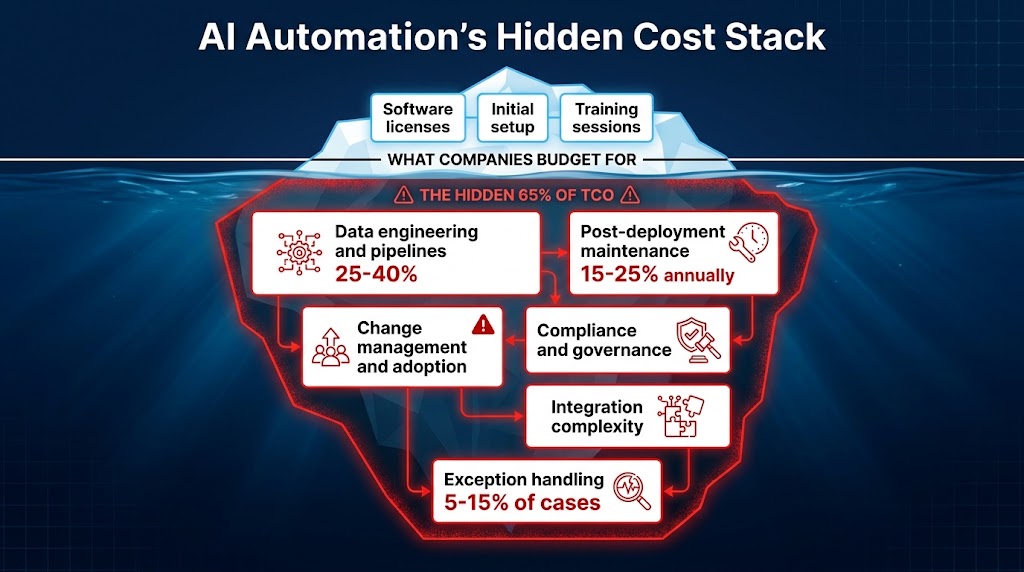
The typical AI automation budget covers what might be called the visible costs: software licensing, initial setup and integration, and training sessions for end users. These are real costs, but they represent a fraction of total cost of ownership. What gets missed — consistently, across industries and company sizes — is the deep cost stack that lives below the surface.
Data engineering and pipelines consume 25–40% of total AI project spend, according to Xenoss.io. AI models need clean, structured, accessible data. In most enterprises, that data is fragmented, inconsistently formatted, and stored in systems that were not designed to share it. Building the pipelines to feed an AI automation system is often the most expensive and time-consuming part of the project — and it is almost always underscoped in the initial budget.
Post-deployment maintenance accounts for approximately 65% of total cost of ownership over a 3–5 year period, according to Keyhole Software’s 2026 analysis. Annual maintenance typically runs 15–25% of the initial build cost. Models drift. Data schemas change. Business rules evolve. Exception volumes fluctuate. All of this requires continuous attention, and organizations that budget for build but not for maintain discover the true cost of their AI program only after deployment.
Integration complexity adds a premium of $150,000–$500,000 for connecting AI systems to existing enterprise infrastructure, according to Xenoss.io. ERP systems, CRM platforms, legacy databases, and cloud services all need to communicate reliably for AI automation to function. Organizations that have heavily customized their core systems — which is most enterprises — face the highest integration costs.
The Change Management Deficit
The most chronically underinvested cost category in AI automation is change management. Most organizations allocate the majority of their AI program budget to technology and very little to the human behavior change required to make that technology deliver value.
Yet Microsoft’s 2026 research (20,000 users, 10 countries) found that organizational factors — management support, process redesign, cultural readiness, performance incentive alignment — drive 67% of AI productivity impact. The technology creates the potential. The organization determines how much of that potential is captured.
Exception handling is a related and often invisible cost. The headline use case for an AI deployment usually handles 85–95% of cases cleanly. The remaining 5–15% of exceptions — unusual situations the model cannot handle — require human intervention. According to the MAIA Brain 2026 infrastructure analysis, organizations routinely underestimate the cost of exception handling, which requires trained staff, escalation processes, and ongoing model refinement.
The True ROI Formula
A more honest ROI calculation accounts for all of these costs. The Larridin 2026 framework offers this structure:
ROI = (Time savings × hourly cost + Cost reductions + Revenue lift) ÷ (Licensing + Training + Infrastructure + Data engineering + Integration + Change management + Annual maintenance)
Organizations that calculate ROI using only the numerator drivers but miss the full denominator are not calculating ROI — they are calculating the best-case theoretical benefit of their automation investment, without accounting for what it actually costs to deliver it.
Sequencing Matters More Than Speed
One of the most consistently damaging decisions in AI automation programs is choosing what to automate first based on what is interesting rather than what is structurally ready. The organizations that struggle to reach enterprise-scale ROI share a common pattern: they selected use cases based on ambition and novelty, deployed into environments that lacked the data infrastructure and workflow discipline to support them, then declared the technology disappointing when results fell short.
Assessing Process Readiness Before Selecting Use Cases
Before selecting any AI automation use case, a process should be evaluated across five readiness dimensions:
- Volume: Is the process high-frequency? Low-volume processes have limited financial impact even when perfectly automated. Target processes that run hundreds or thousands of times per week.
- Standardization: Is the process rules-based and consistent, or is it highly variable and judgment-dependent? AI automation delivers the strongest early returns on standardized, rule-consistent workflows.
- Data availability: Is there sufficient historical data to train or configure the model, and is that data clean and accessible? Poor data quality is the number one technical cause of AI automation failure.
- Measurability: Can you baseline the process before deployment and measure it credibly afterward? Without a pre-AI baseline, you cannot prove ROI regardless of actual performance.
- Business impact: If this process runs better, does it directly affect a metric that shows up in financial reporting? Process improvements that don’t connect to revenue, cost, or risk don’t generate enterprise ROI.
The Right Sequencing Logic
The 2026 benchmark evidence suggests a clear sequencing logic for organizations building their AI automation programs. Rather than starting with the most ambitious or technically interesting use case, successful organizations follow a pattern that builds credibility, infrastructure, and institutional knowledge in sequence.
Start with bounded, high-volume, well-measured workflows where the ROI case is clean and quick — typically customer service, AP processing, or HR self-service. These are not the most exciting AI use cases, but they are the ones with the clearest financial path and the shortest payback periods. They also generate the data and organizational experience that makes subsequent deployments faster and more reliable.
Use those early wins to fund infrastructure improvements — better data pipelines, cleaner data governance, and more robust integration architecture. The return from the first deployment should partially finance the infrastructure that makes the second and third deployments cheaper and more effective.
Expand horizontally before going deep vertically. Rather than automating every conceivable workflow in one department before moving to another, spread early deployments across multiple functions. This builds broader organizational experience, surfaces integration patterns that apply across departments, and creates a wider coalition of stakeholders with reasons to support the program.
The Measurement Architecture That Actually Works
The gap between task-level productivity gains and enterprise financial impact is ultimately a measurement gap. Organizations that close it do so by building a measurement architecture that spans all five value levels — from task to balance sheet — with defined metrics, data collection protocols, and review cadences at each level.
Establishing Pre-AI Baselines
The most overlooked element of AI automation measurement is also the most important: the pre-deployment baseline. You cannot calculate ROI without knowing what the process cost, how long it took, and how accurately it performed before AI was involved. Yet the Larridin 2026 State of Enterprise AI report found that 81% of organizations find AI value difficult to quantify — primarily because they did not establish clean baselines before deployment.
A pre-AI baseline should capture, at minimum:
- Volume: how many times the process runs per week or month
- Cycle time: how long the process takes from trigger to completion
- Cost: the fully loaded cost per process run (staff time at loaded hourly rate plus system costs)
- Error rate: the percentage of process runs that require rework or exception handling
- Downstream impact: what business outcome this process drives (revenue processed, tickets resolved, invoices cleared)
This baseline data should be captured at least 4–8 weeks before deployment and verified by both the operational team running the process and the finance team that owns the cost center. Without that dual verification, the ROI calculation will be challenged by finance stakeholders and will not survive a serious business review.
The Three-Tier Metrics Framework
Effective AI automation measurement operates on three tiers simultaneously:
Activity metrics (reviewed weekly): System utilization rate, number of process runs completed by AI vs. human, exception rate, model accuracy or containment rate. These tell you whether the automation is working technically.
Outcome metrics (reviewed monthly): Cycle time reduction, cost-per-transaction, error rate change, throughput improvement. These tell you whether the automation is performing better than the pre-AI baseline.
Financial metrics (reviewed quarterly): Cost savings captured in the P&L, labor cost per function, revenue impact where applicable, payback period progress, ROI against original business case. These tell you whether the automation is generating enterprise financial value.
The three tiers serve different audiences. Activity metrics go to the technology and operations teams running the system. Outcome metrics go to departmental leaders and process owners. Financial metrics go to the CFO, the executive committee, and the board. Organizations that only report to one audience — usually the technology audience — are solving for adoption rather than for value.
CFO-Ready Reporting
The Digital Applied 2026 research on AI financial reporting identifies the specific metrics that earn and sustain CFO confidence in AI automation programs. Beyond the standard ROI calculation, CFOs in 2026 are focused on: payback period (median AI agent deployment: 6.7 months, down 41% year-over-year), NPV of the automation investment over a 3-year horizon, total cost of ownership inclusive of maintenance and governance, and EBITDA contribution from automation at the function level.
One finding from the CFO Connect 2026 benchmark study is particularly important: speed wins over cost savings when it comes to generating executive support. Research from Serrari found that organizations demonstrating cycle-time improvements win executive advocacy 48% of the time, versus 34% for organizations leading with cost savings messaging. Faster = visible = credible. Start with speed metrics, then layer in cost metrics once the baseline credibility is established.
The Center of Excellence Model: Infrastructure for Compounding Returns
The 16% of organizations that successfully scale AI automation enterprise-wide share one operational characteristic more consistently than any other: they have built a functioning AI Center of Excellence (CoE) before they needed it. Not after the first scaling failure, not after a governance incident, but proactively — as the infrastructure for compounding returns rather than as a remediation measure.
What a CoE Actually Does
An AI CoE is not an innovation lab or an R&D function. Its job is operational: it owns the organizational infrastructure that makes each successive AI deployment faster, cheaper, and more reliably ROI-positive than the last. Specifically, a functioning CoE in 2026 does six things:
- Strategy alignment: Ensures AI automation initiatives map to documented business priorities and financial targets, not to technology enthusiasm.
- Use-case prioritization: Applies a consistent scoring methodology to candidate use cases, assessing ROI potential, readiness, and risk before committing resources.
- Risk classification: Evaluates each deployment against regulatory requirements (EU AI Act, NIST AI RMF, ISO 42001), data privacy constraints, and operational risk thresholds.
- Model lifecycle management: Owns the retraining schedule, performance monitoring cadence, and deprecation process for every AI system in production.
- Accountability assignment: Ensures every deployed AI system has a named business owner responsible for its performance and ROI, and a named technical owner responsible for its reliability.
- Knowledge transfer: Captures lessons from each deployment in a reusable format so that subsequent teams benefit from prior experience rather than repeating the same discoveries.
The Compounding Effect
The financial logic of a CoE is straightforward. The first AI automation deployment in an organization might take 16 weeks and cost $400,000 to deploy. Without a CoE, the second deployment also takes 16 weeks and costs $400,000, because all the decisions about architecture, integration, data quality, and change management are being made from scratch again. With a CoE, the second deployment benefits from reusable patterns, pre-negotiated infrastructure, and an organization that has learned how to adopt AI tools. It takes 10 weeks and costs $280,000.
By the fourth or fifth deployment, organizations with a CoE are delivering AI automation in half the time at a third of the cost of their first deployment. Those without a CoE are still solving the same problems. This compounding dynamic explains why the gap between the 16% who scale successfully and the 84% who stall continues to widen over time rather than narrowing.
What the 16% Who Scale Are Doing Differently
The evidence from 2026’s extensive AI benchmarking literature paints a surprisingly consistent picture of what separates organizations that generate compounding enterprise ROI from those that stay stuck at the pilot stage. It is not budget. It is not the specific technology stack. It is not industry sector or company size. It is a cluster of organizational and measurement practices that can be deliberately adopted.
The Organizational Factors That Drive 67% of AI Impact
Microsoft’s 2026 research across 20,000 users is unambiguous: 67% of AI productivity impact is driven by organizational factors, and only 32% by individual-level tool adoption. The organizational factors that matter most are:
- Management support and active sponsorship — AI programs with a named executive sponsor who actively reviews financial metrics outperform those without by a significant margin in scaling success rates.
- Performance incentive alignment — When employee performance reviews reward outcomes that AI automation enables (throughput, quality, speed) rather than just effort (hours worked, tasks completed), adoption and performance both improve.
- Workflow redesign investment — Winners redesign workflows after automation. They do not simply insert AI into existing processes. This is the single most impactful change an organization can make, and it is consistently the most underinvested.
- Data governance maturity — Organizations with clear data ownership, documented data standards, and active data quality management deploy AI faster and see fewer model performance issues in production.
Winners Start Smaller and Measure More
Counterintuitively, the organizations that ultimately achieve the largest AI automation programs tend to start with narrower, more carefully scoped initial deployments than those that fail. They select one workflow. They baseline it meticulously. They measure every outcome at every level. They iterate based on what the data shows. Then they expand.
The organizations that fail tend to launch broad, ambitious programs across multiple departments simultaneously, without clean baselines or consistent measurement. They generate a lot of activity, a lot of impressive-sounding output metrics, and very little verifiable financial return. Then they face skepticism from finance and reduced investment — exactly when they needed to be scaling.
The 44% of intelligent automation projects that deliver ROI within 12 months (Orbilon Tech, 2026) share a common profile: bounded scope, clear measurement, high-volume workflows, and disciplined financial tracking. RPA deployments in high-volume environments generate 30–200% ROI in year one. Customer service AI generates $3.50 per $1 invested. Accounts payable automation delivers a five-month payback. These numbers are achievable — but only with the measurement rigor to capture them.
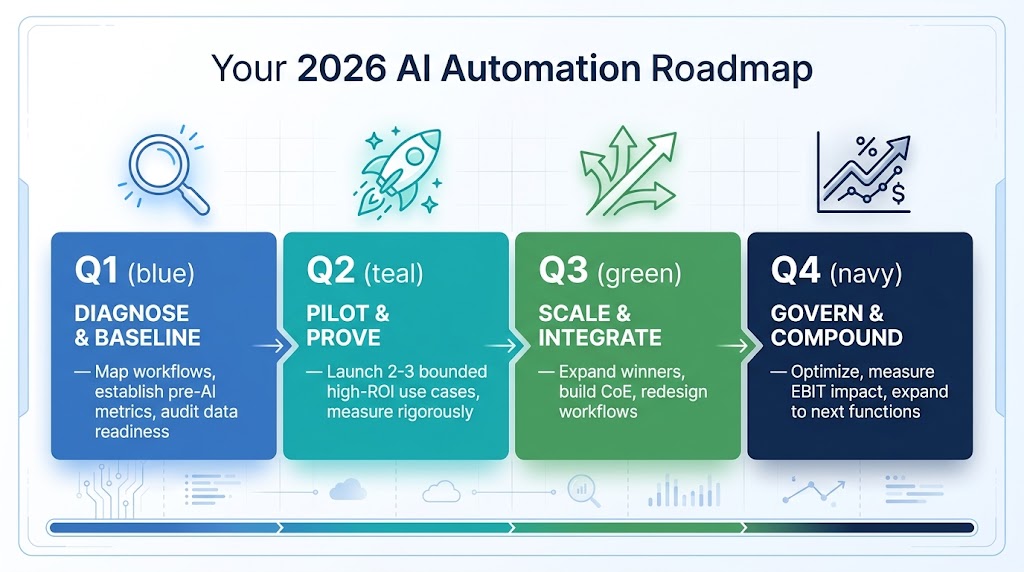
Building Your 2026 Roadmap: A 12-Month Framework
What follows is not a generic AI implementation checklist. It is a roadmap specifically designed to close the value realization gap — to ensure that the productivity being generated at the task and worker level actually reaches the balance sheet by the end of the year.
Q1: Diagnose, Baseline, and Select
The work of Q1 is not about AI. It is about understanding your current process economics well enough to identify where AI will have a measurable financial impact — and measuring the baseline that will prove it after deployment.
Weeks 1–4: Process economics audit. Map your highest-volume, most repetitive workflows across three or four candidate functions. For each one, quantify: weekly volume, average cycle time, fully loaded cost per transaction, error rate, and downstream financial impact. This produces a ranked list of opportunities by financial potential, not by technical interest.
Weeks 5–8: Readiness assessment. Score your top five opportunities against the five readiness dimensions: volume, standardization, data availability, measurability, and business impact. Deprioritize any use case that scores below threshold on data availability or measurability — these are not yet ready to generate demonstrable ROI regardless of how attractive they look on paper.
Weeks 9–12: Baseline establishment. For the two or three use cases that pass readiness assessment, establish formal pre-AI baselines with finance team sign-off. Document the baseline metrics, confirm the measurement methodology, and get agreement from both operations and finance on what “success” looks like in financial terms.
Q2: Pilot, Prove, and Refine
Q2 is where the first AI deployments go live — but at controlled scope, with intensive measurement from day one.
Weeks 13–18: Controlled deployment. Deploy your highest-readiness use case at limited scope — one team, one geography, or one process segment — and measure intensively against your baseline metrics. Expect to spend significant time on exception handling and edge cases in these early weeks. Build the exception management process explicitly; it will be needed at scale.
Weeks 19–22: Workflow redesign. Do not wait until the automation is “working perfectly” to redesign the surrounding workflow. Run the redesign process in parallel with the technical deployment. Map where freed capacity goes. Eliminate the downstream steps that the automation makes unnecessary. Ensure that the time saved at the task level actually converts to either reduced headcount cost or higher-value work — not just faster completion of the same total workload.
Weeks 23–26: Financial validation. At the end of Q2, produce a formal financial comparison against the pre-AI baseline, signed off by finance. This is your proof of concept — and it is the document that funds Q3 and Q4 investment. Digital Applied’s 2026 benchmark shows a median AI agent payback period of 6.7 months; if your Q2 deployment is on track, you should be seeing clear evidence of ROI progress by the end of this phase.
Q3: Scale, Systematize, and Build the CoE
Q3 is where successful organizations begin to compound their returns. The validated first deployment becomes a template. The CoE formation begins. Additional use cases — already baselined in Q1 — move into deployment.
Weeks 27–32: First deployment scale. Expand your Q2 deployment to full production scope. Monitor for the performance degradation that often occurs when AI systems face the full diversity of production workloads. Implement the model monitoring cadence that will govern ongoing performance management.
Weeks 33–38: Second and third deployment launch. Use the organizational learning from the first deployment to accelerate the second and third. The data pipelines are better understood. The exception handling patterns are documented. The change management approach has been tested. Expect the second deployment to take 20–30% less time and cost than the first.
Weeks 39–42: CoE formal establishment. By mid-Q3, your organization has enough AI automation experience to formalize the CoE. Define the governance structure, assign named owners to each deployment, establish the risk classification process, and build the knowledge management system that will accelerate every subsequent deployment.
Q4: Govern, Optimize, and Plan for Year Two
Q4 is about turning a successful AI automation program into a permanent capability with compounding returns.
Weeks 43–48: EBIT measurement and reporting. Produce a formal quarterly ROI report that spans all three metric tiers — activity, outcome, and financial. This report should be formatted for both operational audiences (what changed in the process) and financial audiences (what changed on the P&L). The organizations that sustain long-term AI investment are those that demonstrate financial outcomes clearly and repeatedly.
Weeks 49–52: Year-two pipeline building. Using your Q3 CoE, assess the next cohort of automation opportunities against the same readiness framework. By Q4, your organization should have a pipeline of use cases at various stages of readiness — some in Q1 baseline mode, some in Q2 pilot mode, and some ready for Q3 scale. This pipeline view is what transforms an AI automation project into an AI automation program.
Organizations that reach this stage consistently report a fundamental shift in how they think about AI automation. Rather than asking “should we do this use case?” they are asking “which three should we do this quarter, and which five should we baseline for next quarter?” That shift from case-by-case decisions to portfolio management is the operational signature of the 16% who scale.
Closing the Gap Between What AI Can Do and What It Delivers
The AI process automation ROI gap is one of the defining enterprise challenges of 2026. The technology works. The use cases are documented. The financial potential is real. What is not working is the organizational and measurement infrastructure required to translate task-level productivity into enterprise financial impact.
The data tells a clear story. Organizations that close the gap share common practices: they baseline before they deploy, they measure at every level from task to balance sheet, they redesign workflows rather than just automating existing ones, they sequence from the highest-readiness use cases rather than the most ambitious ones, and they build governance infrastructure proactively rather than reactively.
The organizations that stay stuck share equally common patterns: they measure adoption as a proxy for ROI, they skip the baseline step, they underestimate total cost of ownership by 30–50%, they automate processes without redesigning the surrounding workflows, and they treat AI automation as a technology project rather than as a business change program.
The practical takeaway is not complicated. Before your next AI deployment, answer these five questions in writing, with finance sign-off on each:
- What does this process cost today, per transaction, with error rates documented?
- What is the full cost of deployment including data engineering, integration, maintenance, and change management?
- Where does freed capacity go, and what is the workflow redesign plan?
- Who owns the ROI of this deployment, and how will they be held accountable?
- What is the 12-month financial target in terms that show up on a P&L?
Organizations that can answer all five questions before deployment are building the infrastructure for enterprise-scale ROI. Those that cannot should finish building that infrastructure before they deploy another model. The technology will still be there when you are ready. The returns depend entirely on whether you are.