Every week, someone publishes another “I made $10,000 in my first month on Amazon” story. The screenshots look real. The enthusiasm is contagious. And the comment sections are flooded with people asking how to get started.
What those posts rarely include is the fee breakdown, the PPC spend, the storage costs, the supplier invoices, the return rate, or the six weeks of cash tied up waiting for a payout. They show revenue. Not profit. And those two numbers, on Amazon in 2026, can be separated by a canyon.
This isn’t a guide for people who want the highlights. It’s a guide for sellers — new and experienced — who want to understand the actual economics of building a profitable Amazon business. That means digging into the fee structure that’s quietly compressed margins across the platform, understanding which selling model actually fits your situation, knowing what metrics Amazon will use to suspend your account without warning, and figuring out how to build something that compounds in value over time rather than grinding on a treadmill.
Amazon is still one of the most powerful retail platforms in the world. With hundreds of millions of active customers and infrastructure most brands could never replicate independently, the opportunity is real. But the sellers who win in 2026 are operating with clear-eyed precision about their numbers — not wishful thinking about their revenue screenshots.
Here’s what that precision actually looks like.
Three Selling Models, Three Very Different Businesses
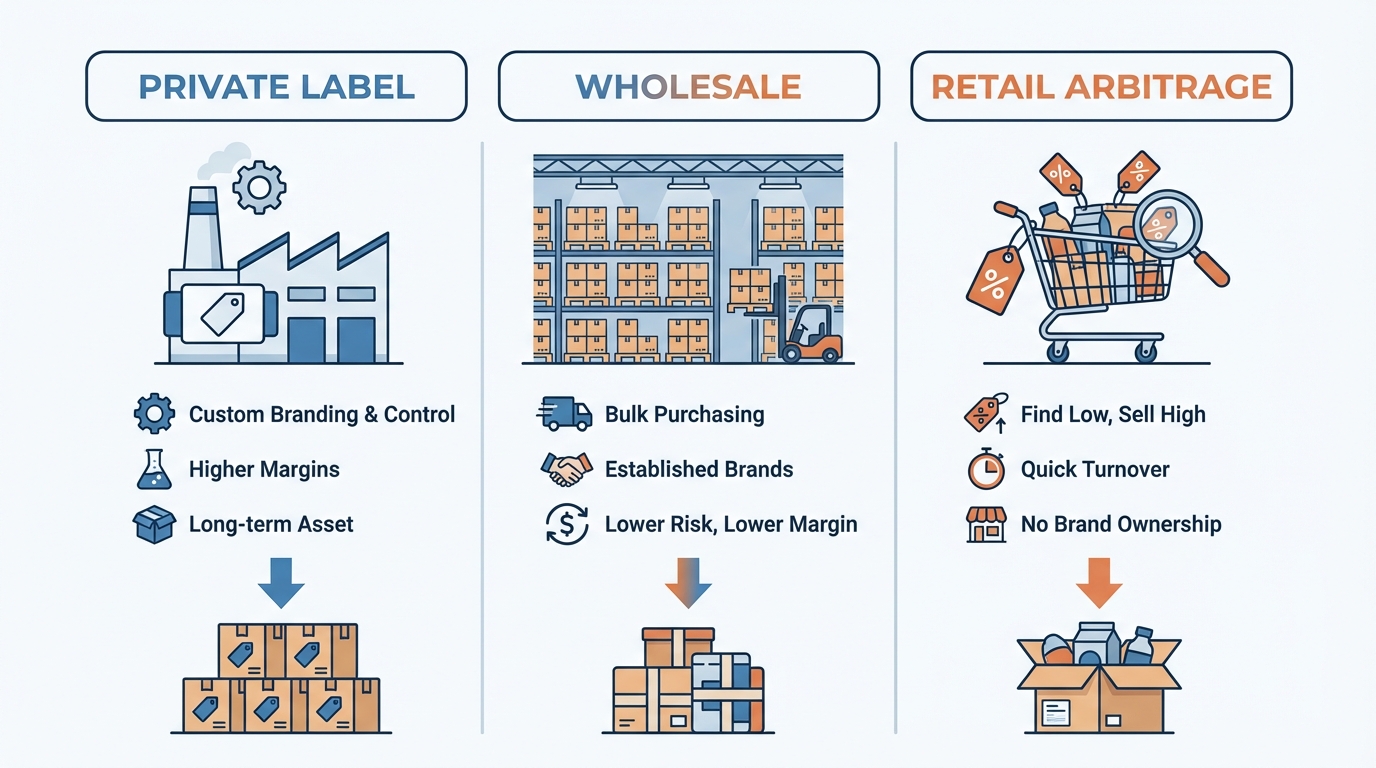
Before you can evaluate whether Amazon is worth your time, you need to know which game you’re actually playing. There are three dominant selling models on the platform, and they differ so fundamentally in terms of capital requirements, risk profile, and long-term upside that conflating them leads to poor decisions from the start.
Private Label: The High-Stakes Brand-Building Path
Private label means sourcing a product — typically from a manufacturer, often overseas — and selling it under your own brand name. You control the listing, the imagery, the pricing, the packaging, and ultimately the customer relationship. When it works, it works well: net margins of 18–35% are achievable for well-optimized private label products, and you’re building an asset that can eventually be sold.
The 2026 landscape has made private label both more compelling and more demanding simultaneously. Amazon now essentially requires Brand Registry enrollment for sellers using FBA with manufacturer UPCs, which means getting a trademark and enrolling in Brand Registry has shifted from a strategic advantage to an operational necessity for most private label sellers. Without it, you face manual FNSKU labeling requirements that add significant logistics overhead.
The upside of Brand Registry is real, though. You unlock A+ Content (which lifts conversion rates by 5–20% depending on implementation), the Brand Story module, Sponsored Brand ads, and critically, full listing protection. Without it, competitors can alter your listing details, which is a risk no serious seller should carry.
The honest challenge with private label in 2026 is capital intensity. You need product development time, supplier relationships, inventory investment, launch spend, and typically 6–12 months before you’re operating comfortably. Entry costs for a credible private label launch start around $5,000–$15,000 for modest volume products and climb sharply from there.
Wholesale: Predictability at the Cost of Margin
Wholesale means buying established branded products in bulk from distributors or directly from brand owners, then reselling them on Amazon. You’re not building a brand — you’re competing on an existing listing, often against multiple other sellers including sometimes the brand itself.
Net margins in wholesale typically run 8–15%, which is considerably lower than private label. But the model has genuine advantages: products already have sales history, reviews, and search ranking. You’re not building from scratch. Your job is operational — source the right products at the right price, manage inventory efficiently, and win (or maintain) Featured Offer placement.
The model rewards relationships. Sellers who develop exclusive or semi-exclusive wholesale agreements with brands — particularly smaller brands that don’t have the bandwidth to sell on Amazon themselves — can capture strong, defensible positions. Without that kind of exclusivity, wholesale on high-competition listings is a margin race that rarely ends well.
Retail and Online Arbitrage: Fast Entry, Limited Ceiling
Arbitrage involves buying discounted products from retail stores or online retailers and reselling them on Amazon at a profit. It requires minimal upfront investment, provides fast feedback, and lets sellers get familiar with the platform quickly.
In practice, arbitrage net margins run 10–25% when executed efficiently, but the model has a fundamental limitation: it doesn’t scale cleanly. You’re constantly sourcing new inventory rather than replenishing a repeatable product. Amazon’s stricter authenticity documentation requirements in 2026 — including invoices from approved suppliers — have also made arbitrage more logistically demanding than it once was.
For most sellers, arbitrage is a learning model, not a destination. It’s a legitimate way to build cash flow and understand the platform before committing capital to wholesale accounts or private label development.
The bottom line: Your selling model determines your margin potential, capital requirement, time horizon, and risk exposure. Decide which one fits your situation before making any other decision about Amazon.
FBA, FBM, and SFP: Choosing the Right Fulfillment Method

How you fulfill orders is one of the highest-leverage decisions in your Amazon business. It affects your Prime eligibility, your Featured Offer competitiveness, your fee structure, and your operational complexity. In 2026, there are three options — and each serves a different seller profile.
FBA (Fulfillment by Amazon): The Default for Good Reason
FBA remains the dominant choice, used by 82–92% of third-party sellers. You ship inventory to Amazon’s warehouses, and Amazon handles picking, packing, shipping, and customer service on returns. The Prime badge applies automatically, and the fulfillment infrastructure Amazon provides is genuinely difficult to match independently.
The tradeoff is fees. In 2026, average FBA fulfillment fees run approximately $4.70 per unit for standard-size products, with the January 2026 fee adjustment adding an average of $0.08 per unit across most tiers. For premium-priced items (over $50), that increase runs $0.31–$0.51 per unit. Storage fees range from $0.78 to $2.40 per cubic foot depending on size tier and season, with Q4 rates representing the highest-cost period on the calendar.
FBA makes the most sense for standard-size products with consistent sell-through, strong sales velocity, and margins that can absorb the fee structure. It’s less ideal for oversized or heavy items where fulfillment costs eat disproportionate margin, and for slow-moving products where storage costs compound into a loss.
FBM (Fulfilled by Merchant): Better Margins, More Work
FBM means you handle fulfillment yourself or through a third-party logistics provider (3PL). You list on Amazon but ship directly to customers. The financial advantage is significant: FBM typically costs around $3.10 per unit in fulfillment costs — roughly 34% less than FBA — making it meaningfully more profitable on the right products.
Without a Prime badge (which requires meeting Seller Fulfilled Prime standards), FBM listings convert at lower rates and compete disadvantageously in the Featured Offer algorithm. That limitation makes standard FBM most appropriate for specific scenarios: heavy or oversized products where FBA’s size-based fees become punishing, high-value low-volume items, custom or made-to-order products, or situations where a seller’s own fulfillment infrastructure genuinely competes with Amazon’s speed.
SFP (Seller Fulfilled Prime): The Best of Both, With Strings Attached
Seller Fulfilled Prime allows merchants to display the Prime badge while fulfilling from their own warehouse. Enrollment in SFP has grown 14% year-over-year because for the right seller, it solves the core FBM problem — you keep control of your inventory and avoid FBA fees while still capturing Prime conversion benefits.
The requirements are demanding. You need a 99% on-time delivery rate, less than 0.5% cancellation rate, weekend pickup capability, and 1–2 day delivery coverage across most zip codes. These aren’t aspirational targets — Amazon enforces them strictly, and falling below them means losing the Prime badge or being removed from the program entirely.
SFP is best suited for high-volume FBM sellers who have already built a reliable fulfillment operation and want to recapture the conversion advantage of Prime without the FBA fee structure. It rewards operational discipline. Sellers who attempt it without genuinely capable infrastructure typically lose more in lost Prime status than they save in fees.
The Real Fee Structure: What You Actually Keep Per Sale
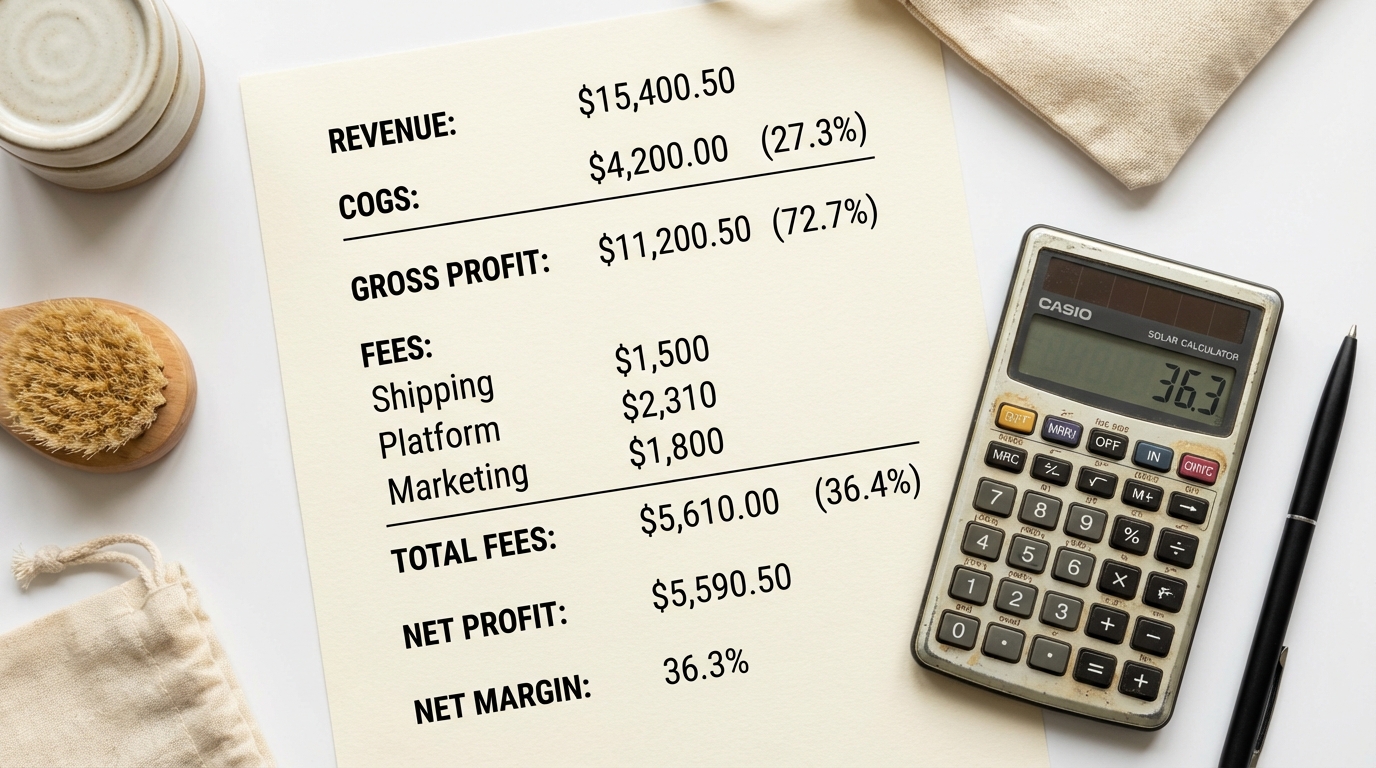
This is where most seller education gets uncomfortable, and where the gap between “revenue” and “profit” becomes viscerally real. Amazon’s fee structure in 2026 involves more line items than most sellers fully account for — and the ones they miss tend to be the ones that quietly destroy profitability.
The Core Fee Stack
For a standard FBA product priced at $24.99, here’s what the fee stack actually looks like before you factor in cost of goods:
- Referral fee (~15%): $3.75 on a $24.99 sale. This varies by category — books pay 15%, electronics as low as 8%, but most consumer goods sit between 8–20%. Many sellers use the median without checking their actual category rate.
- FBA fulfillment fee: Approximately $3.33–$4.70 for a standard-size item depending on weight and dimensions. Post-January 2026 rates apply.
- Storage fees: Roughly $0.15–$0.30 per unit when averaged across a sell-through cycle for standard-size products. This spikes dramatically if inventory sits longer than 90–120 days.
- Inbound placement fees: These were restructured significantly, adding an average of $0.05 per unit for distributed inbound — and up to $0.32–$5.72 per unit for inbound defects (shipments arriving with labeling errors, damage, or non-compliance). Inbound defect fees jumped by roughly 1,600% in some categories under 2026 rules — a number that seems impossible until it shows up on your account statement.
- Returns processing: At a 5% return rate — common in apparel and electronics, lower in commodity categories — you’re absorbing approximately $0.25 per unit across your product line in return processing costs.
The PPC Layer on Top
Once you add advertising costs — which are essentially mandatory for most products to maintain visibility — the picture changes again. Average ACoS (Advertising Cost of Sale) across Amazon has risen to approximately 30% in 2026, up from the low 20s two years ago. That means for every $100 in ad-attributed sales, you’re spending $30 in PPC. On a $24.99 product with a 30% ACoS, advertising alone costs approximately $7.50 per unit — on top of all the fees above.
Run the math: $24.99 sale price, minus $3.75 referral fee, minus $4.20 FBA, minus $0.20 storage, minus $7.50 PPC, minus a $5.50 cost of goods — leaves you with $3.84 per unit. That’s a 15.4% net margin. Healthy enough if you’re selling volume, but not what the revenue screenshot suggests.
The Cash Flow Timing Problem
Amazon’s standard payout schedule operates on a DD+7 basis — meaning after your disbursement date, you wait up to seven additional days for funds. For high-volume sellers, this means weeks of working capital tied up in transit. Combine that with 30–90 day supplier payment terms, inbound shipping lead times, and Amazon’s reserve amounts, and cash flow management becomes one of the most actively managed aspects of a serious Amazon business.
The actionable takeaway: Build your unit economics model before you source a single unit. Use Amazon’s Revenue Calculator in Seller Central, account for PPC based on category ACoS benchmarks, and include inbound placement costs, return rates, and storage projections. If the margin doesn’t work on paper with conservative assumptions, it won’t work in practice.
Winning the Featured Offer (Buy Box) in 2026
Amazon officially renamed the “Buy Box” the “Featured Offer” in 2023, but the underlying mechanics — and the outsized importance of winning that placement — remain unchanged. An estimated 80–90% of Amazon sales go through the Featured Offer position. If you’re not winning it, you’re effectively invisible to the majority of buyers on your listing.
How the Algorithm Actually Works
Amazon’s Featured Offer algorithm doesn’t simply reward the lowest price. It evaluates a dynamic combination of factors: competitive total landed price, fulfillment speed and method, seller performance metrics, inventory depth, and listing quality. The weights applied to each factor vary by category, customer context, and time of year — which is why static repricing strategies eventually underperform dynamic ones.
In 2026, the algorithm has become more sensitive to pricing tolerance than in previous years. The margin within which you can price above the lowest qualifying offer and still maintain Featured Offer rotation has narrowed. Sellers who priced 5–8% above the lowest offer and maintained rotation in prior years are increasingly finding that they’re being rotated out at those spreads.
The Fulfillment Method Advantage
FBA and SFP both carry significant advantages in Featured Offer competition. FBA’s ability to guarantee 1–2 day delivery through Amazon’s network means the algorithm trusts it at a baseline level that FBM sellers without SFP have to compensate for with superior pricing. This is one of the structural reasons FBM sellers on competitive multi-seller listings consistently report lower Buy Box share even at identical price points.
For private label sellers with exclusive listings, this dynamic is less relevant — you’re the only seller, so you hold the Featured Offer by default. Where it matters most is in wholesale and arbitrage models where multiple sellers compete on the same ASIN.
Repricing Strategy in a Tighter Market
Manual repricing is no longer viable for sellers with more than 20–30 active competing SKUs. Algorithmic repricers — tools that adjust pricing in real-time based on competitor prices, Buy Box status, and predefined margin floors — have become standard infrastructure for competitive sellers. The key is setting those rules correctly: a margin floor that prevents you from winning the Buy Box at a loss, and an upper bound that reflects the algorithm’s current tolerance for pricing above competition.
One critical 2026 consideration: Amazon’s algorithm also compares your prices to external websites. Consistently pricing significantly higher on Amazon than on your own website or other channels can suppress your Featured Offer eligibility. Price parity across channels isn’t just a courtesy — it’s algorithmically relevant.
Inventory Management and IPI Score: The Silent Profit Killer
Most sellers track revenue. Fewer track their Inventory Performance Index (IPI) score with the same diligence — and that’s a mistake that costs real money. Your IPI score directly controls how much storage capacity Amazon allocates to your FBA account. Get it wrong, and Amazon restricts your ability to send inventory in, which limits your sales ceiling just as surely as poor marketing.
Understanding the IPI Framework
IPI scores range from 0–1,000. In 2026, the minimum threshold to avoid storage restrictions is 400, with 550+ considered the target range for sellers who want expanded capacity. Amazon calculates your IPI based on four primary factors: sell-through rate, excess inventory ratio, stranded inventory percentage, and in-stock rate for top SKUs.
Amazon tightened its inventory limits in mid-2025, reducing the maximum allowable inventory to five months of projected sales (down from six months). For sellers in competitive categories with seasonal demand, this compression in allowable inventory depth requires tighter forecasting than many were previously operating with.
The Long-Term Storage Fee Trap
Long-term storage fees now kick in at 271 days (reduced from 365 in prior years). For standard-size items, these fees can reach $6.90 per cubic foot — significantly more than regular storage rates. The math on a slow-moving SKU compounds fast: a product that sat for 10 months before selling has accumulated storage fees that can represent 20–40% of its selling price before a single sale was made.
The solution is proactive ASIN management. Run a quarterly inventory audit, identify any SKU with more than 90 days of supply on hand, and evaluate whether to run a sale, create a coupon, liquidate through Amazon’s liquidation program, or arrange removal. The cost of acting early is almost always lower than the cost of long-term storage fees plus the ongoing negative IPI impact.
ASIN Pruning as a Strategic Tool
Counterintuitively, removing underperforming ASINs often improves overall account performance. A product with low sell-through is depressing your IPI score, consuming storage capacity, and potentially incurring storage fees — all while generating little revenue. Pruning it frees capacity for your best performers.
This is a discipline that high-volume sellers practice regularly and new sellers almost never do. The natural instinct is to keep everything active in case it sells. The mathematical reality is that a bloated catalog full of slow-movers often limits the capacity available for your winning products.
A+ Content and Brand Registry: Where Conversions Actually Come From
Brand Registry is now, as discussed, essentially required for FBA sellers using manufacturer UPCs. But beyond its protective and compliance functions, the marketing tools it unlocks have measurable, documented impact on conversion rates — and most sellers underutilize them significantly.
What A+ Content Actually Does to Your Conversion Rate
Amazon’s own data — cited consistently across seller studies — shows that Basic A+ Content increases conversion rates by approximately 3–8% compared to listings without it. Well-designed A+ Content with comparison charts and benefit-focused imagery reaches 8–12%. Premium A+ Content, which incorporates video, interactive hotspot images, and enhanced storytelling modules, reaches 15–20% conversion lifts in competitive categories like electronics, health, and beauty.
To put that in concrete terms: if your listing currently converts at 10% and you implement strong Premium A+ Content, you might reach 11.5–12% conversion. On a listing driving 1,000 sessions per month at a $35 average order value, that 1.5–2 percentage point improvement adds $525–$700 in monthly revenue without changing a single dollar of ad spend. The A+ module is essentially a one-time investment that pays compound returns for the life of the listing.
What Most A+ Content Gets Wrong
The most common mistake in A+ Content is treating it as a design exercise rather than a conversion optimization problem. Sellers invest in beautiful lifestyle imagery and brand storytelling, but fail to address the specific objections, questions, and comparison factors that customers arrive at a listing with.
Effective A+ Content in 2026 does three things well: it answers the most common pre-purchase questions before customers have to ask them (reducing the negative review rate), it shows the product in use at scale in ways that static hero images can’t, and it provides comparison charts that position the product clearly against alternatives. The comparison module in particular drives disproportionate results because it helps customers make decisions without leaving your listing.
Brand Story and Its Underappreciated Role
The Brand Story module — accessible through Brand Registry — appears across all products in your catalog and creates a persistent brand narrative that follows shoppers between ASINs. It’s not directly tied to a single product’s conversion rate, but it increases cross-sell velocity and repeat purchase rates. Brands that have built recognizable narratives in their Brand Story module consistently report higher multi-ASIN cart values among returning customers.
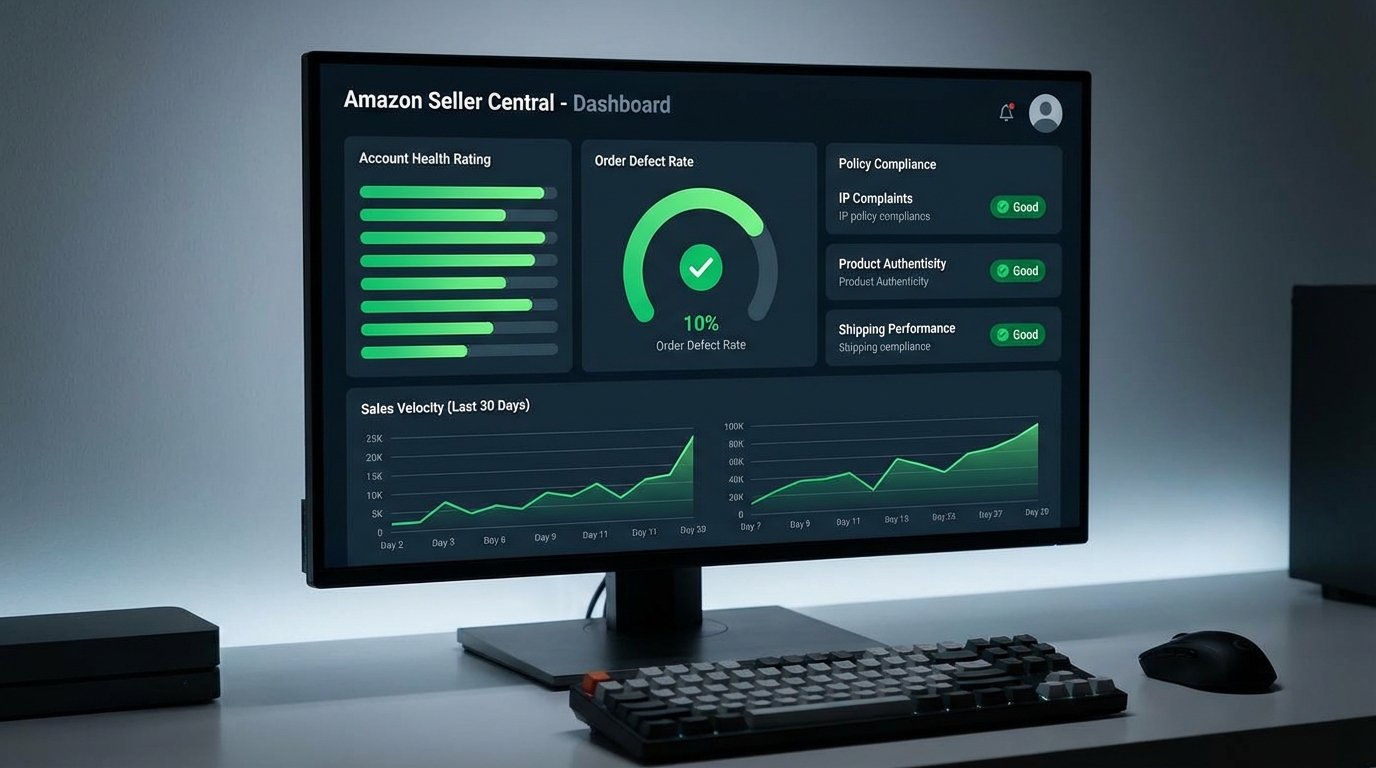
Account Health Metrics: What Can Shut You Down Without Warning
Amazon can suspend your selling account with little notice. For sellers whose entire income runs through the platform, this is existential risk — and it’s not theoretical. Thousands of Amazon accounts face suspension or restriction every month, and many are blindsided by it because they weren’t actively monitoring the metrics that trigger enforcement.
The Metrics That Matter Most
Amazon publishes its performance thresholds in Seller Central. The ones that carry the highest suspension risk if breached are:
- Order Defect Rate (ODR): Must remain below 1%. ODR combines negative feedback rate, A-to-Z Guarantee claim rate, and chargeback rate. Even a brief spike above 1% — caused by a batch of defective products, a shipping disruption, or a surge in A-to-Z claims — can trigger automatic review.
- Late Shipment Rate (LSR): Must stay below 4% for FBM sellers. FBA sellers are largely protected here since Amazon controls shipping, but sellers who mix FBA and FBM need to actively monitor FBM fulfillment performance.
- Pre-Fulfillment Cancellation Rate: Must stay below 2.5%. High cancellation rates signal to Amazon that you’re listing inventory you don’t actually have — a practice it treats as a serious policy violation.
- Valid Tracking Rate (VTR): Must exceed 95% across FBM orders. Shipping without valid tracking numbers is one of the fastest ways to accumulate metric damage.
Policy Compliance: The More Common Suspension Cause
In 2026, Amazon’s AI-driven enforcement systems have become significantly more aggressive at flagging potential policy violations — and acting on them before a human review occurs. The most common policy-related suspension triggers include:
Listing violations — using restricted keywords, making unsupported health claims, or incorrectly categorizing products — are frequently flagged automatically. Intellectual property complaints from brand owners or their representatives can result in ASIN removal or account suspension, particularly in categories with aggressive brand enforcement like electronics, beauty, and apparel.
Authenticity complaints — where customers or Amazon itself questions whether a product is genuine — have become a significant issue for arbitrage and wholesale sellers. Amazon increasingly requires invoices from approved distributors as proof of authenticity, and sellers who can’t produce clean documentation face growing exposure.
Building Suspension Resilience
The practical approach to account health protection involves three disciplines. First, check the Account Health Dashboard in Seller Central daily — not weekly, not monthly. Issues that are catchable early become account-threatening emergencies when they’re caught late. Second, maintain a documentation archive: keep supplier invoices, product authorization letters, and compliance certifications organized and accessible. If Amazon requests documentation during a review, the response window is typically 48–72 hours. Third, treat customer messages as early warning signals. A pattern of customers asking the same question or raising the same concern often precedes a wave of negative reviews or A-to-Z claims by 7–14 days — enough time to intervene if you’re paying attention.
Driving External Traffic to Amazon in 2026
One of the most significant shifts in sophisticated Amazon selling over the past two years is the move from treating Amazon as a closed ecosystem to treating it as a destination that external traffic flows into. The sellers who have made this shift are seeing compounding benefits: lower effective PPC costs, improved organic rankings, and a customer acquisition channel that doesn’t depend entirely on Amazon’s algorithm.
The Brand Referral Bonus: Amazon Pays You to Drive Traffic
Amazon’s Brand Referral Bonus program is one of the most underutilized financial instruments available to brand-registered sellers. When a brand drives external traffic to its Amazon listings via non-Amazon channels (social media, email, content), and that traffic converts to a sale, Amazon credits the seller approximately 10% of the sale price back against future referral fees.
That’s a significant subsidy on customer acquisition from external channels. A brand driving $50,000 per month in external-attributed sales earns roughly $5,000 back in referral fee credits. Many eligible sellers either aren’t enrolled or aren’t using Amazon Attribution links consistently enough to capture the full credit.
Creator Connections and Influencer Traffic
Amazon’s Creator Connections program matches brands with verified Amazon influencers who promote products through their content on TikTok, YouTube, Instagram, and other platforms. Unlike traditional influencer deals, these are performance-based — influencers earn commissions on sales they generate, typically through Amazon’s affiliate attribution system.
The traffic quality from well-matched creators is notable. A micro-influencer (10,000–100,000 followers) in a relevant niche often drives higher conversion rates than broad-reach channels because their audiences have demonstrated interest in the product category. Several brands have reported meaningful spikes in sales velocity and subsequent organic ranking improvements following creator-led campaigns — which creates a flywheel effect: external traffic boosts sales velocity, which improves organic ranking, which drives more organic sales, which reduces dependence on paid PPC.
Multi-Channel Fulfillment as a Distribution Strategy
Amazon’s Multi-Channel Fulfillment (MCF) program lets brands use their FBA inventory to fulfill orders from other channels — TikTok Shop, their own Shopify store, or other marketplaces. This means a brand doesn’t need a separate 3PL to manage inventory for different channels; Amazon’s warehouse network handles it centrally.
MCF orders display Amazon’s delivery speed commitments (including fast delivery badges where eligible), which has become a meaningful conversion factor as customers have come to expect Amazon-level speed across all purchase contexts. Brands using MCF for their TikTok Shop fulfillment, for example, can promise delivery windows that standalone 3PLs often struggle to match at comparable cost.
PPC Reality Check: Managing ACoS in an Expensive Ad Market
Amazon’s advertising platform has changed significantly in character over the past three years. What was once a relatively efficient channel for product discovery has become a crowded, expensive auction where average ACoS has crept to approximately 30% across the platform — with some categories running considerably higher. Understanding where you actually stand in this market is the difference between PPC as growth investment and PPC as a budget drain.
ACoS vs. TACoS: Which Number Actually Matters
ACoS (Advertising Cost of Sale) measures ad spend as a percentage of ad-attributed revenue. TACoS (Total Advertising Cost of Sale) measures ad spend as a percentage of total revenue — including organic sales. TACoS is the more meaningful metric for evaluating PPC health because it captures the true relationship between your ad investment and your overall business performance.
A listing with an ACoS of 40% sounds unhealthy in isolation. But if that listing is generating 70% of its sales organically, the TACoS is only 12% — which is excellent. Conversely, a listing with an ACoS of 20% that generates almost entirely ad-driven sales represents a business where organic visibility is weak and PPC dependency is high. Targeting TACoS of 8–15% for mature products is a reasonable benchmark for most categories.
Campaign Structure and Keyword Harvesting
The most consistently effective PPC framework in 2026 separates discovery and performance in campaign architecture. Auto campaigns and broad match campaigns serve as keyword discovery tools — you’re intentionally casting a wide net to find terms that convert. Manual exact-match campaigns serve as performance vehicles — you’re bidding with precision on proven converters.
The discipline is harvesting. Every 7–14 days, reviewing search term reports from auto and broad campaigns to identify high-converting terms, then migrating those terms to exact-match campaigns at appropriate bids, is the core operational loop that keeps PPC efficient over time. Sellers who don’t harvest consistently find their auto campaigns driving spend on irrelevant terms while their exact-match campaigns remain thin and underutilized.
Dayparting and Bid Adjustments
Amazon now allows dayparting — bid adjustments by time of day and day of week — through the platform’s bulk operations or through third-party tools. For products with clear conversion patterns (many consumer products convert better on weekend mornings, for example), dayparting can improve effective conversion rate without changing overall spend. It’s a detail that makes a marginal difference, but at scale, marginal differences accumulate into meaningful outcomes.
When to Scale PPC and When to Pull Back
A counterintuitive principle that experienced sellers apply: don’t scale PPC on struggling listings. If a product’s conversion rate is weak — below 8–10% for most categories — pouring more ad spend on it amplifies losses rather than solving them. The right sequence is to fix conversion first (listing content, pricing, review count, A+ Content) and then scale traffic. PPC spend on a well-converting listing compounds into organic ranking gains. PPC spend on a poorly-converting listing just burns budget.
Building a Sellable Amazon Business, Not Just an Income Stream
There’s a structural question that most Amazon sellers don’t ask until it’s too late: are you building an asset or a job? The difference matters enormously, not just philosophically, but financially — because a properly structured Amazon business can be sold at a multiple of its earnings, while a fragile operation with concentrated risk, thin margins, and no brand equity is essentially unsellable.
What Acquirers Look for in Amazon Businesses
Amazon business acquisition has become a formalized market. Aggregators, private equity firms, and strategic buyers have collectively spent hundreds of millions acquiring Amazon seller accounts over the past few years. Their evaluation criteria have become well-documented: they look for businesses with three or more years of revenue history, steady or growing sales trends, diversified SKU bases where no single ASIN represents more than 40–50% of revenue, clean account health records, Brand Registry enrollment, and documented supplier relationships with clean invoice trails.
Sellers who understand this framework early can build toward it deliberately. The choices that improve long-term exit value — building a brand with registered trademark, diversifying the SKU base, maintaining clean supplier documentation, avoiding policy violations, building off-Amazon audience assets — happen to be the same choices that make the business more resilient day-to-day.
Diversification Beyond Amazon
The most significant risk in a pure-Amazon business is platform dependency. Amazon can change its fee structure (it did, significantly, in 2026), alter its algorithm, restrict your account, or introduce competing private label products in your category. These risks are real, and they’re not fully within your control.
Sellers who have diversified — building a Shopify presence, growing an email list, developing social audiences, or expanding to Walmart Marketplace or other channels — have materially lower risk profiles. This doesn’t mean abandoning Amazon, which remains the highest-volume e-commerce channel in the US. It means not making it the only channel through which your business exists.
The Brand Equity Compounding Effect
Brand equity on Amazon compounds in ways that pure-marketplace thinking misses. A brand with 1,000+ reviews on its flagship ASIN, a recognizable Brand Story module, an email list of past customers, and a presence in Amazon’s Creator Connections program has a competitive position that’s genuinely difficult to replicate quickly. New entrants can copy your product. They can’t instantly replicate your review count, your brand recognition, or your customer relationships.
This is why the most strategically sound Amazon businesses in 2026 are thinking about brand-building as an operational priority, not an afterthought. Post-purchase email sequences (facilitated through Amazon’s permitted buyer-seller messaging tools), Amazon Vine for early review building on new launches, and Brand Follow — Amazon’s notification system that lets customers subscribe to brand updates — are all mechanisms that build compound customer equity over time.
Conclusion: Clear Eyes, Real Numbers, and a Long-Term View
Amazon selling in 2026 is a legitimate business opportunity. The platform’s scale, logistics infrastructure, and customer trust are genuinely exceptional. For sellers who approach it with accurate unit economics, the right fulfillment model, solid brand registration, active account health monitoring, and a strategic view of where they’re building toward, the returns can be substantial and durable.
But none of that happens by accident. The sellers who struggle are almost universally the ones who started with revenue projections based on gross sales figures, ignored the fee stack that sits between a sale and actual cash in their pocket, and treated Amazon as a passive income machine rather than an active business that requires consistent operational attention.
Here are the core takeaways to carry forward:
- Model your unit economics before you source: Include referral fees, FBA fulfillment, storage, inbound placement, returns, and a realistic PPC assumption. Target a minimum 20% net margin after all costs.
- Choose your fulfillment method based on your product characteristics: FBA for standard-size, high-velocity products; FBM for heavy or oversized items; SFP only if your fulfillment operation genuinely supports the speed requirements.
- Enroll in Brand Registry early: The conversion benefits of A+ Content, Sponsored Brand ads, and listing protection pay returns that compound over the life of the business.
- Check your Account Health Dashboard every day: Most account suspensions are preventable with early intervention. Most sellers who get suspended were seeing warning signs they weren’t tracking.
- Build toward a TACoS of 8–15%: Fix conversion rate before scaling ad spend. Optimize listings, review counts, and A+ Content first.
- Drive external traffic to capture the Brand Referral Bonus: The ~10% credit on external-attributed sales is one of the most underused profit mechanisms available to brand-registered sellers.
- Manage inventory proactively: Run quarterly ASIN audits, target an IPI score above 550, and never let inventory age past 180 days without intervention.
- Build assets, not just sales: A trademark, a Brand Registry account, clean supplier documentation, an email list, and a diversified channel mix make the business worth more — and more resilient — than revenue alone ever will.
The sellers who are thriving on Amazon in 2026 aren’t necessarily the ones with the best products. They’re the ones who understand their numbers, manage their operations with discipline, and build with a long enough time horizon that compounding can work in their favor. That combination is available to anyone willing to do the work — but it has to be built deliberately, one decision at a time.