


Here is what nobody tells you before you start selling on Amazon: the median seller earns about $1,250 per month in revenue globally — and at a typical 15% net margin, that works out to roughly $188 in actual profit. That is not a typo. It is the honest, data-backed reality of what most Amazon businesses produce, month after month, before the seller ever figures out what they are doing wrong.
At the same time, the top 10% of sellers generate over $500,000 per year. A small slice — around 5.6% of active sellers — clears more than $83,000 every single month. The gap between the median and the top is not luck. It is the result of decisions: which business model to operate, how to research products, how to manage cash, how to protect the account, and ultimately, how to build something worth selling.
This guide is not about getting started on Amazon. It is about building an Amazon business that performs like a real business — one with healthy margins, defensible positioning, protected operations, and, when the time comes, a credible exit valuation. Whether you are already selling or preparing your first serious move into the marketplace, the frameworks and data here are designed to move you closer to that top tier, not the median.
In 2026, with over 1.8 million active sellers competing across Amazon’s marketplace and active seller counts already down more than 30% from their 2021 peak, the opportunity is real — but so is the pressure. Traffic per remaining seller has actually increased 31% as the ecosystem has thinned. That is good news for prepared operators. This guide exists to help you be one of them.
The Real Numbers Behind Amazon Selling in 2026
Before choosing a strategy, structure, or supplier, it helps to understand what the Amazon landscape actually looks like — not the highlight reel, but the full distribution of outcomes.
Revenue Distribution: The Uncomfortable Truth
Amazon’s third-party seller ecosystem generates over $500 billion in annual revenue across its active base. That sounds like an ocean of money, and it is — but the current is very uneven. Just 2% of U.S. sellers control more than 50% of all revenue on the platform. Meanwhile, 40% of new U.S. sellers make zero sales in their first year.
The average monthly revenue figure — $23,148 globally, $46,424 in the U.S. — is so heavily skewed by mega-sellers that it is almost meaningless as a benchmark. The median tells the more honest story: $1,250 per month globally, $1,667 in the U.S. Strip out fees, cost of goods, and advertising, and you are left with roughly $188 to $250 per month in net profit for the typical active seller.
What Separates the Top Tier
The top performers are not just selling more units. They are operating differently at almost every level. They have chosen business models with structural advantages, built supplier relationships that protect their margins, actively managed their cash position, and treated brand development as a long-term asset — not just a product launch exercise.
Among sellers earning over $100,000 per year (roughly 25% of active sellers), common traits include higher-margin product categories, multi-ASIN catalogs that reduce revenue concentration risk, registered brand status, and documented processes that make their businesses acquirable. These are not accidental outcomes. They are the result of deliberate decisions made early and compounded over time.
The 2026 Fee and Policy Landscape
Amazon increased FBA fees on January 15, 2026, by an average of $0.08 per unit for standard-size items priced between $10 and $50. For many sellers in competitive, low-margin categories, that single change erased meaningful profitability. Simultaneously, Amazon’s new DD+7 payout policy, launched March 12, 2026, delays seller payouts until seven days after delivery rather than after shipment — creating a cash flow gap of $3,000 to $5,000 per month for businesses generating $100,000 in revenue.
Understanding these structural realities before building your strategy is not pessimism — it is the foundation of a profitable operation.
Choosing Your Business Model: The Decision That Shapes Everything
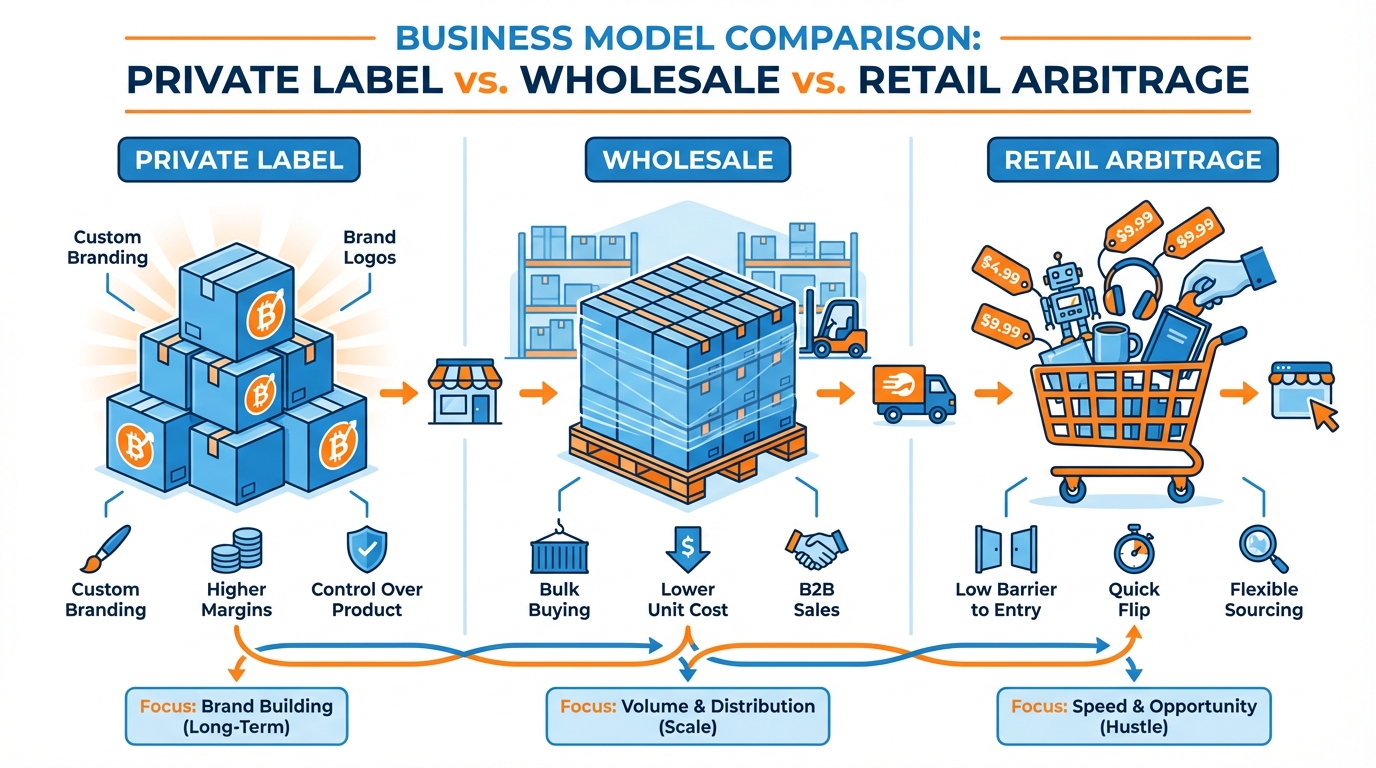
The three dominant Amazon selling models — private label, wholesale, and arbitrage — operate under fundamentally different economics. Choosing the wrong one for your situation, capital base, and goals is one of the most expensive mistakes a seller can make. Here is what the data actually says about each.
Private Label: High Control, High Effort, High Ceiling
Private label means sourcing a generic or manufactured product, branding it as your own, and selling it exclusively under your brand. It is the model with the highest ceiling — and the most demanding entry requirements.
Net margins for private label typically run 18% to 35%, driven by the seller’s full control over cost of goods, pricing, and positioning. There is no supplier dictating your price floor, no competing seller undercutting you on your own listing, and no buy box to share with anyone. When it works, it works exceptionally well.
The challenges are real, however. Minimum startup costs range from $5,000 to $10,000 or more for a single product, including sourcing (typically from overseas manufacturers), branding, photography, and initial advertising spend to establish ranking. The timeline from idea to profitable product can stretch 6 to 12 months. And the risks are front-loaded: if product research is poor, if the manufacturer quality is inconsistent, or if a competitor floods the niche with a cheaper alternative, the investment evaporates.
Private label is best suited to sellers with patient capital, time for deep research, and a long-term orientation. It builds equity in a brand that can eventually be sold.
Wholesale: Predictable Economics, Relationship-Driven Growth
Wholesale involves purchasing established branded products in bulk from manufacturers or authorized distributors and reselling them on Amazon. The brand equity already exists. The product already has demand. Your job is to win the buy box and turn inventory efficiently.
Net margins in wholesale typically run 8% to 15% — lower than private label, but built on far more predictable demand signals. You can pull sales data on existing ASINs before placing a single order. There is no product development risk, no need to build brand awareness from scratch, and no dependency on advertising to generate initial traction.
The startup costs are higher than arbitrage — typically $5,000 to $10,000 to meet supplier minimums and build a working catalog — but lower than private label when you factor in photography, branding, and advertising ramp-up. Scalability is constrained by supplier relationships and allocation limits, but those constraints also serve as a moat: once you have established supplier accounts, new entrants cannot easily replicate them.
Retail and Online Arbitrage: Low Barrier, Low Durability
Arbitrage — buying discounted products at retail or online and reselling at a markup on Amazon — is the most accessible starting point for new sellers. Capital requirements start as low as $200 to $1,000 for retail arbitrage, and the learning curve for the mechanics is relatively shallow.
ROI per unit can be strong — 10% to 25% variable returns — but the durability is the problem. Supply is inconsistent. Margins compress quickly as other sellers discover the same deal. Retail arbitrage especially requires significant time investment (physically scanning store clearance sections) that does not compound into long-term assets. Online arbitrage is more scalable with the right software, but the deals dry up fast once they are widely discovered.
Arbitrage is useful as a learning tool or a way to generate cash flow while building toward a more durable model. As a long-term primary strategy, the economics are difficult to sustain.
The Hybrid Approach
Many of the most successful Amazon businesses in 2026 operate some combination of these models. A seller might run a wholesale catalog of 30 to 50 established SKUs for predictable cash flow while simultaneously developing one or two private label products for higher margin and brand-building purposes. The wholesale revenue funds the private label experiments. The private label products, if successful, eventually anchor the brand’s equity and exit valuation.
Product Research: Finding the Intersection of Demand, Competition, and Margin
Product research is where most Amazon businesses are won or lost. A structurally weak product choice cannot be saved by great photography, smart advertising, or perfect logistics. Getting this right is not about intuition or spotting trends — it is about applying a systematic filter to eliminate the products most likely to fail.
Demand Validation: The Floor Before Anything Else
Any product you consider for private label or wholesale needs to demonstrate stable, organic demand before a single dollar is committed. In 2026, the benchmarks that experienced sellers use are:
- Minimum 200+ units sold per month by the category leaders, ideally across multiple competing sellers rather than concentrated in a single dominant player.
- Primary keyword search volume of at least 2,000 to 5,000 searches per month on Amazon. Below 2,000, you become almost entirely dependent on paid advertising to generate any traffic at all, which compounds the unit economics problem.
- BSR (Best Seller Rank) below 50,000 in the main category for consistent sellers, indicating sustained velocity rather than spike-and-drop patterns.
- Google Trends stability — flat or upward trending search volume over a 2-year window signals evergreen demand rather than seasonal or fad-driven buying patterns.
Tools like Helium 10’s Black Box and Magnet, Jungle Scout’s product database, and DataDive are standard in this stage. The data is widely accessible; the discipline of applying it consistently is what separates systematic operators from guessers.
Competition Analysis: The Ceiling on Your Growth
High demand is only valuable if competition is beatable. The markers that suggest a category is overrun:
- The top 3 listings each have more than 1,000 reviews and the newest is over 12 months old — new entrants will take 6 to 18 months to reach review parity even with aggressive review request programs.
- Dominant national brands with registered trademarks occupy the first page — these listings benefit from brand recognition, advertising budgets, and retail channel support that third-party sellers simply cannot match.
- Price compression is visible in historical data — sellers cutting prices progressively to defend rank signals a race to the bottom that destroys margins for everyone.
The sweet spot in 2026: categories where at least 2 competitors are generating $10,000+ per month (proving the demand is real) but where no single seller controls more than 30% to 40% of category revenue, and where the top listings have review counts under 300 to 500. That review gap is closeable within 12 months with a well-executed launch strategy.
Margin Architecture: Building In Profitability From the Start
The product’s price point and physical characteristics are not afterthoughts — they determine the economics before you order a single unit. In 2026, the target parameters for a viable private label product:
- Selling price between $25 and $80. Below $25, FBA fees consume too high a percentage of the revenue. Above $80, the purchase threshold triggers more buyer hesitation and requires higher advertising spend to convert.
- Under 2 pounds in weight. FBA fulfillment fees escalate sharply with weight and size tier. Products that tip into “oversized” territory can see fees of 25% to 35% of ASP.
- COGS at 25% or less of selling price, leaving room for FBA fees (15% to 20%), advertising (10% to 15%), and still landing at a 20%+ net margin.
- No hazmat, fragile, or temperature-sensitive characteristics that add storage restrictions, special handling fees, or return complications.
Running a product through Amazon’s FBA Revenue Calculator before committing to a supplier quote is non-negotiable. The calculator uses current fee schedules and gives you an accurate picture of what the unit economics look like at your target price point.
FBA vs. FBM: Making the Right Fulfilment Decision for Each Product
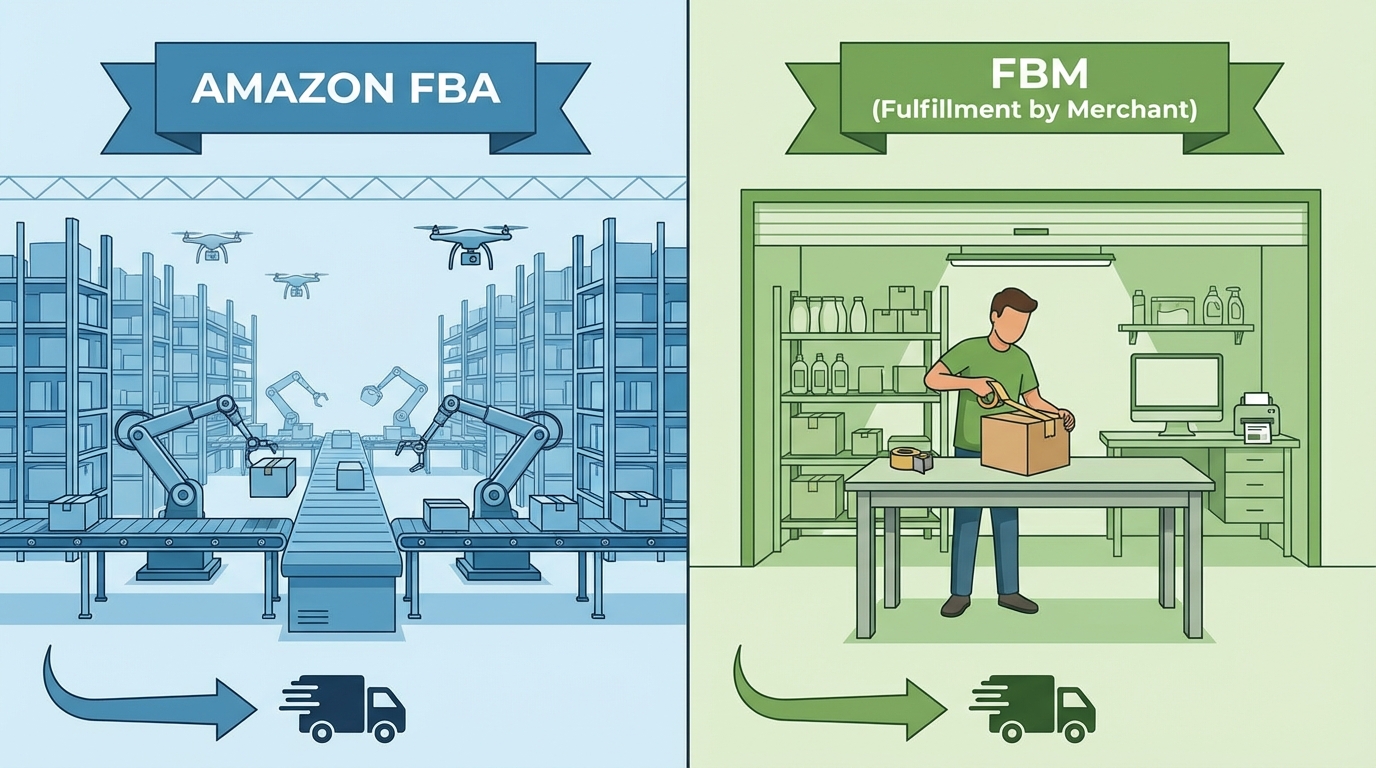
The FBA versus FBM decision is not a one-time choice made at account setup — it is a per-product decision that should be revisited whenever fee structures change, product velocity shifts, or storage situations evolve. Getting this wrong costs real money.
When FBA Wins on the Numbers
For standard-size products with consistent sales velocity, FBA delivers a measurable unit economics advantage in 2026 — even after January’s fee increases. A concrete example from current data: a $24.99 product selling 200 units per month costs approximately $8.13 per unit to fulfill via FBA versus $9.00 via FBM. That $0.87 per unit advantage, multiplied by volume, is meaningful. More importantly, Prime eligibility — which FBA provides automatically — increases Buy Box win probability by 30% to 50%, which directly amplifies the revenue side of the equation.
The practical threshold: if your product is standard-size (under 18″ x 14″ x 8″, under 3 lbs), sells more than 50 units per month, and your ASP is between $15 and $80, FBA is almost always the right choice. The Prime badge, faster delivery promises, and Buy Box advantage compound in ways that the fee comparison alone does not fully capture.
When FBM Makes More Financial Sense
FBM flips the economics in specific, well-defined situations. For oversized or heavy products, FBA fees can consume 25% to 35% of ASP — a structural disadvantage that no amount of volume can overcome. A seller fulfilling oversized items via their own warehouse or a 3PL (third-party logistics) partner can save $16 or more per unit compared to FBA rates on the same item.
FBM also outperforms for slow-moving inventory. Amazon’s storage fees are $0.87 to $2.40 per cubic foot per month (with Q4 peak surcharges significantly higher). Products that sit in a fulfillment center for 60 to 90 days accumulate storage costs that can exceed the unit profit margin. Low-velocity SKUs, seasonal products held off-season, and niche items with unpredictable demand are strong FBM candidates.
Sellers with an Inventory Performance Index (IPI) score below Amazon’s threshold also face storage restrictions and excess inventory fees — FBM eliminates that constraint entirely by keeping inventory out of Amazon’s warehouses until purchase.
The Hybrid Fulfillment Strategy
The most sophisticated sellers in 2026 do not pick one or the other — they run FBA on fast-moving standard-size SKUs and FBM (or a 3PL) on everything that falls outside those parameters. This requires operational complexity that a single-product beginner does not need, but for a catalog seller with 20 or more ASINs, the margin improvement from routing each product to its optimal fulfillment method is significant.
Cash Flow Management: The 2026 Squeeze and How to Survive It
Cash flow is the silent killer of otherwise solid Amazon businesses. A seller can have strong margins on paper, a growing catalog, and rising revenue — and still run out of operating capital. In 2026, two specific structural changes have made this problem materially worse for the average seller.
Understanding the DD+7 Problem
Amazon’s DD+7 payout policy, implemented March 12, 2026, delays disbursements until seven days after the delivery date — not the shipment date, as was previously the case. For a seller with standard 5-to-7-day delivery windows, this effectively extends the cash cycle by 10 to 14 days compared to previous norms.
The math: a business generating $100,000 per month in Amazon revenue now faces an average payout delay of 14 to 21 days from the point of sale. That means roughly $35,000 to $70,000 in revenue is perpetually “in transit” — earned but not accessible. For a business that needs to reorder inventory every 30 to 45 days, this delay can force inventory financing decisions that cost 20% to 40% annualized interest.
Building a Cash Buffer: The 90-Day Inventory Rule
The sellers who navigate these delays cleanly are the ones who treat cash buffer as a fixed operating cost rather than an optional reserve. A practical framework:
- Maintain 90 days of operating capital in liquid form — enough to fund one full inventory reorder cycle plus 30 days of advertising spend without touching Amazon payouts.
- Calculate your true cash cycle: time from supplier payment to Amazon payout. For FBA with international sourcing, this is often 90 to 120 days (30-day lead time + 2-week inbound shipping + 30-day average selling period + 14-day payout cycle).
- Use inventory financing strategically, not reactively. Revenue-based financing options (Clearco, Sellers Funding, Parker, Ampla) charge significantly lower effective rates than emergency credit when arranged before the cash crunch, not during it.
IPI Score Management and Storage Cost Avoidance
Amazon’s Inventory Performance Index (IPI) measures how efficiently sellers manage their FBA inventory. A score below Amazon’s threshold (currently 400) triggers storage restrictions — meaning Amazon limits the amount of inventory you can send to fulfillment centers, which directly throttles your ability to scale volume. Sellers with high IPI scores face no such limits.
The core IPI drivers are: sell-through rate (how fast you turn inventory), excess inventory percentage, stranded inventory rate, and in-stock rate for replenishable items. Keeping the score healthy means tighter inventory management, which also means lower storage costs. These are not competing priorities — they are the same discipline.
Tracking True Profitability
One of the most common cash flow problems is not a cash problem at all — it is an accounting problem. Sellers who track revenue but not all costs (FBA fees, inbound shipping, prep center fees, advertising ACOS, return rates, refund rates, and software subscriptions) often believe they are profitable when they are not. Profit analytics platforms that integrate directly with Amazon Seller Central — pulling all fee data automatically — are essential for any seller doing more than $10,000 per month in revenue. Flying blind on numbers at scale is how otherwise promising businesses fail quietly.
Wholesale Supplier Relationships: The Negotiation Playbook

For wholesale sellers, supplier relationships are the most important business asset they have — more important than any individual ASIN, any ranking position, or any advertising strategy. The terms, trust, and access you build with suppliers directly determine your margins and your competitive moat.
How Supplier Tiering Actually Works
Most established distributors and brand-authorized wholesalers operate tiered pricing structures, even when they do not advertise this fact openly. A typical three-tier system looks like this:
- Tier C (New/Small Accounts): Standard list price with no volume discounts. This is where every new account starts. Suppliers offer these terms because they have no history with the buyer and carry full risk of inconsistent orders, payment delays, and poor brand representation.
- Tier B (Established Accounts): 5% to 10% below list price, typically unlocked after 3 to 6 months of consistent, on-time orders. Suppliers begin treating these accounts as reliable revenue.
- Tier A (High-Volume/Strategic Accounts): 12% to 20% below list, sometimes including extended payment terms (Net 30 or Net 60), priority allocation on limited stock, and early access to new product lines. These accounts are treated as true partners.
The mistake most new wholesale sellers make is asking for better pricing before they have earned the right to it. A supplier who receives a discount request on the first call — before a single order has been placed — has no basis for granting it and good reason to wonder whether the seller understands how the relationship is supposed to develop.
The Right Sequence for Negotiation
Effective negotiation in wholesale is a long-term process, not a single conversation. The sequence that works:
- Place your first 1 to 2 orders at standard terms, on time, without complications. Your job in this phase is to be the easiest account the supplier manages.
- After establishing a track record (typically 60 to 90 days of consistent ordering), initiate a review conversation: “I’ve been placing consistent orders with you for the past three months and I’m planning to increase volume. Is there tiered pricing available at higher order quantities?”
- Negotiate payment terms alongside price. Net 30 or Net 60 terms are sometimes more valuable than a 5% price discount because they reduce the cash cycle, eliminating the need for inventory financing on that supplier’s products.
- Request exclusivity carefully. Some suppliers will grant Amazon exclusivity to a single seller in exchange for volume commitments. This is the highest-value outcome in wholesale — no buy box competition from other Amazon sellers — but it requires demonstrated reliability and meaningful purchase volume to secure.
Protecting Supplier Relationships Long-Term
Supplier relationships break down in predictable ways: payment delays, over-ordering then returning excess stock, representing the brand poorly on Amazon through poor listing quality or pricing below MAP (Minimum Advertised Price), and dropping communication when problems arise. The sellers who maintain top-tier access for years are the ones who treat the supplier relationship like a partnership — communicating proactively, respecting MAP policies even when it would be profitable short-term to violate them, and flagging problems early rather than hoping they resolve themselves.
Building a Brand Worth Coming Back To
The difference between an Amazon listing and an Amazon brand is repeat purchase behavior. A listing sells a product once. A brand creates customers who actively seek it out again — and who bring lower acquisition costs, higher lifetime value, and greater resistance to competitor undercutting with every repeat purchase.
Amazon Brand Registry and What It Actually Unlocks
Brand Registry is the foundational step. Enrollment requires an active trademark (in most markets), but the access it unlocks is significant: A+ Content (previously Premium Enhanced Brand Content), Brand Store, Brand Analytics, Sponsored Brands ads, Vine enrollment for review generation, and — critically — Brand Tailored Promotions for targeted customer segments.
Brand Tailored Promotions allow Brand Registered sellers to create custom discount offers targeted specifically to: past purchasers, cart abandoners, brand followers, and high-spend customer segments. This capability shifts the economics of customer retention fundamentally — instead of discounting to all buyers equally, you can protect full-price sales to new customers while offering loyalty pricing to buyers who have already demonstrated intent.
Subscribe and Save as a Retention Engine
For products with any replenishment logic — consumables, supplements, cleaning products, pet supplies, personal care — Subscribe and Save is one of the most powerful retention tools available. Prime members retain at a 93% rate after year one, and 98% after year two of Subscribe and Save enrollment. Contrast that with the typical e-commerce repeat purchase rate of 30%, and the compounding effect of a healthy Subscribe and Save catalog becomes obvious.
The key to building S&S volume is not aggressive discounting — it is ensuring the product quality and delivery consistency that makes customers comfortable committing to recurring orders. A 5% subscriber discount is far less costly than the 15% to 25% advertising ACOS required to acquire an equivalent new customer.
Driving Off-Amazon Traffic to Build Real Brand Equity
The sellers who have built genuinely defensible Amazon brands in 2026 treat Amazon as one channel in a multi-channel customer acquisition strategy — not the only one. Driving external traffic to Amazon listings accomplishes two things: it increases conversion velocity (which signals relevance to Amazon’s A9 algorithm) and it builds brand awareness that reduces the dependency on Amazon’s own search results for discovery.
The primary external traffic channels delivering results in 2026:
- Influencer and creator partnerships: Product reviews and demonstrations from creators with audience alignment drive purchase intent from warm buyers who arrive on the listing already pre-sold.
- Amazon Attribution links: Sellers can now track the exact ASIN-level impact of external traffic sources using Amazon Attribution tags. This makes off-Amazon marketing measurable for the first time — connecting social media, email, and influencer traffic to actual Amazon conversion data.
- Email list development: Collecting customer emails via package inserts (within Amazon’s communication policies), a brand website, or lead magnets creates a direct relationship that Amazon cannot restrict or monetize. Email lists are brand assets; Amazon customers are Amazon’s customers.
Protecting Your Account: The 2026 Suspension Risk Landscape

An Amazon suspension does not just pause your revenue — it freezes your FBA inventory, stops your advertising, destroys your ranking positions accumulated over months or years, and in severe cases, holds your payout balance for weeks or months during appeals. Understanding the risk landscape and proactively protecting against it is one of the highest-ROI activities a serious seller can undertake.
The Account Health Rating System
Amazon evaluates every seller account on a 0 to 1,000 Account Health Rating (AHR) scale. A score below 200 puts the account at risk of deactivation. The score is driven by three categories of metrics: customer experience (Order Defect Rate below 1%, return-related defects), shipping performance (Late Shipment Rate below 4%, Valid Tracking Rate above 95%), and policy compliance (the number and severity of policy violations).
A single critical policy violation can drop an AHR score dramatically. Amazon implemented AI-driven enforcement systems in 2025 and expanded them through early 2026 — meaning violations are increasingly detected and acted on automatically, without human review, and often without advance warning to the seller.
The Top Suspension Triggers in 2026
Based on the most common reinstatement cases handled by Amazon compliance specialists, the leading causes of account action in 2026 are:
- Inauthenticity complaints: This is the single most common cause. Receipts from retailers like Walmart, Target, or Costco are not sufficient documentation. Amazon now demands manufacturer invoices showing the supply chain from brand owner to the seller, with matching lot numbers or batch codes. Arbitrage sellers operating without proper documentation are particularly vulnerable.
- Intellectual property complaints: Any competitor or brand owner can file an IP complaint against a listing. Even when the complaint is unfounded, it triggers immediate listing removal and AHR impact. The countermeasure is proactive trademark registration and fast, documented responses to any complaint received.
- AI-generated content policy violations: Amazon updated its AI content policies on March 4, 2026, and began enforcing instant listing removal for non-compliant AI-generated images or descriptions. Sellers using AI tools to create listing content need to verify that the output meets Amazon’s guidelines before publishing.
- Review policy violations: Amazon’s January 7, 2026 update restricts review sharing across product variations in ways that previously were common practice. Sellers with multi-variation listings need to audit how reviews are attributed and consolidated across ASINs.
- Related account issues: Operating multiple seller accounts, or being associated with a suspended account through shared IP addresses, device fingerprints, or bank accounts, triggers automatic review and often suspension of the active account.
Building a Compliance Infrastructure
The sellers with the cleanest account health records do not simply avoid violations by accident — they build systematic processes to prevent them. This means:
- Maintaining a dedicated folder of manufacturer invoices for every ASIN in the catalog, updated with each new purchase order.
- Monitoring Account Health Rating daily (not weekly) and responding to any new notification within 24 hours.
- Keeping a documented Plan of Action template for the most common suspension types, so that if an account is hit, the response can be submitted within 48 to 72 hours rather than scrambling to understand the format under pressure.
- Using Amazon’s Account Health Assurance program (available to sellers with consistently high AHR scores) which provides a direct contact for account issues rather than going through standard seller support queues.
Scaling to Exit: What Acquirers Pay For and Why

Every Amazon business is either building toward a sale or building toward a job. The difference is not revenue — it is whether the business has the characteristics that make it valuable to someone else. Understanding how Amazon businesses are valued and what drives higher multiples is useful even if you never intend to sell, because the same characteristics that create exit value create operational resilience.
Current Valuation Multiples: The 2026 Landscape
Amazon FBA businesses are typically valued at a multiple of Seller’s Discretionary Earnings (SDE) — annual net profit plus the owner’s salary and any discretionary expenses run through the business. Current market multiples in 2026:
- Small owner-operated businesses ($500K to $2M revenue): 2.5x to 4.0x SDE. A business generating $180,000 in annual profit at a 3.5x multiple is worth approximately $630,000.
- Mid-market private label brands ($1M to $5M revenue): 4.2x to 5.8x SDE for strong private label assets, based on brand registry status, multi-year profit history, and low revenue concentration.
- Wholesale-focused businesses ($1M to $5M revenue): 2.8x to 3.5x SDE — lower than private label because wholesale accounts can be replicated by new entrants and the brand equity resides with the supplier, not the seller.
- Larger brands ($5M+ revenue): 4.5x to 7.0x SDE for top-performing private label brands with diversified catalogs, registered trademarks in multiple markets, and demonstrated off-Amazon revenue channels.
These multiples have compressed slightly from the 2021 peak when aggregators were paying 5x to 7x for almost any profitable FBA business. The current market is more discerning — acquirers are looking harder at risk factors and applying steeper discounts for businesses with identifiable vulnerabilities.
The Risk Factors That Kill Multiples
Understanding what deflates a valuation is as important as knowing what drives it up. The factors that most reliably compress multiples:
- Revenue concentration: If more than 30% to 40% of revenue comes from a single ASIN, acquirers price in the risk of that product losing rank, facing a new competitor, or being suppressed. Multi-ASIN catalogs with no single product above 20% of revenue command premiums.
- Single-channel dependency: A business that generates 100% of revenue from Amazon has acquirer risk baked in — any policy change, fee increase, or account action destroys the entire income stream. Businesses with meaningful revenue from a Shopify store, wholesale accounts, or other marketplaces are worth more.
- Supplier concentration: If 80% of COGS flows through a single supplier and that relationship is not contractualized, the acquirer is buying a fragile supply chain. Diversified sourcing with documented supplier agreements commands better terms.
- Owner dependency: Businesses where the owner handles all key supplier relationships, customer service escalations, and advertising management are not businesses — they are jobs with inventory. Documented processes, SOPs, and ideally a small team or VA structure signal that the business operates independently of any single person.
Building for Exit Value From Day One
The practical steps that increase exit value — and that simultaneously make the business more operationally sound regardless of exit plans:
- Register a trademark early. Brand Registry requires it, and acquirers will not pay private label multiples for a brand without trademark protection. File in your primary markets (US, EU, UK) as early as the business can justify the cost.
- Maintain clean, documented financials. Acquirers and their accountants will request 24 to 36 months of profit and loss statements, Amazon payout history, and COGS documentation. Sellers who have been running expenses through personal accounts or mixing business and personal finances face painful cleanup exercises at exactly the wrong time.
- Diversify revenue across at least 5 to 7 ASINs before considering a sale process. Single-product businesses are difficult to sell and price poorly relative to their actual earnings power.
- Document everything. Supplier contact details, reorder schedules, PPC campaign structures, listing optimization processes, and customer service workflows should all exist in written form — ideally in a shared system that a new owner can access on day one.
The Operational Disciplines That Separate Sustainable Sellers
Beyond the major strategic decisions, the day-to-day operational habits of consistently profitable Amazon sellers share a set of common characteristics. These are not glamorous — they do not make for compelling social media content — but they are what actually determines whether a business survives its first 24 months and whether it grows into something meaningful.
Weekly Business Review Cadence
Successful sellers at every revenue level set aside dedicated time — typically 2 to 4 hours on a fixed day each week — to review the same set of metrics: unit sales by ASIN, advertising ACOS and spend by campaign, account health score and any new notifications, inventory levels versus reorder points, and cash position versus outstanding purchase orders. This review is not about making reactive decisions — it is about catching drift early, before a slight change in a metric becomes a serious problem.
Inventory Management as a Competitive Advantage
Stockouts on Amazon are acutely damaging. When an ASIN goes out of stock, its ranking position drops almost immediately — and rebuilding that position after restocking requires advertising spend to recover what organic rank had previously delivered for free. Experienced sellers build reorder triggers based on days of inventory remaining (not units remaining) and maintain a safety stock buffer for their top-performing ASINs equivalent to 2 to 3 weeks of average velocity.
For sellers sourcing internationally, the buffer needs to account for the full lead time: manufacturing time, quality inspection, inbound freight (3 to 6 weeks by sea, significantly more expensive by air), customs clearance, and inbound FBA processing time. The sellers who never stock out are the ones who calculate this timeline accurately and reorder well before they intuitively feel they need to.
PPC as a Discipline, Not a Set-and-Forget Tool
Advertising on Amazon is a significant expense for most sellers — and one of the most frequently mismanaged. A healthy ACOS (Advertising Cost of Sale) target varies by category, margin, and business stage, but a general benchmark for established products is 15% to 25%. New products launching often run 40% to 60%+ ACOS during the ranking phase, with the expectation that organic rank will reduce advertising dependency over time.
The operational discipline of weekly bid reviews — checking search term reports for irrelevant traffic, negative matching converting terms that are spending without converting, and raising bids on converting terms that are positioned too low — is not exciting work. But it is where advertising efficiency is won or lost. Sellers who audit their campaigns weekly consistently outperform those who let campaigns run untouched for months.
Conclusion: Building an Amazon Business That Works Like a Business
The Amazon opportunity in 2026 is real, but the bar for capturing it has risen significantly. The easy wins — buying cheap products on Alibaba, creating a generic listing, and watching sales roll in — are long gone. The sellers generating meaningful, sustainable income from the platform are operating with the same rigor and discipline as any brick-and-mortar or service business would require.
The framework that ties everything in this guide together:
- Start with the right model for your capital, goals, and timeline. Private label for brand equity and margins. Wholesale for predictable cash flow and supplier moats. Arbitrage only as a learning vehicle or cash-flow bridge.
- Research products with data, not intuition. The demand-competition-margin trifecta is not a formula you apply once — it is a filter you run every time before committing capital.
- Match your fulfilment method to your product’s characteristics. FBA for standard, fast-moving items. FBM or 3PL for oversized, slow-moving, or low-margin products. Review this decision every time fee structures change.
- Manage cash as if the business depends on it — because it does. Buffer 90 days of operating capital. Understand your full cash cycle. Arrange financing proactively, not reactively.
- Build supplier relationships like long-term partnerships. The sellers with Tier A supplier access have a margin advantage that advertising spend cannot replicate.
- Protect your account with the same seriousness you protect your inventory. An account suspension is the most expensive event that can happen to an Amazon business. The compliance infrastructure to prevent it costs far less than the revenue lost during a suspension.
- Build for exit value from the beginning. Trademark registration, clean financials, diversified revenue, and documented processes are not end-of-journey tasks — they are habits that make the business more valuable and more resilient at every stage.
Amazon remains one of the most accessible pathways to building a meaningful e-commerce business in 2026. The sellers who approach it as a business — with clear models, rigorous research, disciplined operations, and a long time horizon — consistently produce outcomes that are nowhere near the $188 median profit figure. They are the ones in the top quartile, building something worth owning. The roadmap to join them is not a secret. It is a set of decisions, made consistently, over time.