
Most commentary on Amazon selling in 2026 swings between two moods. One says the marketplace is saturated, fees are crushing margins, and the window has closed. The other says Amazon is still the largest e-commerce opportunity in the Western world and anyone with a good product can win. Both are partly right, and the data explains why.
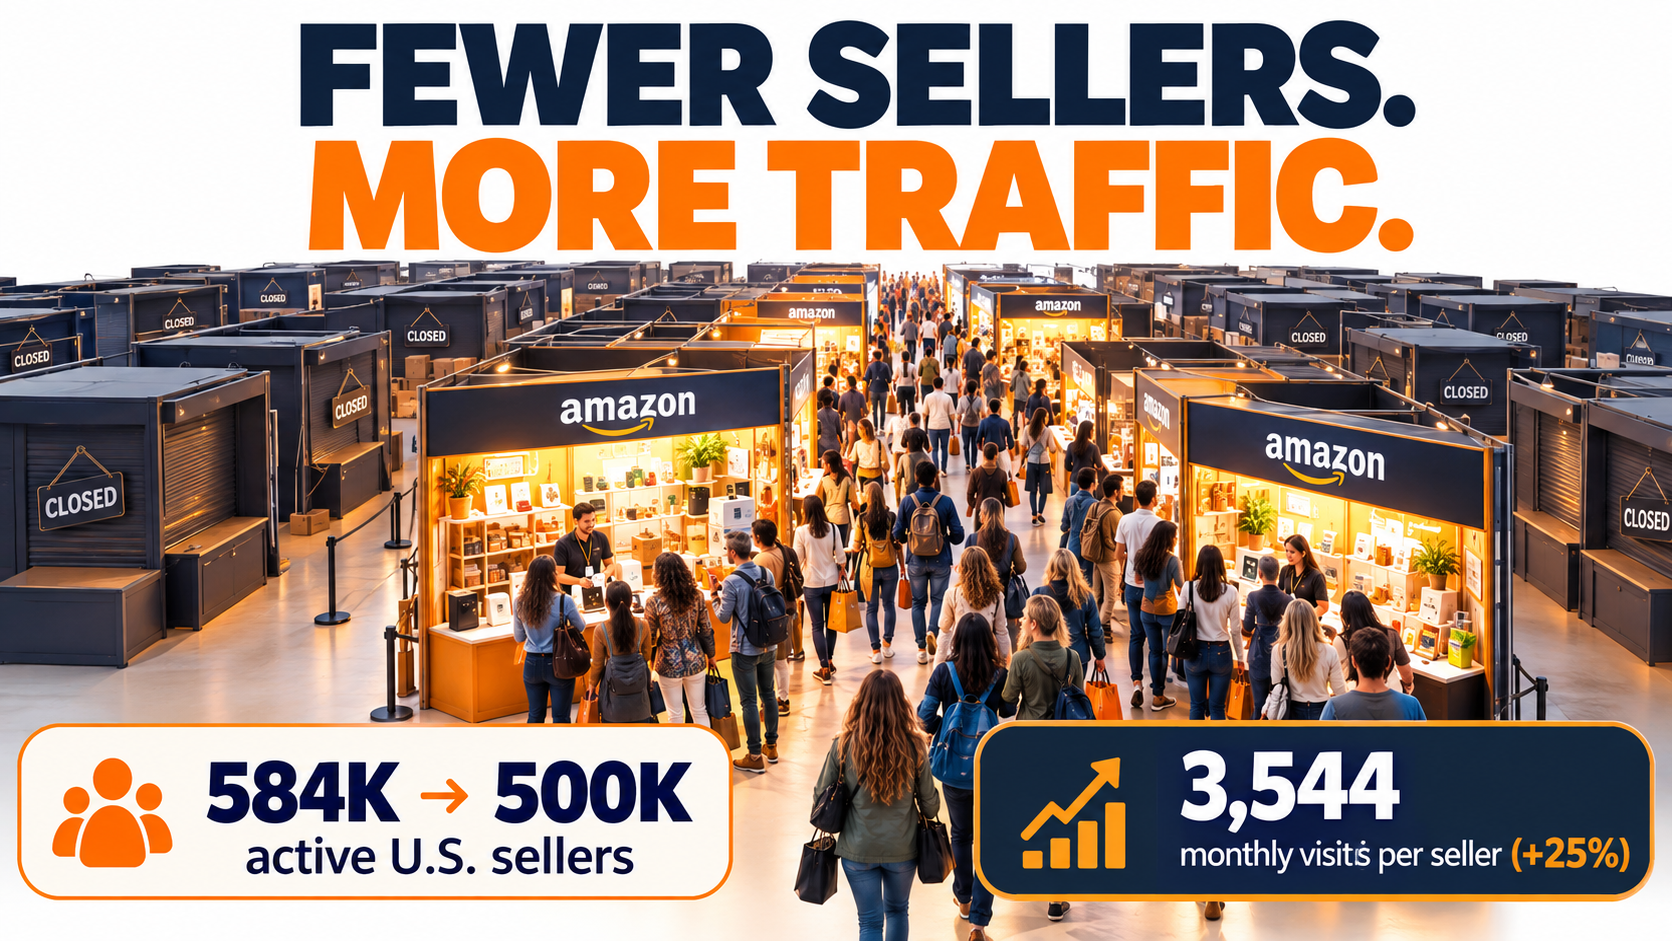
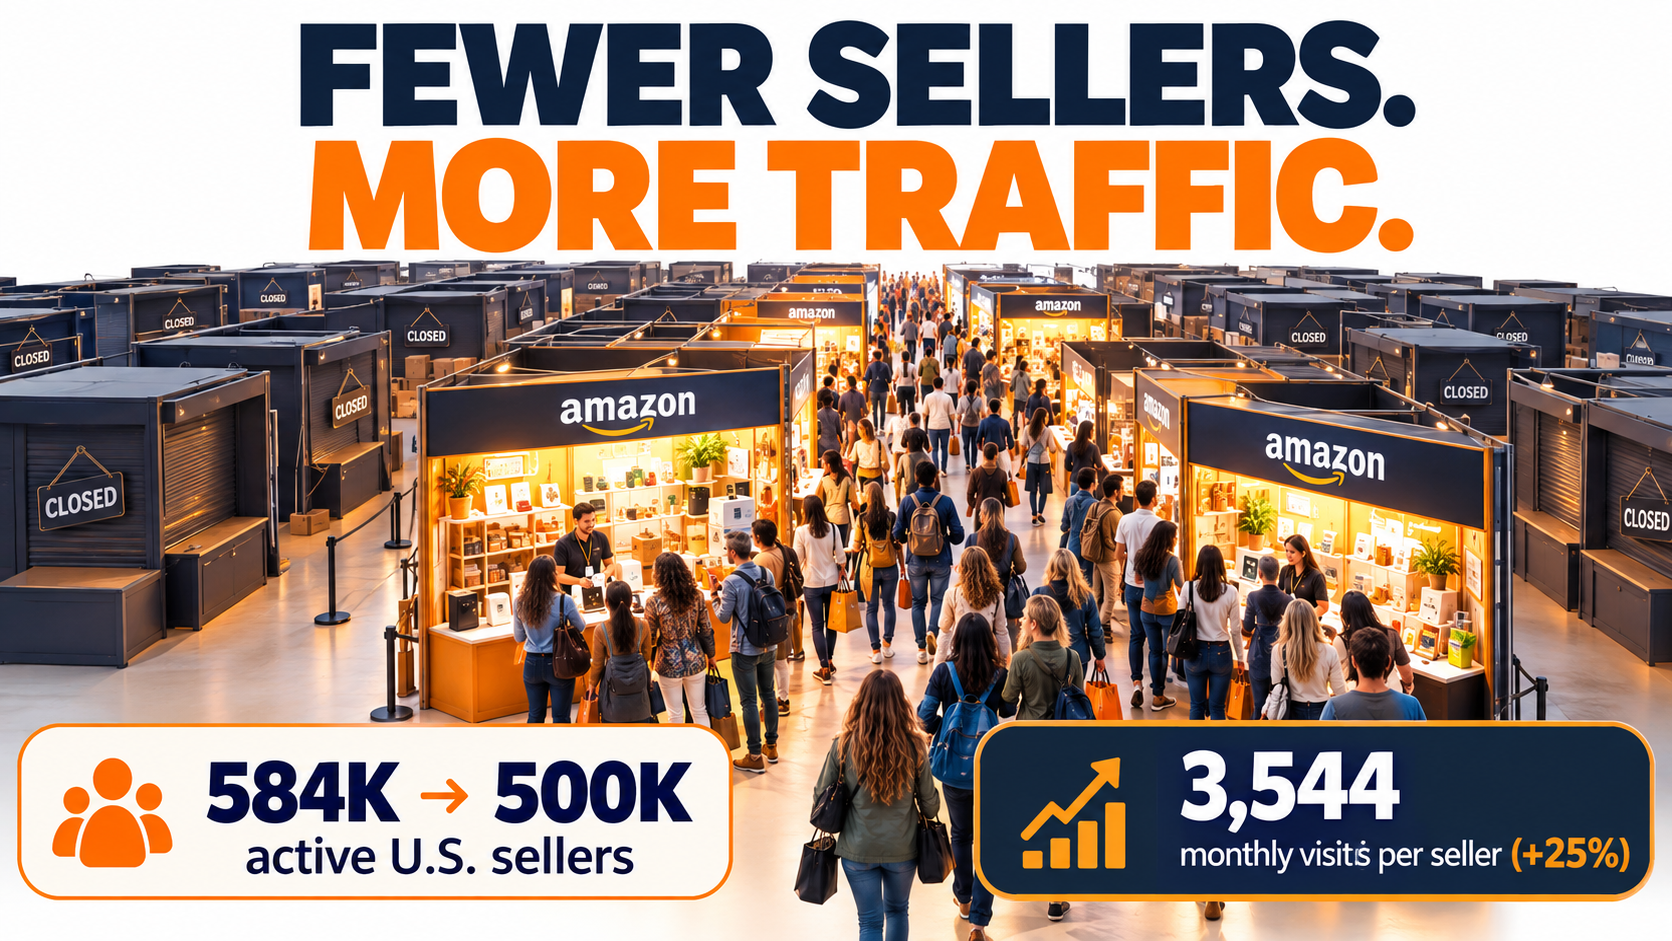
According to Marketplace Pulse, the number of active sellers on Amazon.com fell from 584,000 in January 2025 to 500,000 in March 2026. That’s roughly 84,000 businesses that stopped getting even a single feedback rating in a year. Over the same stretch, Amazon’s traffic kept growing. Traffic per active seller climbed 25% in a year to 3,544 monthly visits.
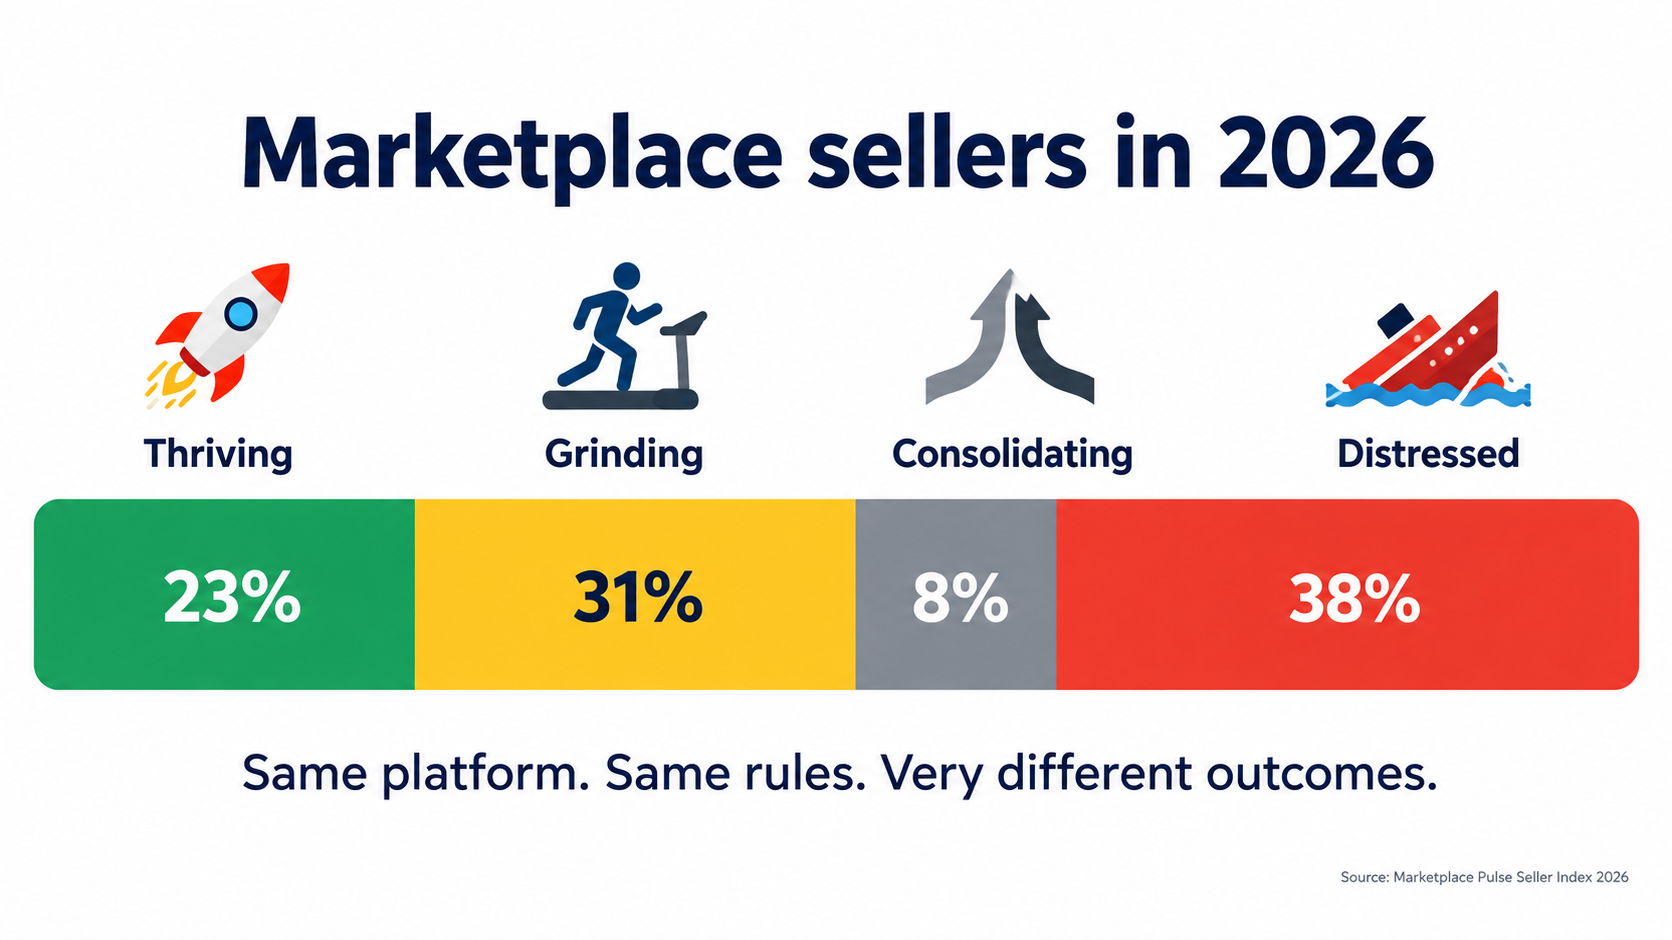
So the pie is getting bigger while fewer people split it. That should be good news for anyone still selling. Yet the 2026 Marketplace Pulse Seller Index found that only 23% of marketplace sellers are growing revenue and improving margins at the same time. Nearly half reported year-over-year margin decline.
This article doesn’t repeat the usual list of listing tips or PPC tactics. It looks at the structure of the marketplace as it stands in late 2026: who is leaving, who is taking their place, where the money goes, how Amazon’s AI assistant is quietly building a third route to visibility, and what Amazon itself is prioritizing. Each section ends with what it means for your business in practice.
If you sell on Amazon, or you’re deciding whether to start, this is the context that should shape your plans for the next 12 months.
The Shrinking Seller Base and the Growing Pie
For most of Amazon’s history, the supply of sellers looked limitless. Every year brought a new wave of private-label brands, arbitrage resellers, and factory-direct merchants. That stopped in 2025, and the reversal has continued into 2026.
What the numbers show
Marketplace Pulse defines an active seller as one that received at least one feedback in the past year. On that measure, the global active seller count across Amazon’s 23 marketplaces fell 16% to under 1.56 million. On Amazon.com alone, the count dropped from 584,000 to 500,000 between January 2025 and March 2026.
Meanwhile, SimilarWeb data cited by Marketplace Pulse shows combined web traffic across all Amazon marketplaces grew nearly 5% to 5.5 billion monthly visits. Demand went up. Supply went down.
The result is that average traffic per active seller rose 25% in a year. That single-year jump is bigger than the 31% increase the metric posted across the previous four years combined.
Why sellers are leaving
Marketplace Pulse points to several pressures arriving at once:
- Cost of goods: Tariffs and inflation have complicated sourcing over the last year.
- Price competition: Chinese sellers now make up more than half of Amazon’s active sellers globally and continue to push prices down.
- Operational sophistication: AI tools have raised the minimum standard for listings, imagery, and analytics, and established sellers are using them to extend their lead.
- Platform costs: Marketplace fees rank as the top margin concern among Amazon sellers, with advertising spend close behind.
None of these alone would push tens of thousands of sellers out. Together, they raise the minimum level of execution needed to stay profitable. Sellers who were marginal in 2023 are underwater in 2026.
The opportunity hidden in the decline
Marketplace Pulse’s own conclusion is worth stating plainly: “For sellers capable of executing at the standard the platform now demands, the share of customer attention available to each seller has never been greater.”
That’s the core tension of Amazon selling right now. The marketplace has not become less attractive. It has become less forgiving. The reward per seller is higher, and the bar for collecting it is higher too.
What this means for you: Stop measuring the opportunity by how crowded your category looks. Measure it by whether your operation can match the execution standard of the top sellers in that category. If it can, the shrinking field works in your favor.
Under 8,000 Sellers Now Generate Half of U.S. Third-Party Sales
The decline in seller count is only half the story. The other half is how concentrated revenue has become among the sellers who remain.
Concentration has doubled in under three years
Marketplace Pulse estimates that Amazon’s U.S. third-party GMV is around $300 billion. Fewer than 8,000 sellers now generate half of it. Less than three years ago, it took about 15,000 sellers to account for that same half.
Put differently, the top of the marketplace roughly halved in headcount while holding the same share of sales. Each of those top sellers is, on average, doing about twice the business share that a top seller did in 2023.
Top positions are sticky
Concentration would matter less if the leaderboard turned over quickly. It doesn’t. Marketplace Pulse found that 68.6% of today’s top 10,000 sellers on Amazon.com held that position a year ago, nearly identical to the 67% recorded in 2019. And 49.6% were already in the top 10,000 three years ago, up from 41% in 2019.
Holding a top position has become more durable, not less. Once a seller reaches scale, the combination of review history, sales velocity, ad budgets, and supplier terms tends to keep them there.
The pandemic cohort got squeezed
The age profile of top sellers tells a revealing story:
- Sellers registered before 2016 hold 21.9% of top-10,000 positions.
- Sellers registered 2016–2018 hold 27.4%.
- Sellers registered 2019–2021 hold just 17.5%, the thinnest cohort.
- Sellers registered 2022–2024 hold 26.9%.
- Sellers registered within the last eighteen months hold 6.3%.
Marketplace Pulse describes the 2019–2021 group as “a pandemic vintage that entered at the marketplace’s peak and has been squeezed from both directions since.” These sellers lack the veterans’ accumulated reviews and also lack the cost structure of the newest factory-direct entrants.
Half of today’s top sellers registered before 2019, down from over 60% a year earlier. Longevity still helps, but it is no longer the defining trait of the top tier.
What this means for you: If you entered Amazon between 2019 and 2021 and feel stuck, the data says you’re not imagining it. Your competitive position depends on picking a lane: either build defensible brand assets that veterans have, or rebuild your cost structure to compete with factory-direct sellers. Staying in the middle is the most exposed spot on the marketplace.
Thriving, Grinding, Consolidating, Distressed: The Four Seller Cohorts
Platform-wide numbers show growth. Seller-level numbers show divergence. The 2026 Marketplace Pulse Seller Index surveyed 181 marketplace sellers representing over $2 billion in combined annual revenue, and found four distinct groups operating under the same conditions with very different results.
The breakdown
- Thriving (23%): Revenue growing and margins improving at the same time.
- Grinding (31%): Revenue up, but margins flat or declining. Marketplace Pulse calls this “a potentially unsustainable treadmill.”
- Distressed (38%): At best, no growth in sight. At worst, both revenue and margins heading the wrong way.
- Consolidating (the remaining share): Sellers pulling back or restructuring rather than chasing growth.
The grinding trap
The grinding cohort deserves the most attention because it’s the easiest to fall into without noticing. Top-line revenue looks healthy. The business feels like it’s growing. But each additional dollar of sales costs more in advertising, fees, and discounting than the last.
This connects directly to the cost data. In the Seller Index, 49% of sellers active on Amazon named marketplace fees as their primary margin concern. Another 46% named advertising spend. Those are the two costs Amazon controls, and they’re the two that scale with revenue.
A seller can grow revenue 30% while profit stays flat if ad spend and fees grow faster than gross margin. That is the grinding pattern, and nearly a third of sellers are in it.
What separates the thriving group
The Seller Index doesn’t publish a single formula, but the surrounding data points in a consistent direction. The sellers pulling ahead tend to share a few traits:
- They track contribution margin per SKU after ads, not just gross margin or ACoS.
- They prune products that need constant ad support to hold rank.
- They use AI and automation for operations, not just content.
- They price for positioning rather than racing to the bottom with factory-direct competitors.
What this means for you: Run a simple test this quarter. Compare your revenue growth rate to your growth in total Amazon costs (referral fees, FBA fees, storage, and advertising). If costs are growing faster than revenue, you’re grinding. The fix usually isn’t more ad spend. It’s cutting the SKUs and campaigns that drag the average down.
The Cash Flow Squeeze Most Sellers Didn’t See Coming
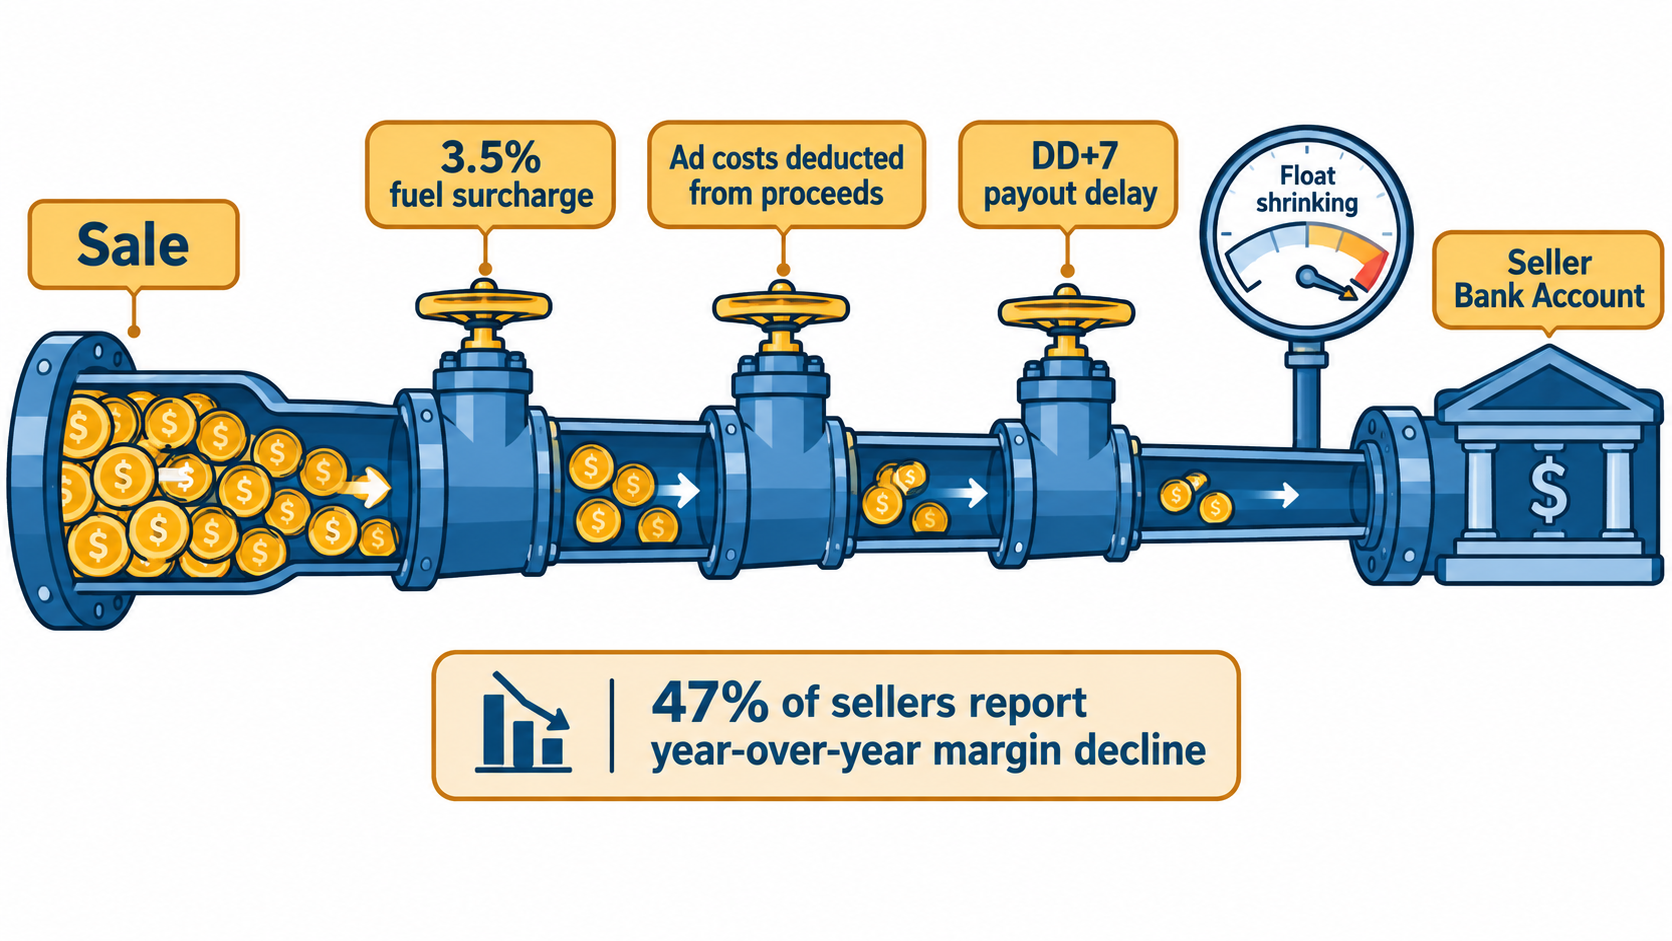
Margin gets most of the attention. In 2026, cash flow became just as pressing. Marketplace Pulse noted that the Seller Index survey captured sentiment before three rapid policy changes tested sellers’ finances.
Three changes, one effect
- A 3.5% fuel surcharge added a new cost layer on fulfillment.
- Automatic ad cost deduction from proceeds meant advertising would be paid out of seller balances rather than charged to a credit card. That removes the credit card cash-back and payment-term float many sellers depended on.
- DD+7 disbursement terms pushed payouts to seven days after delivery, lengthening the gap between selling a unit and receiving the cash.
Each change on its own is manageable. Combined, they remove financial float from sellers who are already watching margins shrink. With 47% of sellers reporting year-over-year margin decline, losing working capital at the same moment is painful.
The boycott and the rollback
Some sellers organized an advertising boycott for April 15. Amazon rolled back the ad payment change the day before, delaying it until August.
Marketplace Pulse estimated that even if 1,000 high-volume sellers boycotted for a full day, the impact would total roughly $3 million. That’s less than 2% of a typical day’s revenue from an ad business generating nearly $70 billion a year. In their analysis, the rollback was less about lost dollars and more about regulatory optics during the ongoing FTC antitrust case and managing seller sentiment as the active seller pipeline contracts.
Mutual dependence
Here’s the paradox. Half of Amazon sellers cite fees as a top-two cost pressure. Yet among sellers most frustrated with fees, only 24% are actively reducing Amazon’s share of their revenue, while 42% are growing it.
Amazon, for its part, depends heavily on those sellers. Third-party seller fees and advertising now generate roughly a third of Amazon’s total revenue. Third-party sellers account for about 60% of units and an estimated 69% of GMV. Marketplace Pulse describes this as a shift “from effectively unlimited supply to high-stakes mutual dependence.”
What this means for you: Build a cash flow model that assumes ad costs come out of proceeds and payouts arrive seven days after delivery. If your business only works with credit card float, fix that before August. Consider a dedicated line of credit for inventory so you’re not funding purchase orders from Amazon disbursements.
Who Is Taking the Empty Seats
The top 10,000 sellers on Amazon.com turn over at almost the same rate they did seven years ago. What has changed is who fills the open seats.
The headcount shift
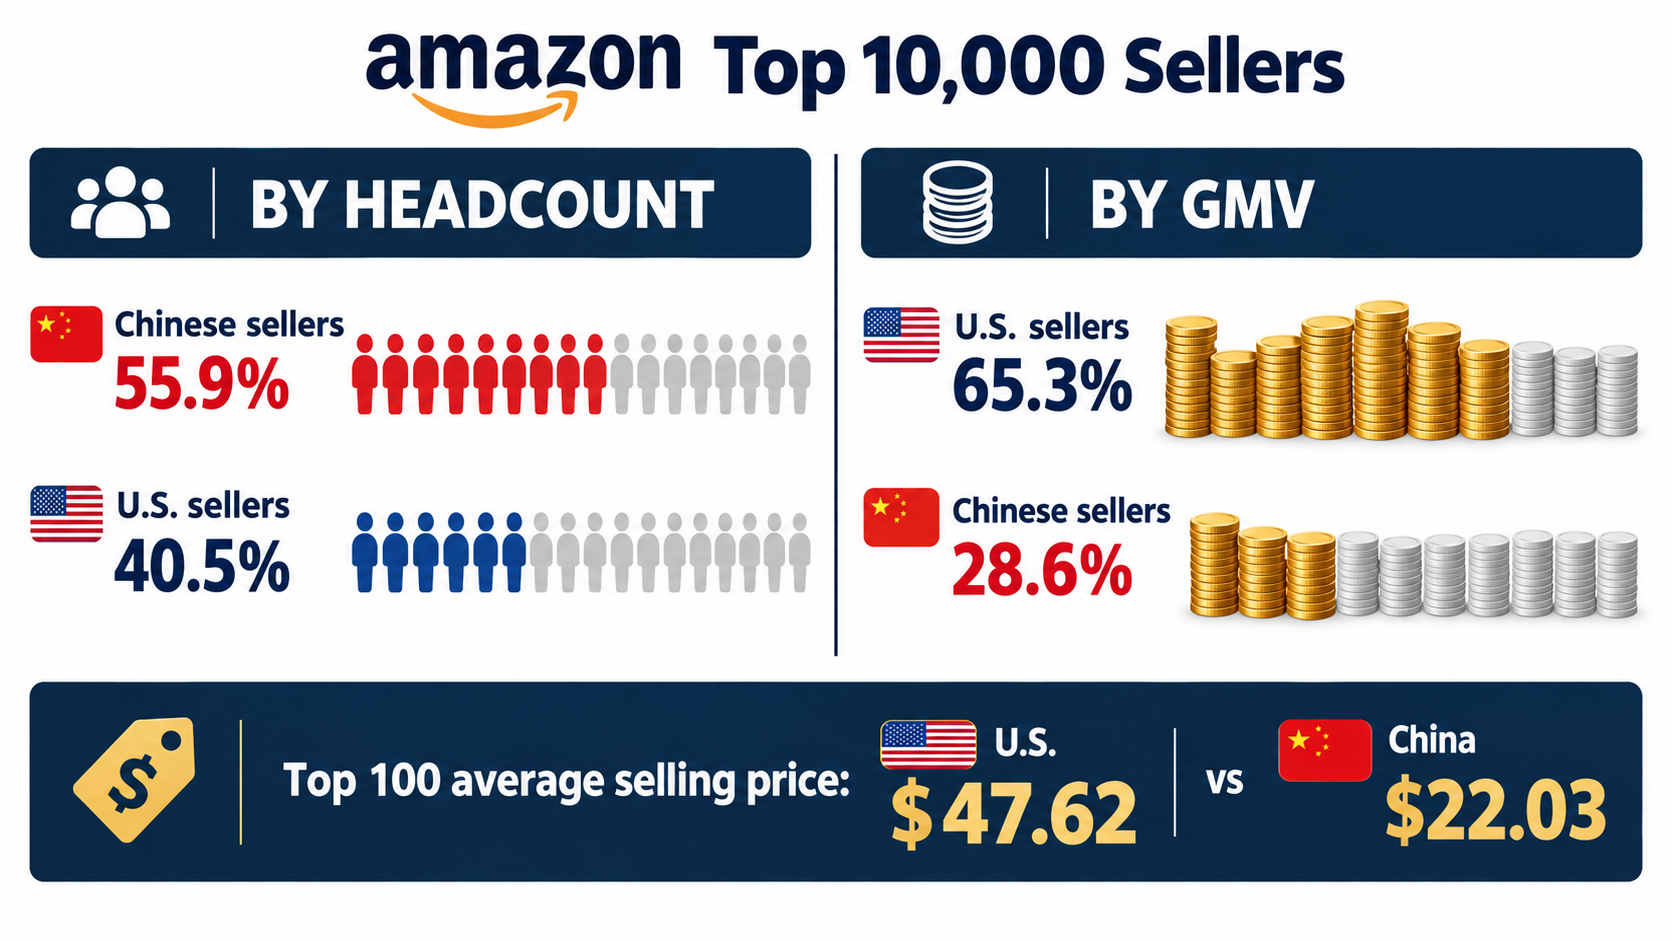
Since July 2020, Chinese sellers have gained 1,342 positions in Amazon’s U.S. top 10,000. U.S. sellers have lost 1,320. Chinese sellers went from 42.5% of the cohort to 55.9%. American sellers fell from 53.7% to 40.5%. In the past twelve months alone, 3.8 points of share moved.
Marketplace Pulse attributes this to several advantages: manufacturing proximity, direct factory relationships, export subsidies, and AI tooling that “erased the listing-quality gap once protecting domestic sellers.” Listing copy and product photography used to be a quiet moat for Western sellers. That moat is mostly gone.
The revenue picture is the opposite
Headcount overstates the reversal. U.S. sellers hold 65.3% of the GMV generated by the top 10,000, against 28.6% for Chinese sellers. That’s almost an exact inversion of the headcount split.
The gap is widest at the very top. American sellers make up 81.4% of the top 100 and produce 93.2% of its GMV. But they’re only 34% of the 5,001–10,000 band. Their average selling price is higher than Chinese sellers’ at every rank level, and most starkly in the top 100: $47.62 versus $22.03.
Two different games
The data suggests two distinct strategies are working on the same marketplace:
- Factory-direct volume: Lower prices, thinner margins per unit, heavy ad spend funded by cost advantages, and broad catalogs. This approach dominates the middle and lower bands of the top 10,000.
- Brand-led value: Higher average prices, stronger brand recognition, and established review histories. This approach still dominates the top 100 by both count and revenue.
Marketplace Pulse also notes that veterans built rank through organic position and review history, while that real estate “has steadily given way to sponsored placement.” Factory-direct entrants operating on thinner product margins can outspend veterans for it because their landed cost is lower.
What this means for you: If you’re a Western seller competing on a $15–25 commodity product, you’re playing the factory-direct game without the factory. The data favors moving up the price ladder: bundles, premium materials, brand storytelling, and products with a reason to cost more. The top 100 shows that brand-led sellers still win where price isn’t the main decision factor.
Volume Without Pricing Power: The 2026 Demand Picture
Jungle Scout’s Amazon Benchmark Report, which covers 2025 performance and 2026 strategy across 14 major categories, summarizes the demand environment in one line: growth is being driven by volume, not price.
Units are up, prices aren’t
Across categories, Jungle Scout found that unit growth is outpacing revenue growth. Demand is expanding, but sellers lack meaningful pricing power. Jungle Scout’s conclusion is that brands “must win through assortment, positioning, and conversion rather than price increases.”
This fits the broader e-commerce picture. Marketplace Pulse reported that U.S. e-commerce grew 12.2% in Q2 2026, its fastest pace in five years, reaching a record 17.1% of all retail spending. Shoppers are buying more online. They just aren’t accepting higher prices to do it.
Demand costs more to capture
Jungle Scout also flagged rising CPCs and fragmented category structures. Their phrasing: “Visibility is no longer guaranteed — it must be continuously earned.”
The scale of ad spending backs this up. Marketplace Pulse reported that sellers paid $68.62 billion for search ads in 2025 as ads continued to crowd around organic results. Amazon’s advertising revenue grew 22% on a constant-currency basis in Q1 2026 on a trailing base above $70 billion.
Execution beats scale
Jungle Scout’s third finding may be the most useful for smaller sellers. With stable first-party and third-party dynamics and mature category structures, structural advantages matter less than they used to. The report says brands that act quickly on search trends, pricing shifts, and assortment performance are outperforming those relying on legacy scale.
Putting it into practice
When you can’t raise prices and ads keep getting more expensive, margin has to come from somewhere else:
- Conversion rate: Every point of conversion improvement lowers your effective cost per acquisition without touching bids.
- Assortment: Variations, bundles, and size options let you capture more of each shopper’s basket.
- Repeat purchase: Subscribe & Save and consumable products spread acquisition cost across multiple orders.
- Landed cost: Supplier renegotiation, packaging redesign to drop a size tier, and freight consolidation all add margin that doesn’t depend on the shopper.
What this means for you: Assume no price increases in your 2026–2027 plan. If a product only works at a price 10% higher than today’s, it doesn’t work. Build your margin case on conversion, basket size, and cost reduction instead.
The Third Shelf: Amazon’s AI Assistant Doesn’t Read the Rankings
For two decades, Amazon visibility came from two places: organic search rank and paid placement. In 2026, there’s a third route, and it behaves differently from both.
Rufus became Alexa for Shopping
In May 2026, Amazon renamed its Rufus shopping assistant to Alexa for Shopping, folding the recommendation engine into a broader assistant. Usage has grown quickly. Amazon disclosed that Rufus monthly active users were up 115% year over year, engagement was up nearly 400%, and the assistant drove an estimated $12 billion in incremental sales.

What the assistant actually recommends
One of the first large-scale studies of Alexa for Shopping recommendations was run by Autopilotbrand.com, a vendor focused on AI visibility, and reported by Marketplace Pulse. It captured 1,963 non-branded queries and 12,810 recommendations in May and June 2026.
The study asked the assistant a “best of” question (for example, “what is the best queen mattress?”) and compared its picks against the plain category search (“queen mattress”). The findings:
- 63.9% of the assistant’s picks fell outside the organic top 10 for the matched search term.
- 40.9% never appeared on the visible search results page at all.
- Only 14.3% of picks were products running a sponsored listing on that search page.
- Of those sponsored picks, 83% already ranked organically anyway.
In plain terms, neither search rank nor ad spend appears to determine what the AI recommends. Marketplace Pulse called rank “the sharper omission” because it’s the metric Amazon teams build dashboards around, and “the one thing the assistant most conspicuously declines to follow.”
What gets a product picked
Christian Umbach, Co-Founder and CEO of Autopilotbrand.com, described the shift this way: “We’re seeing the emergence of a third shelf alongside organic search and paid placements. Brands cannot simply buy or rank their way onto it; they need to give Amazon’s AI Alexa enough context to understand when and why their product is the right recommendation.”
He pointed to richer catalog data, attention to shopper intent, and continuous updates as seasonal use cases and product differentiators change. He added: “For products that do not yet own the top of search, this creates an entirely new path to compete.”
The caveats
Marketplace Pulse was clear that this is a single snapshot from one U.S. account, captured early. It’s also worth remembering their warning: “Search looked like that once too, before the ad load found it.”
What this means for you: Audit your listings for context, not just keywords. Does your catalog data explain who the product is for, which problems it solves, which situations it fits, and how it differs from alternatives? Fill every relevant attribute field, answer common shopper questions directly in bullets and A+ content, and update use cases seasonally. This is the one surface where a product outside the top ten can currently appear above a category leader.
The Ads Are Coming to the AI Shelf
The third shelf is open for now. The monetization model around it is being decided in real time, and the direction is clear.
Sponsored prompts inside the assistant
Amazon launched Sponsored Products and Brand Prompts inside Rufus in Q1 2026. On its Q1 earnings call, Amazon disclosed that nearly 20% of shoppers who interact with a sponsored brand prompt continue the conversation about that brand.
CEO Andy Jassy explicitly cautioned that “it is early.” The figure also measures whether shoppers keep talking about the brand, not whether they buy. Still, it’s one of the first concrete performance data points any major platform has published on advertising inside an AI shopping interface.
The non-ad alternative disappeared
Six months earlier, there was a plausible alternative model. ChatGPT’s Instant Checkout charged a 4% transaction fee, offering broad merchant access without ads as the main discovery mechanism. That alternative is gone.
According to Marketplace Pulse, OpenAI launched advertising in ChatGPT in February 2026 for a select group of U.S. advertisers, abandoned Instant Checkout in March citing execution challenges, and in May opened its ads manager to all U.S. advertisers while dropping its $50,000 minimum spend.
Shopify, meanwhile, launched connector apps for ChatGPT and Claude so merchants can manage their stores inside whichever AI agent they prefer, citing internal data that 83% of its merchants already use ChatGPT. Rather than building a consumer-facing alternative, Shopify is placing merchants inside whichever surface wins.
The size of what’s at stake
McKinsey and ICSC forecast that U.S. agentic commerce will reach $1 trillion by 2030, citing that 68% of consumers used at least one AI tool for shopping in the past three months. Today’s Rufus and ChatGPT experiences sit at the assisted-discovery end of that spectrum, with recommendations and sponsored prompts rather than agents independently completing purchases.
Marketplace Pulse’s conclusion is blunt: the convergence “eliminates the most plausible non-ad path to scale in agentic commerce.”
Timing matters
That makes the current window valuable. Right now, the AI shelf rewards catalog quality and context more than rank or budget. Over time, sponsored placements will likely take a growing share of that surface, just as they did on search.
What this means for you: Treat the next 6–12 months as the period to earn organic AI visibility while it’s still relatively cheap. Track which of your products appear when you ask the assistant category questions. Test Sponsored Prompts with a small, measured budget so you learn how they perform before competition raises the price. The sellers who learn how the AI shelf selects products now will be the first to notice when that changes.
Where Amazon’s Own Priorities Are Heading
Sellers often treat Amazon as a fixed backdrop. It isn’t. Amazon’s own growth mix is shifting, and that shapes the policies sellers live under.
First-party is regaining unit share
Third-party sellers accounted for 60% of paid units sold on Amazon in Q1 2026, down from 61% in Q4 2025 and 62% the quarter before. It’s the first time the metric has fallen for two consecutive quarters since Amazon began reporting it in 2004.
Groceries appear to be the main driver. Paid unit growth hit 15% in Q1, the highest since the end of COVID lockdowns. Amazon said perishable sales grew 40x year over year. Its broader grocery business reached $150 billion in gross sales in 2025, roughly 18% of its estimated $830 billion total GMV. Most of that flows through Amazon’s own grocery network, not the third-party marketplace.
Ads and AWS are the growth engines
Online stores fell to 35.4% of Amazon’s net sales in Q1 2026, an all-time low since the segment was first broken out in 2016. Third-party seller services edged down to 22.9% from 23.5%. Both segments grew in absolute terms, with online stores up 9% and seller services up 12% on a constant-currency basis, but advertising grew 22% and AWS grew 28%.
Marketplace Pulse summarized it this way: “The marketplace continues to grow, but Amazon’s growth story is increasingly being told outside it — in AWS, in advertising, and in the agentic commerce layer now being built on top of both.”
Other surfaces worth knowing
- Amazon Business reached $60 billion in annualized gross sales, up from $35 billion in 2023 and $25 billion in 2021. Marketplace Pulse estimates it represents roughly 7% of Amazon’s GMV.
- Amazon Haul, the direct-from-China section for items under $20, passed 3,000 sellers after launching in November 2024, positioning Amazon against Temu and Shein.
Why this matters to third-party sellers
When advertising grows faster than the marketplace itself, Amazon’s incentives lean toward more ad inventory, including on new surfaces like AI assistants. When first-party grocery grows quickly, Amazon has less need to court marginal third-party sellers. Neither trend is hostile, but both suggest sellers should expect continued ad-led monetization rather than relief on fees.
What this means for you: If you sell products with business use cases, look at Amazon Business pricing tiers and quantity discounts. That $60 billion channel is often less ad-saturated than consumer search. And if you sell low-priced commodity goods, recognize that Haul puts factory-direct pricing under Amazon’s own banner. Plan your positioning accordingly.
Seller Central Becomes the Multichannel Hub
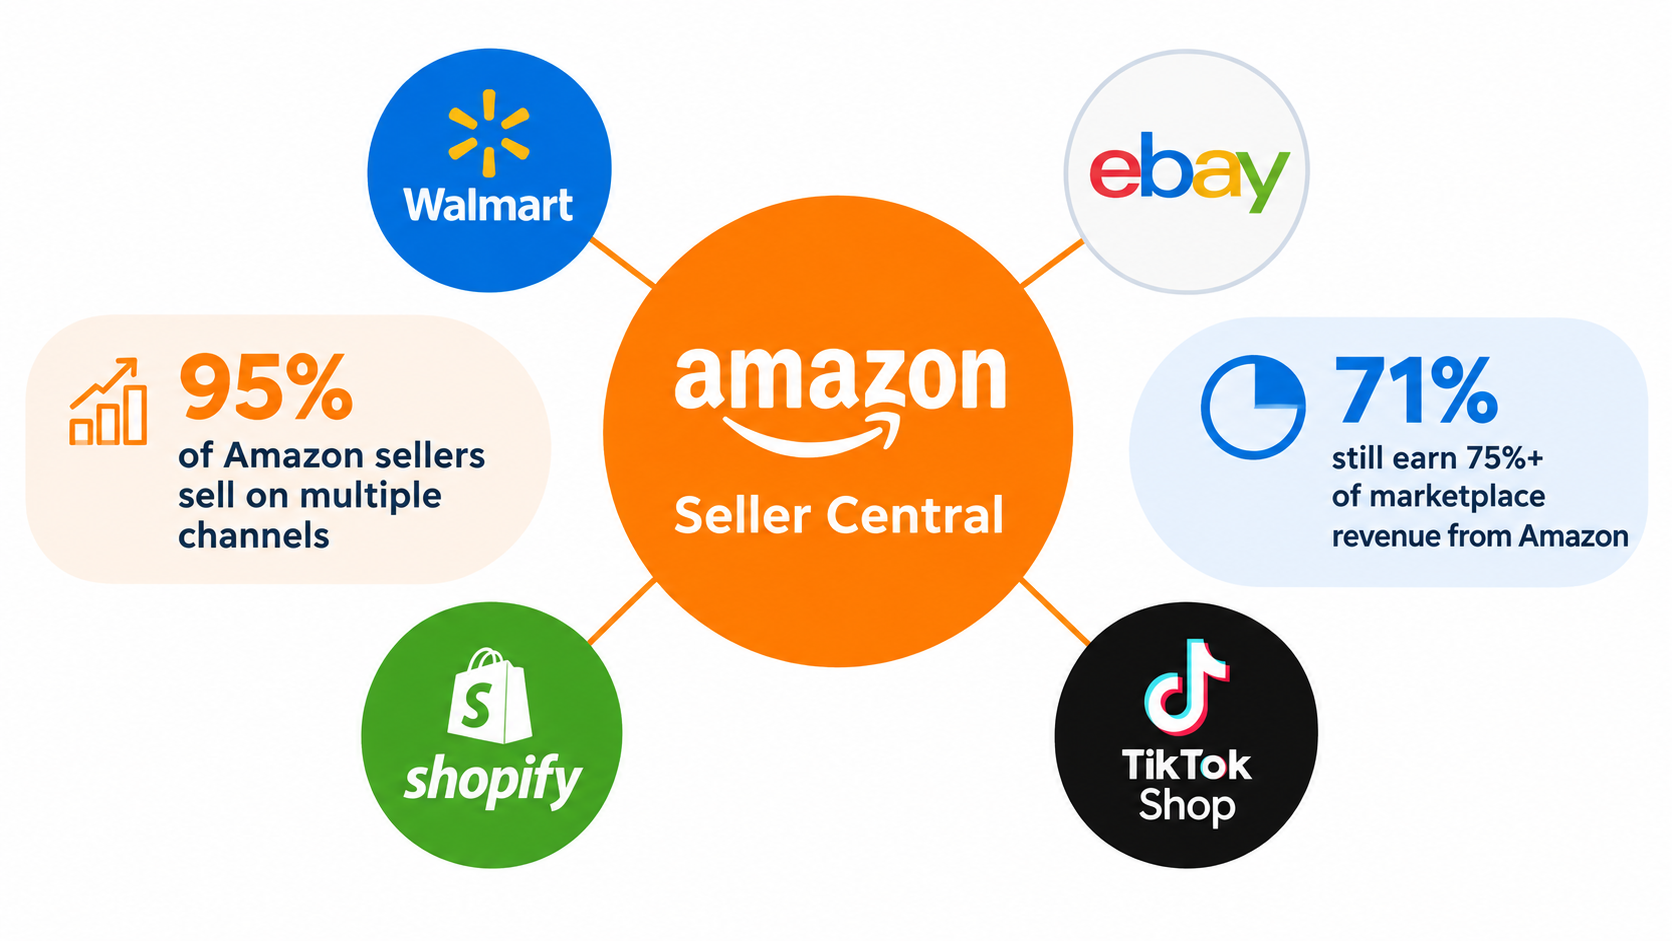
At its Accelerate conference in September 2026, Amazon announced that sellers will be able to manage their eBay, Shopify, TikTok Shop, and Walmart businesses from inside Seller Central. The tools are rolling out gradually to U.S. sellers at no extra cost.
What the tools do
According to Marketplace Pulse, a seller can edit a product description once, and Amazon reformats and publishes it to linked listings on eBay, Walmart, and Shopify. Shopify and Walmart orders show up alongside Amazon orders and can be fulfilled through Amazon in a few clicks. A profitability view shows what each product earns on each channel.
This caps a five-year shift. Amazon went from a platform whose policies made selling elsewhere harder, to Buy with Prime for independent sites, to Multi-Channel Fulfillment serving more than 200,000 U.S. sellers with order volume up 70% (as of Accelerate 2024), to MCF integrations with Walmart and Shein in 2025. Now Amazon sits in front of the other channels, not just behind them.
Multichannel isn’t the same as diversified
Amazon says more than 95% of its sellers sell on multiple channels. But according to the Marketplace Pulse 2026 Seller Index, 71% of Amazon-primary sellers active on at least one other marketplace still earn three-quarters or more of their marketplace revenue from Amazon.
Amazon has long tracked what sellers charge elsewhere, and products priced lower on other sites can still be suppressed. With these tools, Amazon can also see how much sellers sell elsewhere, though it says that data won’t inform its retail business.
The Walmart factor
Other marketplaces are gaining ground. Walmart’s U.S. third-party marketplace grew nearly 50% in the first quarter of its fiscal 2027, its fastest pace in years. Still, scale differences remain large. Marketplace Pulse estimates Amazon’s U.S. third-party sales at about $300 billion, more than seven times eBay’s and roughly 20 times Temu, TikTok Shop, and Walmart, which compete in a $15–22 billion range.
The overlap between platforms is also smaller than many assume. One in five of TikTok Shop’s hundred largest U.S. sellers ranks in Amazon’s top 10,000. Only one in twenty-five of Amazon’s hundred largest ranks in TikTok Shop’s top 10,000. Different platforms reward different products and skills.
What this means for you: Use the new tools for convenience, but be deliberate about what genuine diversification looks like. Track the share of revenue from non-Amazon channels as a separate KPI. Keep pricing consistent across channels to avoid suppression. And consider whether a channel like Walmart, growing from a small base, deserves dedicated effort rather than a mirrored catalog.
Beyond Amazon.com: Where Traffic Per Seller Is Rising Fastest
U.S. sellers often treat international marketplaces as an afterthought. The 2026 data suggests that’s worth reconsidering, with some important caveats.
The fastest-growing marketplaces for seller attention
Traffic per seller rose 19% in the U.S., which is meaningful but actually the smallest gain among Amazon’s top ten marketplaces. Elsewhere, Marketplace Pulse found:
- Brazil: Amazon.com.br added 36 million monthly visits while active sellers declined 23%, lifting visits per seller 57%.
- Mexico: A similar gain to Brazil.
- France, the Netherlands, and Poland: Visits per seller up more than 40%.
- India: Comparable growth, though foreign direct investment rules essentially restrict the marketplace to locally registered sellers.
- Saudi Arabia: The highest traffic per seller of any Amazon marketplace at 9,980 visits, inherited from the 2020 Souq transition, though its low absolute traffic ceiling limits which categories can support a business.
- Australia: The only Amazon marketplace where active seller numbers grew over the past year.
The U.S. is still the main event
Even so, the U.S. remains the strongest absolute opportunity. Marketplace Pulse calculated that revenue per seller in the U.S. is more than $200,000 above the next-largest market. Amazon’s top ten marketplaces account for 92% of both global traffic and active sellers, and the U.S. share of global marketplace traffic only slipped from 46% to 45%.
How to think about expansion
Global expansion makes the most sense for sellers who already have a profitable U.S. operation and a product that travels well (compliance, sizing, and language-light). For them, markets with rising traffic per seller and fewer competitors can offer lower ad costs and easier rank.
For sellers still in the grinding or distressed cohorts, adding a new marketplace usually multiplies complexity before it adds profit.
What this means for you: If your U.S. business is thriving, run a test in one European market or Mexico with your top three SKUs. Use Amazon’s unified account tools and remote fulfillment options where available to keep the test lean. Measure contribution margin after ads, not just revenue.
A 90-Day Action Plan for Amazon Sellers in Late 2026
The data above points to a fairly clear set of priorities. Here’s how to translate it into work over the next three months.
Days 1–30: Diagnose
- Identify your cohort. Compare revenue growth against margin trend over the past 12 months. Are you thriving, grinding, or distressed? Be honest.
- Calculate SKU-level contribution margin after ads. Include referral fees, FBA fees, storage, the fuel surcharge, returns, and ad spend attributed to each product.
- Stress-test cash flow. Model DD+7 payouts and ad costs deducted from proceeds. Find the month where cash gets tightest.
- Map your competitive position. For each core product, note whether you’re competing against factory-direct sellers on price or brand-led sellers on value.
Days 31–60: Restructure
- Cut the drag. Discontinue or reduce ad support for SKUs with negative contribution margin unless they serve a clear strategic purpose.
- Move up the price ladder where you can. Develop bundles, premium versions, or differentiated variants for products stuck in price wars.
- Rebuild listings for the AI shelf. Fill every attribute, write bullets that state use cases and who the product is for, and answer common comparison questions in A+ content.
- Secure working capital. Arrange inventory financing that doesn’t rely on Amazon disbursement timing.
Days 61–90: Test and expand
- Audit AI visibility. Ask Alexa for Shopping “best of” questions in your categories monthly and record which products appear.
- Run a small Sponsored Prompts test with a fixed budget and clear success criteria.
- Check Amazon Business fit for any product with office, workplace, or bulk use cases.
- Pick one diversification bet, whether Walmart, a single international Amazon marketplace, or your own site with Buy with Prime, and track its revenue share as its own KPI.
Metrics to watch
- Contribution margin per unit after ads, by SKU
- Total Amazon costs as a percentage of revenue, monthly
- Conversion rate on top ten SKUs
- Share of revenue from non-Amazon channels
- Number of AI assistant recommendations captured in your category
Conclusion: A Marketplace That Rewards Fewer, Better Operators
The story of Amazon selling in 2026 isn’t decline. It’s selection. Roughly 84,000 active U.S. sellers dropped off in about 14 months, while traffic kept climbing and each remaining seller saw more potential customers than ever. Fewer than 8,000 sellers now account for half of U.S. third-party sales.
The sellers capturing that attention share a few traits. They track profit after ads, not revenue. They avoid competing on price against sellers with lower landed costs. They build listings that give Amazon’s AI enough context to recommend them. And they plan for a platform whose growth increasingly comes from advertising and its own first-party business.
Key takeaways
- The field is shrinking, the pie is growing. Traffic per active seller rose 25% to 3,544 monthly visits. The opportunity per seller is bigger, but so is the execution bar.
- Most sellers aren’t thriving. Only 23% are growing revenue and margins together. Check whether you’re grinding before adding spend.
- Cash flow is the new pressure point. The fuel surcharge, ad deduction from proceeds, and DD+7 payouts cut into float. Plan for them now.
- Price leadership favors factory-direct sellers. Brand-led sellers still dominate the top 100 with average prices more than double those of Chinese sellers.
- Don’t plan on price increases. Growth is coming from volume. Margin has to come from conversion, assortment, and cost.
- The AI shelf is open, for now. 63.9% of Alexa for Shopping picks came from outside the organic top ten. Catalog context matters more than rank there today.
- Multichannel tools aren’t diversification. Measure non-Amazon revenue share deliberately.
Amazon remains, by a wide margin, the largest marketplace opportunity in the U.S. The difference in 2026 is that the platform no longer carries average operators. It rewards sellers who know their numbers, pick a clear position, and adapt quickly as new surfaces like the AI shelf take shape. If that describes your business, or can describe it within the next 90 days, the shrinking seller count works in your favor.