
Most talk about selling on Amazon comes down to tactics: better main images, tighter keyword targeting, smarter bids. Those things still matter. But a run of data published through 2026 points to something tactics alone can’t fix. The ground under Amazon sellers has moved, and it has moved in a direction most sellers aren’t measuring.
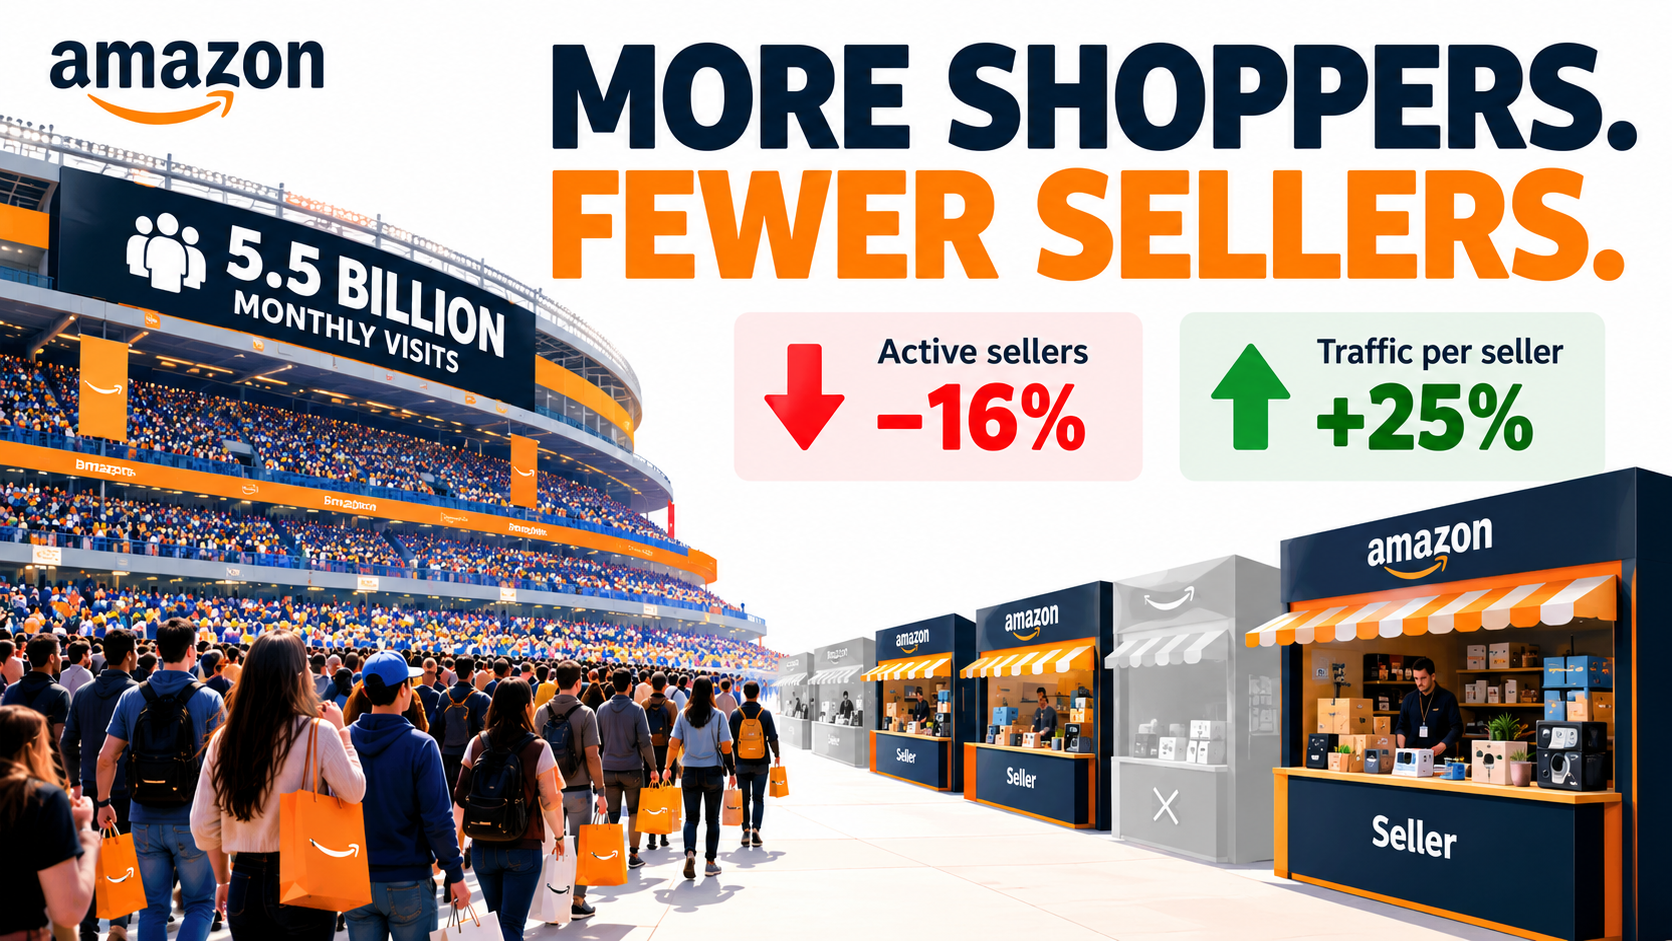
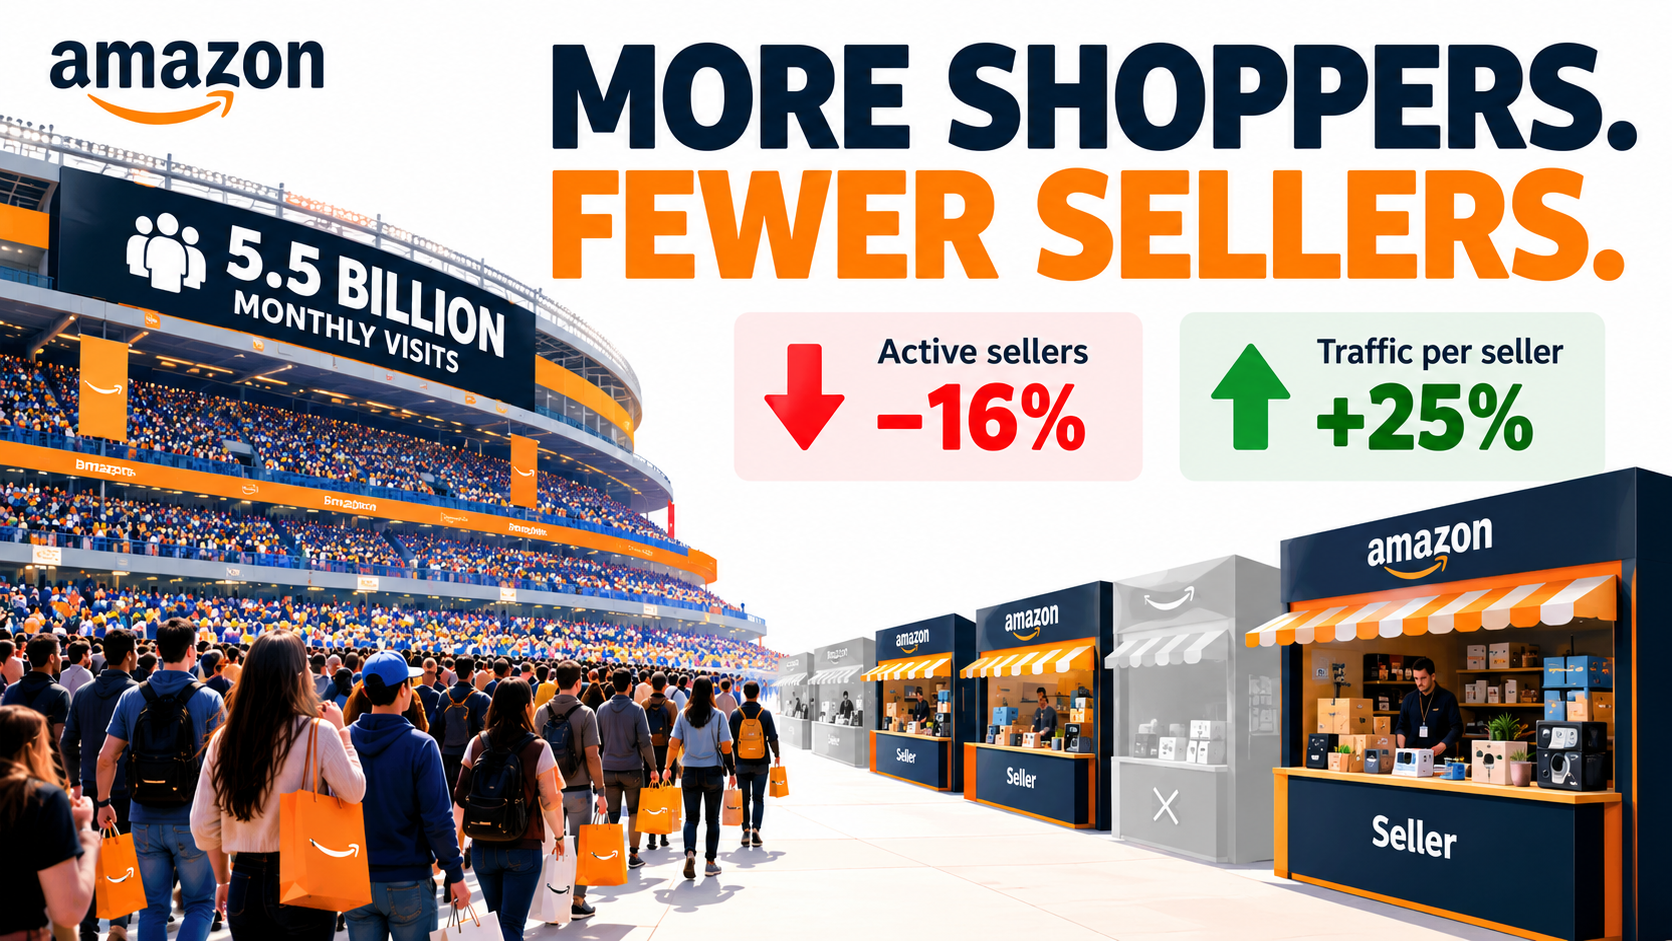
Here’s the core of it. Across Amazon’s 23 marketplaces, combined web traffic grew nearly 5% to about 5.5 billion monthly visits. Over the same period, the number of active sellers fell 16% to under 1.56 million, according to Marketplace Pulse, which tracks millions of public seller storefronts. More shoppers, fewer sellers. On paper, that should be the best setup for sellers in years.
For some, it is. For many others, it isn’t. The same research shows that fewer than 8,000 sellers now produce half of Amazon’s U.S. third-party GMV. Only 23% of surveyed sellers are growing revenue and margins at the same time. And Amazon’s own AI shopping assistant, now called Alexa for Shopping (formerly Rufus), turns out to recommend products that search rank mostly ignores.
This article doesn’t hand you another tactics list. It walks through the structural shifts reshaping Amazon selling in 2026: who is taking the top seats, why one seller cohort is quietly losing ground, how a “third shelf” of AI-driven discovery is forming, and what Amazon’s new multichannel tools mean for your dependence on the platform. Each section ends with practical implications, and the conclusion pulls them together into a 90-day plan.
If you sell on Amazon, or you’re deciding whether to start, this is the context that should sit underneath every tactical decision you make this year.
A Bigger Pie, Fewer Forks: The Traffic-Per-Seller Shift
The cleanest way to see Amazon’s 2026 situation is one metric: traffic per active seller. Marketplace Pulse reports that average traffic per active seller on Amazon climbed 25% in the past year to 3,544 monthly visits. That’s a sharp jump. The same metric rose 31% across the previous four years combined.
Two forces are behind it. Demand is growing. Supply, measured as the number of sellers actively making sales, is shrinking. Marketplace Pulse defines an active seller as one that got at least one feedback in the past year, so these aren’t dormant accounts being cleaned out. They’re businesses that stopped trading.
Why sellers are leaving
The research names several pressures converging at once:
- Cost of goods volatility. Tariffs and inflation have made landed costs harder to predict and harder to pass on.
- Pricing competition. Chinese sellers now make up more than half of Amazon’s active sellers globally and keep pushing prices down.
- Operational sophistication. AI has raised the bar, and established sellers are using it to widen their lead.
- Fees and ad costs. Marketplace fees rank as the top margin concern among Amazon sellers, closely followed by advertising spend.
None of these alone would push out 16% of the active base. Together, they squeeze the middle: sellers too small to win on scale and too undifferentiated to win on brand.
The demand side is healthy
Meanwhile, e-commerce demand is in better shape than it has been in years. U.S. e-commerce grew 12.2% in the second quarter of 2026, its fastest pace in five years, and reached a record 17.1% of all retail spending. That was the second straight quarter of double-digit growth after four years without one.
Amazon is still by far the biggest venue for that demand. Marketplace Pulse estimates Amazon’s U.S. third-party sales at about $300 billion, more than seven times eBay’s and roughly 20 times the next tier of competitors (Temu, TikTok Shop, and Walmart), which sit in a tight $15–22 billion range.
What this means for you
Rising traffic per seller doesn’t mean every listing gets more visits. It means the available attention per seller is larger. Whether you capture it depends on everything covered in the rest of this article. Still, it’s a meaningful reframe. If you’ve been treating Amazon as a saturated market where nobody new can win, the numbers say otherwise. The marketplace is consolidating, not filling up.
Fewer Than 8,000 Sellers Now Own Half of U.S. Third-Party GMV
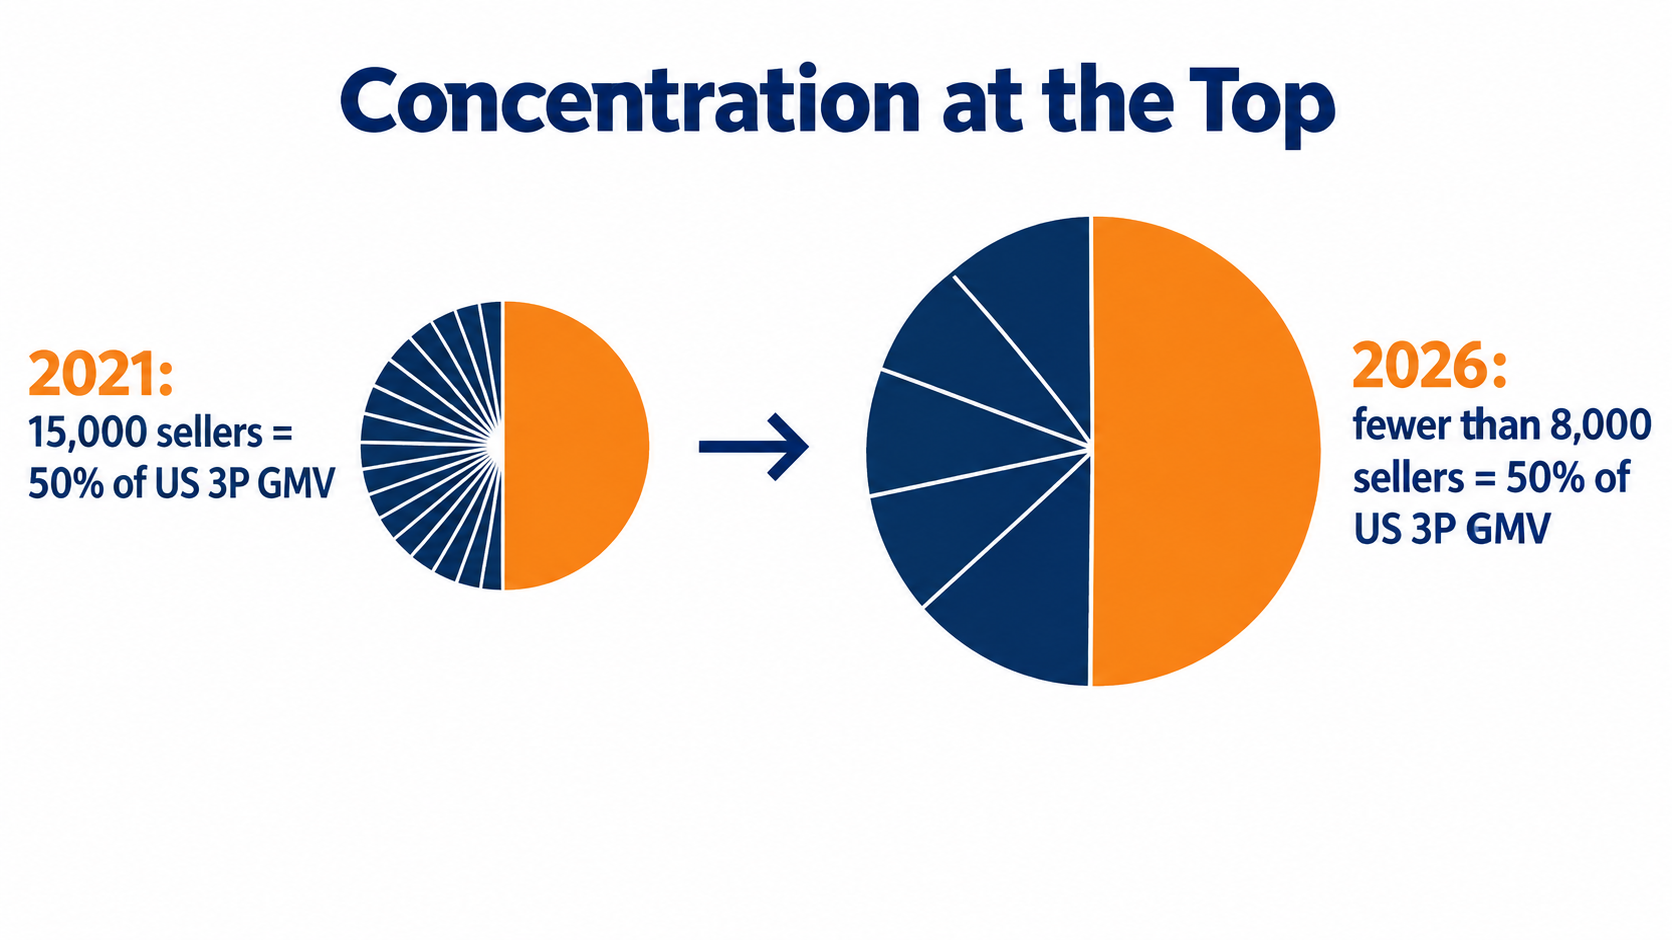
If traffic per seller is the optimistic number, concentration is the sobering one. Marketplace Pulse reports that fewer than 8,000 sellers now generate half of Amazon’s U.S. third-party GMV. Less than three years ago, it took about 15,000 sellers to reach that same halfway mark.
Put plainly, the top of the marketplace is getting heavier. The pie is bigger, but a smaller group is taking a larger share of it.
Top positions are getting stickier
Concentration isn’t only about GMV share. It also shows up in how long sellers hold their positions. In its analysis of Amazon.com’s top 10,000 sellers, Marketplace Pulse found that 68.6% of today’s top sellers held that position a year ago, compared with 67% in 2019. Nearly half (49.6%) were already in the top 10,000 three years ago, up from 41% in 2019.
So turnover at the top runs at roughly the same rate it did seven years ago, but those who make it are staying longer. In the researchers’ words, holding a top position “has become more durable, not less.”
The pattern isn’t unique to Amazon
It would be easy to blame concentration on Amazon’s fees or algorithm. But the same shape appears elsewhere. On TikTok Shop, a platform designed to flatten outcomes through creator-driven discovery, Marketplace Pulse found that the top 1% of sellers drive 60% of U.S. GMV. Concentration seems to be what mature marketplaces do, not a quirk of one company’s policies.
Practical implications
- Benchmark against the right peers. If you’re outside the top few thousand sellers, “category average” metrics are skewed by a small number of very large operators. Compare yourself with sellers at a similar revenue level.
- Expect incumbents to hold position. Since top positions are stickier, a frontal attack on a category leader’s main keyword is expensive. Look for adjacent use cases, variations, or price points the leaders don’t serve well.
- Treat operational capability as a moat. The sellers consolidating share aren’t just lucky. They tend to run tighter inventory, faster creative testing, and more disciplined ad accounts.
Who Is Taking the Seats: China’s Headcount Win vs. America’s Value Win
The top 10,000 sellers on Amazon.com turn over at about the same rate they always have. What has changed is who fills the open seats.
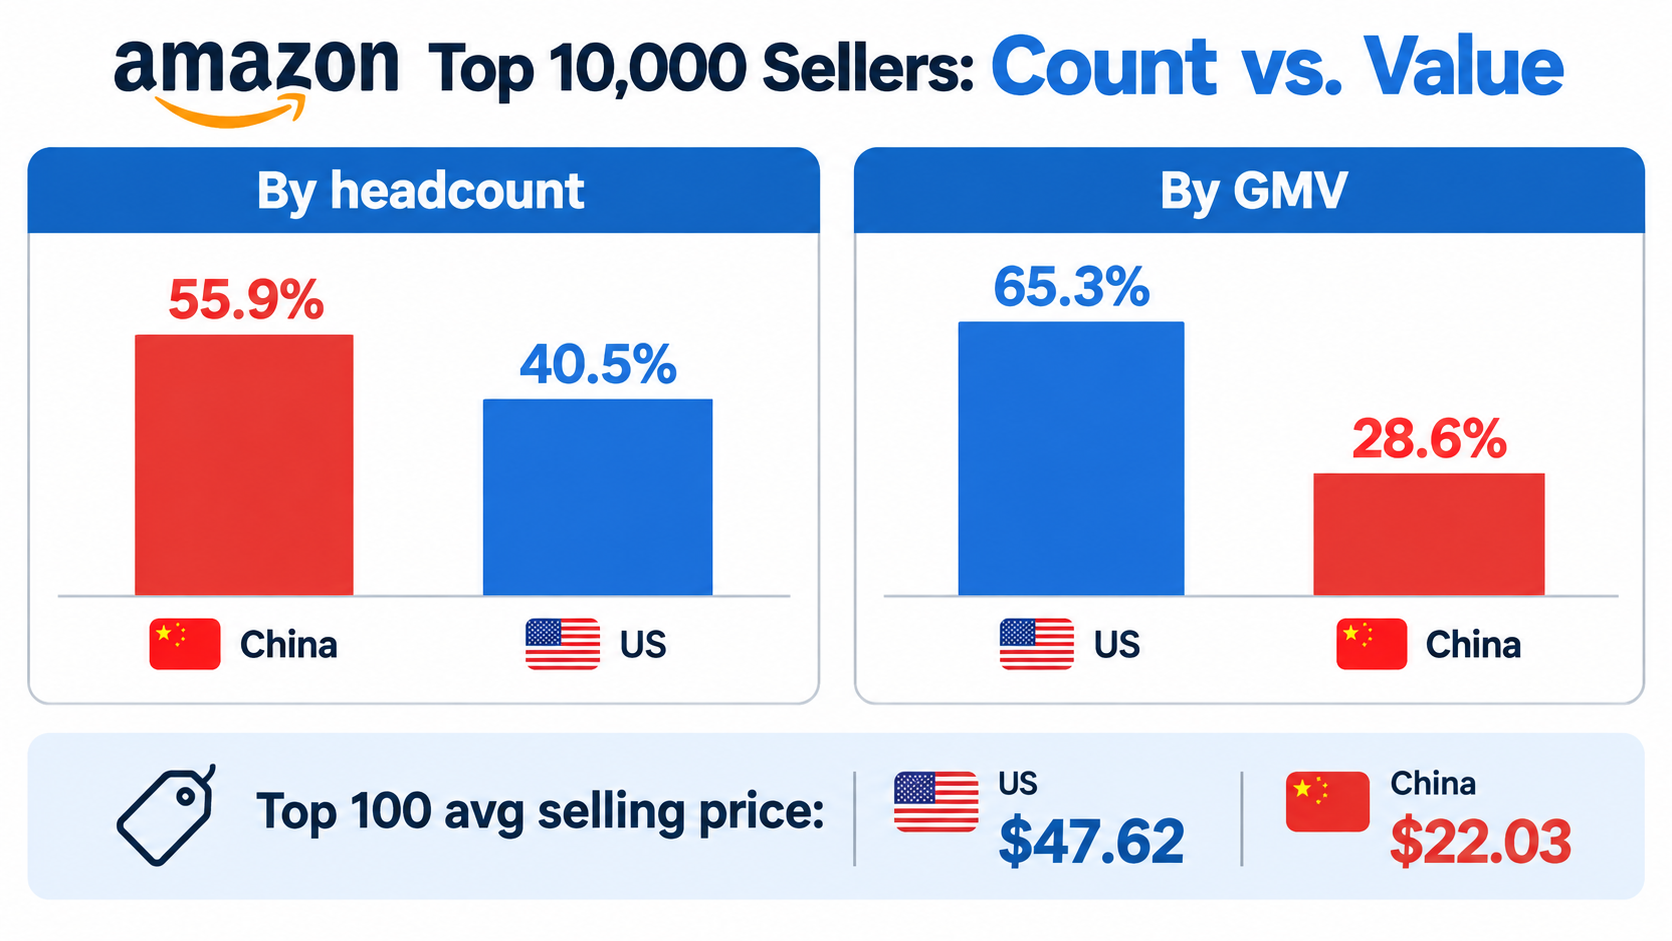
Since July 2020, Chinese sellers have gained 1,342 positions in the top 10,000, while U.S. sellers have lost 1,320. Chinese sellers made up 42.5% of the cohort then and 55.9% today. American sellers fell from 53.7% to 40.5%. In the past twelve months alone, 3.8 points of share moved.
Headcount is not the whole story
The headline figures overstate the reversal. When you measure by GMV instead of seller count, the picture flips:
- U.S. sellers hold 65.3% of the GMV produced by the top 10,000, against 28.6% for Chinese sellers.
- American sellers make up 81.4% of the top 100 and produce 93.2% of that group’s GMV.
- In the 5,001–10,000 band, American sellers are only 34% of the cohort.
- Average selling price is higher for U.S. sellers at every rank, most sharply in the top 100: $47.62 versus $22.03.
Chinese sellers have won the top 10,000 by count. American sellers have kept its most valuable ranks.
Why the split looks like this
Marketplace Pulse points to several advantages behind the incoming wave: manufacturing proximity, direct factory relationships, export subsidies, and AI tooling that “erased the listing-quality gap once protecting domestic sellers.” A few years ago, a U.S. brand could stand out just by having better English copy and cleaner photography. That edge has mostly gone.
The shift also lines up with changes in how visibility works. Veteran sellers built rank through organic position and review history. That real estate has steadily given way to sponsored placement, and factory-direct entrants running on thinner product margins are often willing to outspend them for it.
What separates the top 100
The ASP gap hints at the answer. U.S. sellers at the very top aren’t competing on price. They sell higher-priced products, usually under established brands, where trust, quality perception, and repeat purchase matter more than a few dollars’ difference. That is a defensible position. Selling a $15 commodity item in a category flooded with factory-direct listings is not.
Practical implications
- Audit your price band. If most of your revenue comes from low-ASP, easily copied products, you’re competing directly against sellers with structural cost advantages. Consider moving up in price, bundling, or adding features that justify a premium.
- Invest in brand signals that AI can’t fake. Review depth, brand search volume, repeat purchase rate, and off-Amazon reputation are harder to copy than a listing.
- Don’t confuse polish with differentiation. Polished listings are now the baseline. Product and brand need to carry the difference.
The Vintage Problem: Why the 2019–2021 Seller Cohort Is Getting Squeezed
One of the more revealing cuts in the 2026 data is by registration year. Marketplace Pulse broke down today’s top 10,000 sellers by when they joined Amazon:
- Pre-2016: 21.9% of top positions
- 2016–2018: 27.4%
- 2019–2021: 17.5%
- 2022–2024: 26.9%
- Last 18 months: 6.3%
The thinnest group is the 2019–2021 vintage, which the researchers describe as “a pandemic vintage that entered at the marketplace’s peak and has been squeezed from both directions since.”
Squeezed from both sides
Sellers who started before 2019 built rank and review history when organic placement still carried the most weight. They enjoy compounding advantages: established reviews, brand recognition, and years of sales history.
Sellers who arrived from 2022 onward came into a marketplace already dominated by ads, priced their products for that, and often brought factory-direct cost structures and AI-native operations from day one.
The pandemic cohort got neither advantage. Many launched during a demand surge that made unit economics look better than they really were. When demand normalized, ad costs rose, and new low-cost competitors arrived, their margin structures were exposed.
Longevity matters less than it used to
The share of top sellers registered before 2019 has dropped to about half, down from over 60% a year earlier. Marketplace Pulse concluded back in 2019 that it takes years to build a lasting Amazon business, but once built, it can last for years. In 2026, the first half of that still holds. Time on the platform still compounds into advantage, “but less of it, and for fewer sellers.”
Practical implications for pandemic-era sellers
- Rebuild your unit economics from scratch. Don’t assume the cost structure you modeled in 2020 or 2021 still holds. Recalculate landed cost, fees, ad cost per unit, and returns at today’s rates.
- Prune the catalog. Products launched during the demand spike often have thin margins and weak differentiation. Cutting the bottom 20% of SKUs by contribution margin frees up cash and attention.
- Find your organic floor. Measure how many sales you’d keep with ads paused on a given SKU. If the answer is close to zero, that product depends entirely on paid visibility, which is the weakest place to be.
Thriving, Grinding, Consolidating, Distressed: Which Seller Are You?
Platform-level growth numbers hide very different experiences underneath. To get below the averages, Marketplace Pulse surveyed 181 marketplace sellers representing more than $2 billion in combined annual revenue for its 2026 Seller Index. The results sort sellers into four cohorts based on two variables: revenue direction and margin direction.
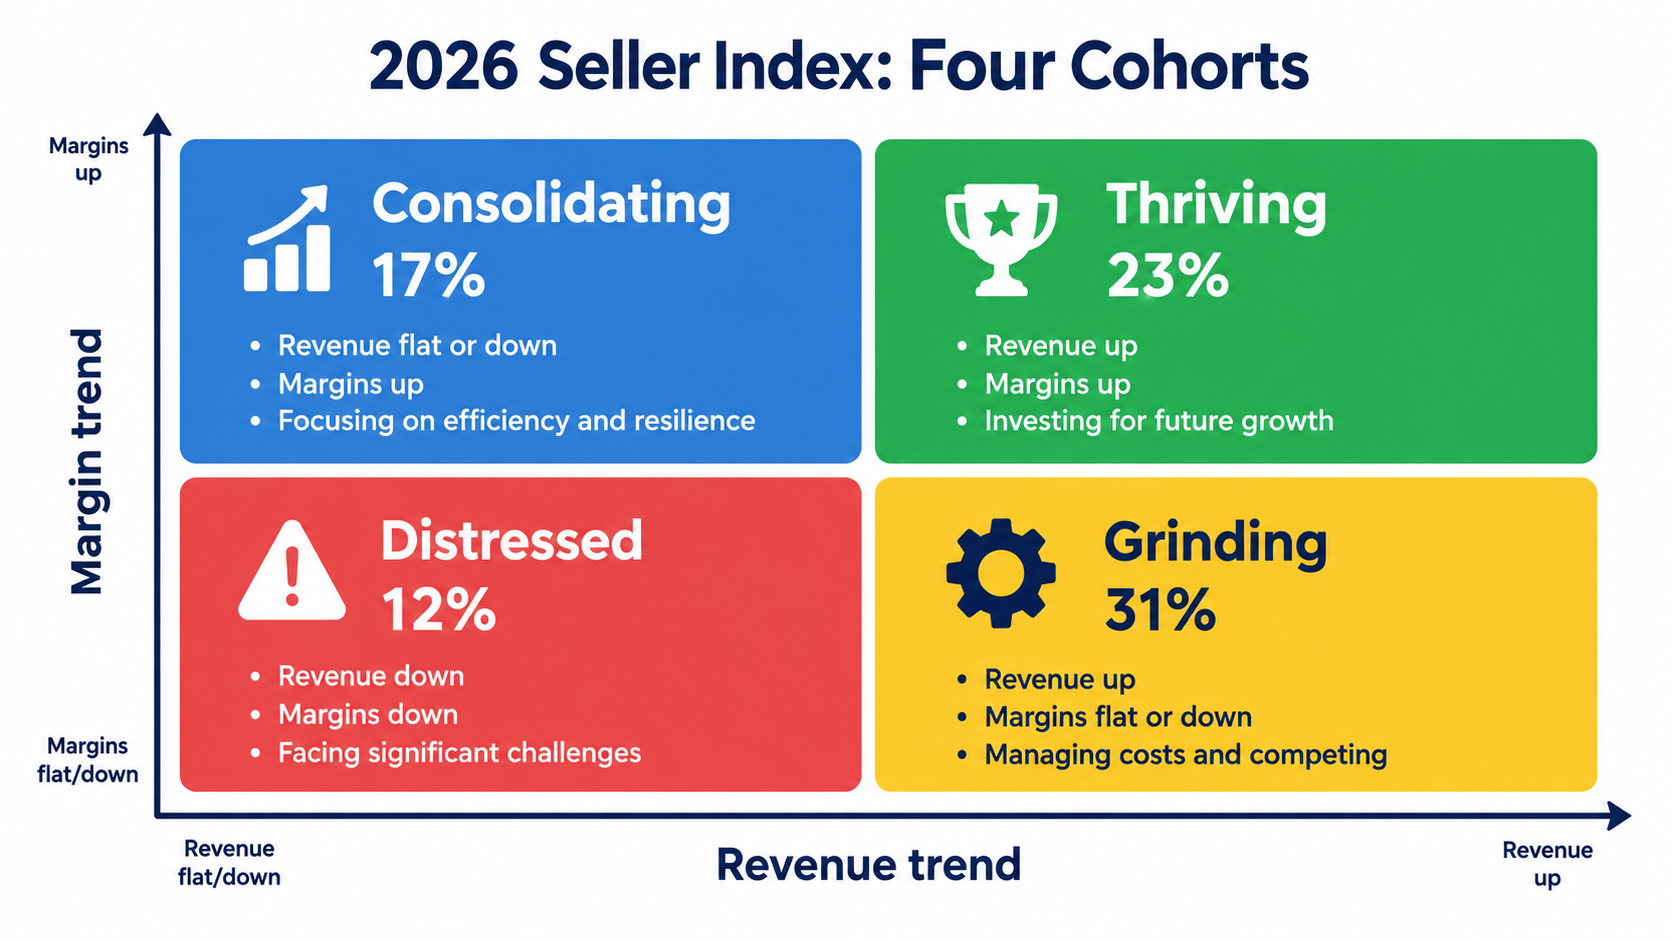
The four cohorts
- Thriving (23%): Revenue up and margins up.
- Grinding (31%): Revenue up, but margins flat or falling.
- Consolidating: Revenue flat or down, margins up. These sellers are trading growth for profitability.
- Distressed: Revenue and margins both heading the wrong way. The report puts 38% of sellers in a distressed position with, at best, no growth in sight.
As the report puts it, these cohorts “are operating on the same platforms under the same conditions.” Same marketplace, same fees, same algorithm, very different results.
Why grinding is the dangerous one
Distressed sellers know they have a problem. Grinding sellers often don’t. Revenue charts going up and to the right feel like success, and top-line growth is the number most sellers celebrate.
But revenue growth with flat or falling margins is what Marketplace Pulse calls a “potentially unsustainable treadmill.” The usual pattern looks like this:
- Growth is bought through rising ad spend, deeper discounts, or expansion into lower-margin SKUs.
- Each extra dollar of revenue costs more to acquire than the last.
- Working capital tied up in inventory grows faster than profit.
- One shock (a tariff change, a fee increase, a competitor’s price cut) turns a thin margin into a loss.
Nearly a third of sellers are on this treadmill. Many will drift into the distressed cohort without ever noticing the moment it happened.
How to tell which cohort you’re in
You need two numbers measured honestly over the same 12-month window:
- Revenue trend: Trailing twelve months versus the prior twelve.
- Contribution margin trend: Revenue minus COGS, all Amazon fees, advertising, returns, and inbound freight, as a percentage of revenue. Not gross margin, which ignores most of what Amazon charges.
If revenue is growing and contribution margin is shrinking, you’re grinding, whatever your sales dashboard says. The fix usually isn’t more growth. It’s cutting unprofitable ad spend, raising prices where reviews and brand strength allow, and dropping SKUs that grow revenue but not profit.
The consolidating path is underrated
Consolidating sellers give up revenue to improve margins. In a marketplace where the active seller count fell 16%, that’s often a smart way to survive. A smaller, profitable business can outlast competitors and then take share as they exit. Growth can come later, from a healthier base.
The Third Shelf: Amazon’s AI Assistant Doesn’t Read the Rankings
For more than a decade, Amazon visibility has worked through two routes. You earn organic rank through sales velocity, or you buy sponsored placement at auction. Almost every Amazon dashboard, agency report, and software tool is built around those two levers.
A study published in mid-2026 suggests a third route has opened, and it doesn’t follow either of the first two.
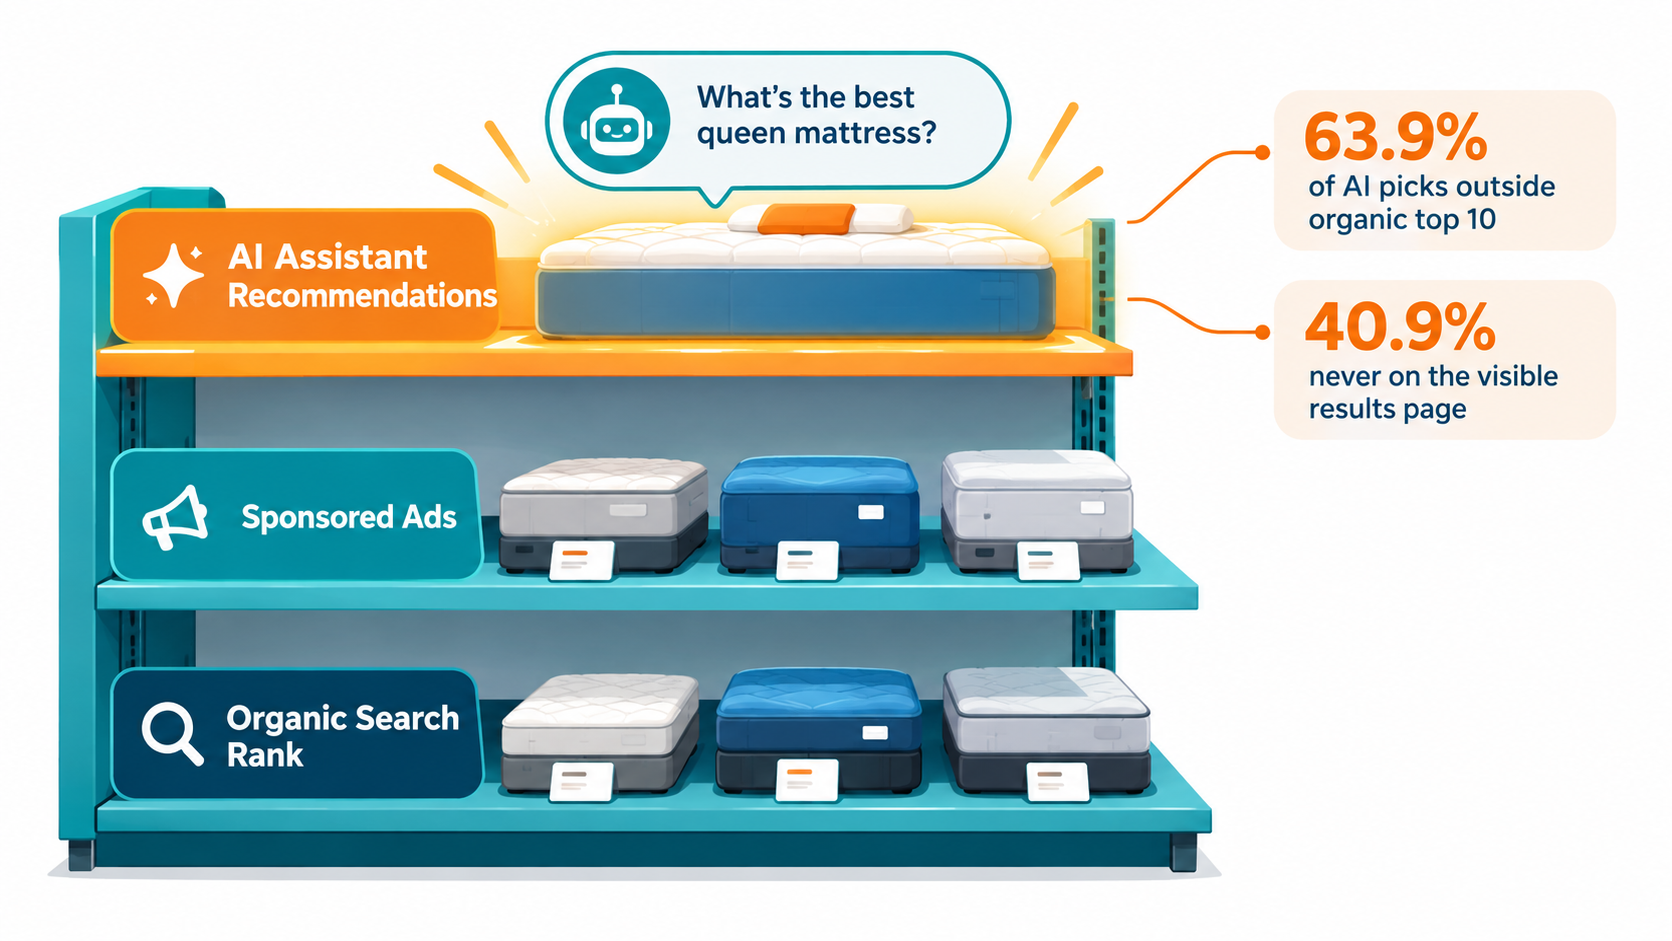
What the study found
In one of the first large-scale studies of what Alexa for Shopping recommends, Autopilotbrand.com, an AI-focused vendor, captured 1,963 non-branded queries and 12,810 recommendations in May and June 2026. Marketplace Pulse reported the results:
- 63.9% of the assistant’s picks fell outside the organic top 10 for the matching search term.
- 40.9% never appeared on the visible search results page at all.
- Only 14.3% of picks were products running a sponsored listing on that search page, and 83% of those already ranked organically anyway.
The study compared a recommendation-style question (“what is the best queen mattress?”) with the bare category search (“queen mattress”). Asked to recommend rather than list, the assistant surfaced a noticeably different, and often deeper, set of products than the search page sellers usually work to rank on.
Why this matters
Search rank is the metric Amazon teams build dashboards around. According to this data, it’s also the one the assistant most clearly declines to follow. Marketplace Pulse called this “the shelf finally doing what it once couldn’t.” Two years earlier, the assistant mostly returned links to searches shoppers could have run themselves.
Christian Umbach, co-founder and CEO of Autopilotbrand.com, described it this way:
“We’re seeing the emergence of a third shelf alongside organic search and paid placements. Brands cannot simply buy or rank their way onto it; they need to give Amazon’s AI Alexa enough context to understand when and why their product is the right recommendation. That means richer catalog data, optimization around shopper intent, and continuous updates as seasonal use cases and product differentiators evolve. For products that do not yet own the top of search, this creates an entirely new path to compete.”
The caveats
This is a single snapshot from one U.S. account, captured early, and the vendor that ran it sells services in this area. Treat it as a strong signal, not settled science. Still, it fits a bigger trend. The assistant’s scale is real: Amazon CEO Andy Jassy credited it with an estimated $12 billion in incremental sales, and in Q1 2026 Amazon reported monthly active users up 115% year over year with engagement up nearly 400%.
How to get onto the third shelf
Nobody outside Amazon knows exactly how the assistant picks products. But the study’s findings and Umbach’s comments point to some sensible practices:
- Write for questions, not just keywords. Shoppers ask the assistant things like “best mattress for side sleepers with back pain.” Your listing should state plainly who the product is for, what problem it solves, and in what situations it beats alternatives.
- Fill in every structured attribute. Backend attributes such as material, dimensions, use case, age range, and compatibility give the AI facts to reason with. Empty fields are missed chances.
- Make differentiators explicit. “Premium quality” tells an AI nothing. “Certified to X standard, 30% lighter than steel alternatives, fits Y models” does.
- Mine your reviews and Q&A. The questions customers actually ask show the intents the assistant is trying to match. Answer them in your listing content.
- Update seasonally. Use cases change through the year (gifting, back to school, outdoor season). Fresh content that reflects current intents gives the assistant timely context.
The Ad Meter Is Already Running on AI Discovery
If the third shelf sounds like an organic escape route from rising ad costs, there’s a catch: monetization is coming fast.
Amazon’s ads are moving into the assistant
In May 2026, the same month Amazon renamed Rufus as Alexa for Shopping, it launched Sponsored Products and Brand Prompts inside the assistant. In its Q1 earnings call, Amazon disclosed that nearly 20% of shoppers who interact with a sponsored brand prompt continue the conversation about that brand. Jassy was careful to add that “it is early.” The figure also measures whether shoppers keep talking, not whether they buy.
Behind this is a very large ad business. Amazon’s advertising revenue grew 22% on a constant-currency basis in Q1 2026, on a trailing base of more than $70 billion. Sellers paid $68.62 billion for search advertising in 2025, as ads kept crowding in around organic results.
The rest of the AI shopping market is heading the same way
For a while, it looked like AI shopping might offer a different model. ChatGPT’s Instant Checkout charged a 4% transaction fee, broad merchant access without ads as the main way to get discovered. That option is gone. OpenAI launched ads in ChatGPT in February 2026, shelved Instant Checkout in March citing execution problems, and then opened its ads manager to all U.S. advertisers with no $50,000 minimum spend.
Marketplace Pulse’s conclusion: “agentic commerce is settling into an ad-supported model.” McKinsey and ICSC forecast U.S. agentic commerce will reach $1 trillion by 2030, citing 68% of consumers who used at least one AI tool for shopping in the past three months.
The window is open, for now
Here’s the tension. Today, the AI shelf doesn’t seem to reward rank or ad spend much. That makes it one of the few places where a product outside the search winners can show up where a category leader doesn’t. But as Marketplace Pulse notes, search looked like that once too, “before the ad load found it.”
Practical implications
- Move early on organic AI visibility. The context-rich listing work described above costs little and pays off before paid placement fills the space.
- Test sponsored prompts in small amounts. If you have access, run small, measurable experiments. Track downstream conversion, not just engagement.
- Watch for the shift. Track how often your products appear in assistant answers for your main queries. The day sponsored results start pushing out organic picks is the day the economics change.
Everyone Uses AI. A Quarter of Sellers See No Results.
AI adoption among Amazon sellers is close to universal. Results are not. According to the 2026 Seller Index, 83.4% of marketplace sellers now use AI somewhere in their operations, averaging 3.2 use cases each. Yet the single most common answer on impact was that no area has produced measurable results yet: 25.4%, ahead of any specific win.
Where sellers use AI
Adoption clusters around content work:
- Listing content: 63.5%
- Image and video creation: 49.2%
- Advertising management, competitive intelligence, pricing, and inventory forecasting trail well behind.
Usage rises with revenue, from 2.42 use cases on average for sellers under $500K to 3.67 for those above $5M. But the “no measurable impact” answer barely changes across revenue bands. As Marketplace Pulse put it, “Scale is bringing breadth, not better outcomes, at least not yet.”
The health split
The clearer difference shows up by seller health. Among thriving and grinding sellers, about 16% report no measurable AI impact. Among consolidating and distressed sellers, that figure roughly doubles. Whether AI drives the growth, or growing sellers simply have more capacity to get value from it, can’t be answered from the current data.
Why content-only AI is plateauing
Look at this alongside the competitive data. When nearly every seller uses AI to write listings and make images, AI-written listings stop being an edge. They become the minimum. That’s exactly what happened in the top 10,000, where AI tooling “erased the listing-quality gap.”
The value is moving toward areas fewer sellers have touched: forecasting, pricing, ad bid management, and catalog-wide analysis. Marketplace Pulse notes that some nine-figure sellers are building their own internal tools that take AI well beyond prompting for ad copy.
Shoppers are moving faster than sellers
Adobe Digital Insights reported a 393% year-over-year increase in AI-referred retail traffic in Q1 2026. AI-referred visitors now convert 42% better than non-AI traffic, a reversal from a year earlier. Revenue per AI visit runs 37% higher.
Not every data point agrees. Walmart reported that in-chat purchases converted at a third of the rate of click-throughs to its website. But the direction is clear: shoppers are adopting AI as a way to discover products, while most sellers still treat it as a tool for writing bullet points.
Practical implications
- Pick one operational use case and measure it. Inventory forecasting or ad bid rules are good candidates. Set a baseline, run the AI-assisted process for 60–90 days, and compare.
- Stop counting content AI as a win on its own. If AI listings haven’t moved conversion or rank, they’ve just matched you to the field.
- Think of AI as a channel, too. Your products need to be legible to AI shopping assistants, both on and off Amazon.
Seller Central Becomes the Hub, and the Diversification Illusion Gets Deeper
At its Accelerate seller conference in September 2026, Amazon announced that sellers will be able to manage their eBay, Shopify, TikTok Shop, and Walmart businesses from inside Seller Central. The multichannel tools are rolling out gradually to U.S. sellers at no extra cost.
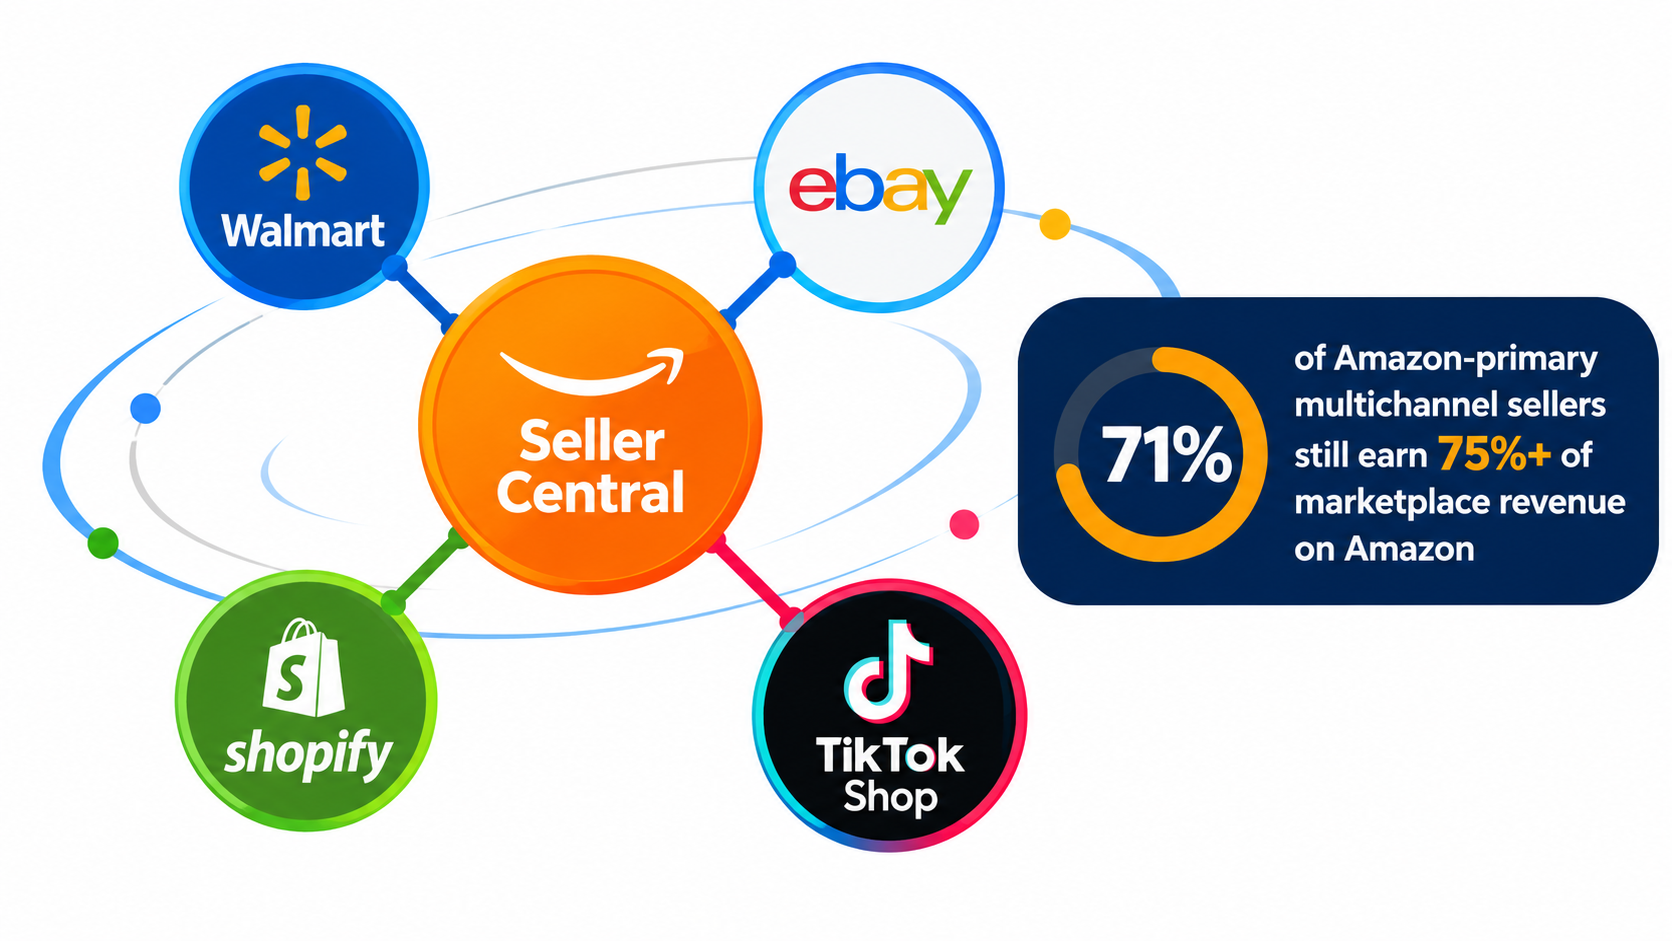
What the tools do
- Edit a product description once, and Amazon reformats and publishes it to the linked listings on eBay, Walmart, and Shopify.
- Shopify and Walmart orders show up next to Amazon orders and can be fulfilled through Amazon in a few clicks.
- A profitability view shows what each product earns on each channel.
Five years of moving in one direction
Marketplace Pulse frames this as the latest step in a five-year sequence. Amazon once made multichannel selling harder: FBA charged more to ship off-Amazon orders, and products priced lower elsewhere could be suppressed (which can still happen today). Then came Buy with Prime, then Multi-Channel Fulfillment growth (more than 200,000 U.S. sellers by Accelerate 2024, with order volume up 70%), then MCF integrations with Walmart and Shein.
Each earlier step handled goods or payments. This one puts Amazon in front of the other channels, in the seller’s daily workflow.
The diversification illusion
Amazon says more than 95% of its sellers sell on multiple channels. But being on several channels rarely means being diversified. Per the 2026 Seller Index, 71% of Amazon-primary sellers active on at least one other marketplace still earn three-quarters or more of their marketplace revenue from Amazon.
The new tools make running other channels easier, which may help some sellers grow on Walmart or TikTok Shop. Walmart’s U.S. marketplace grew nearly 50% in the first quarter of its fiscal 2027, so there’s real room to grow there. But that growth would happen inside Amazon’s software. Amazon also now sees how much you sell elsewhere, not just what you charge, though it says that data won’t feed its retail business.
Marketplace Pulse summarized the risk: “The tools make it easier to run other channels, but those channels still orbit Amazon.”
Practical implications
- Use the tools, but know the trade-off. Saving time on listing sync and order management is real value. Just recognize that your operating system is now owned by your biggest channel.
- Measure real diversification. Track the share of revenue (and contribution profit) that would survive a full Amazon account suspension. If it’s under 25%, you aren’t diversified.
- Keep customer relationships off-platform. A direct-to-consumer site, an email list, and brand search demand are the parts of your business that no marketplace hub controls.
- Watch price parity. Since Amazon can still suppress products priced lower elsewhere, coordinate pricing across channels on purpose.
The Structural Headwinds: 1P Share, Fees, and the Paradox of Dependence
Several other 2026 data points finish the picture of where Amazon selling is heading.
Amazon is regaining first-party share
Third-party sellers accounted for 60% of paid units sold on Amazon in Q1 2026, down from 61% in Q4 2025 and 62% the quarter before that. It’s the first time the metric has fallen for two consecutive quarters since Amazon began reporting it in 2004. Two quarters isn’t a trend reversal, but after two decades of 3P share mostly rising, it deserves attention.
Amazon Haul and the low-price edge
Amazon Haul, the direct-from-China storefront for items under $20 launched in November 2024, has passed 3,000 sellers. It positions Amazon against Temu and Shein, though it’s still smaller in scale. For sellers in low-price categories, it’s one more source of competition that operates under different economics.
Amazon Business keeps growing
There’s an upside on the B2B side. Amazon Business has reached $60 billion in annualized gross sales, up from $35 billion disclosed in 2023 and $25 billion in 2021. Marketplace Pulse estimates that’s roughly 7% of Amazon’s $830 billion GMV. For sellers with products that suit offices, facilities, schools, or healthcare buyers, it’s an underused channel with different buying behavior: larger orders, repeat purchasing, and less sensitivity to impulse pricing.
The paradox of dependence
Marketplace Pulse describes a “paradoxical dependence” between Amazon and its sellers. Sellers are frustrated with platform fees yet deepen their dependence on Amazon because no alternative offers comparable scale. Amazon takes more revenue from sellers while becoming more exposed to a concentrated base that could, in theory, coordinate or leave.
Its record ad revenue is being produced by a smaller active seller base than a year earlier. That arrangement holds as long as the remaining sellers stay profitable enough to keep paying.
Practical implications
- Model fees as a rising line, not a constant. Build yearly fee and ad-cost increases into your pricing and product selection.
- Look into Amazon Business. Set up business pricing and quantity discounts on products that fit B2B demand.
- Avoid head-to-head fights with Haul-type pricing. If a product can be sold profitably under $20 by direct-from-China sellers, compete on bundles, brand, or quality instead.
Where the Opportunity Actually Is: Amazon’s International Marketplaces
Most of this article has focused on Amazon.com. But some of the clearest openings in 2026 are outside the U.S.
Traffic per seller is rising faster abroad
U.S. sellers saw traffic per seller rise 19%. That’s meaningful, but it was the smallest gain among Amazon’s top ten marketplaces. Elsewhere:
- Brazil: Amazon.com.br added 36 million monthly visits while active sellers dropped 23%, lifting visits per seller by 57%.
- Mexico: A similar gain.
- Europe: France, the Netherlands, and Poland all saw visits-per-seller increases above 40%.
- Saudi Arabia: Leads on traffic per seller at 9,980 visits, as demand inherited from Amazon’s 2020 Souq transition has outpaced seller adoption. Its low absolute traffic ceiling limits which categories can support a business.
- Australia: The only Amazon marketplace where the active seller count grew over the past year.
- India: Strong growth, though FDI rules essentially restrict the marketplace to locally registered sellers.
The U.S. is still the biggest prize
None of this makes the U.S. less important. The U.S. remains the strongest absolute opportunity, with revenue per seller more than $200,000 above the next-largest market. Amazon’s top ten marketplaces account for 92% of both global traffic and active sellers.
Still, for a seller who has hit a ceiling in the U.S., or who is losing ground to factory-direct competitors there, a market where seller supply is falling faster than traffic is worth a serious look.
Practical implications
- Use traffic-per-seller as a screening metric. Rank possible markets by visits per seller, then filter by category fit, regulatory burden, and logistics cost.
- Start with proven SKUs. Expand your best-selling, highest-margin products first, not the long tail.
- Budget for localization. Translation, local compliance, and local customer service are what entry costs. Underfunding them is the most common reason international launches stall.
Your 90-Day Plan for Selling on Amazon in 2026
The data in this article points to one conclusion: Amazon in 2026 isn’t saturated, but it’s sorting sellers. More shoppers are spread across fewer sellers, and the ones getting that attention run tighter operations, sell differentiated products, and adjust faster to how discovery works now. Here is a practical sequence for putting that into action.
Days 1–30: Diagnose
- Identify your cohort. Calculate trailing-twelve-month revenue growth and true contribution margin trend. Are you thriving, grinding, consolidating, or distressed?
- Run an organic floor test. For your top 10 SKUs, estimate how much revenue comes from organic versus paid. Products with almost no organic sales are your biggest risk.
- Map your price-band exposure. What share of revenue comes from low-ASP products that are easy for factory-direct sellers to copy?
- Measure real diversification. What share of contribution profit comes from outside Amazon?
Days 31–60: Reposition
- Cut or reprice margin drags. Grinding sellers should reduce unprofitable ad spend and drop SKUs that add revenue without profit.
- Rebuild top listings for the third shelf. Rewrite your five best listings around shopper intent: who the product is for, which problem it solves, and why it beats alternatives. Fill every structured attribute.
- Test assistant visibility. Ask Alexa for Shopping recommendation-style questions in your category (“best X for Y”) and record whether your products appear. Repeat monthly.
- Turn on the multichannel tools carefully. Use them for efficiency, but keep your customer data and direct-to-consumer channels separate.
Days 61–90: Build advantages
- Deploy one operational AI use case. Forecasting, pricing, or bid management, with a clear baseline and success metric.
- Explore a new demand pool. Either Amazon Business (B2B pricing, quantity discounts) or one international marketplace screened by traffic per seller.
- Put money into brand signals. Review generation programs, brand search campaigns, and off-Amazon content that build demand factory-direct competitors can’t easily copy.
Conclusion: Amazon Isn’t Crowded. It’s Concentrating.
For years, the standard warning about selling on Amazon has been that it’s too crowded. The 2026 data says the opposite. Active sellers fell 16%. Traffic per seller rose 25%. E-commerce posted its fastest growth in five years. In raw numbers, there’s more customer attention per seller than ever.
But attention is pooling toward a smaller group. Fewer than 8,000 sellers now produce half of U.S. third-party GMV. Chinese sellers hold most of the top 10,000 by count, while U.S. sellers keep the highest-value ranks through higher prices and stronger brands. The pandemic-era cohort is getting squeezed. And nearly a third of sellers are grinding: growing revenue on margins that won’t hold.
At the same time, discovery is splitting. Organic rank and sponsored ads now share space with a third shelf of AI recommendations that, for now, seem to reward context and clarity more than rank or spend. That window probably won’t stay open long, given how quickly Amazon and OpenAI are moving to monetize AI shopping.
The main takeaways:
- Measure contribution margin, not just revenue. Growth that shrinks margins is a treadmill, not progress.
- Compete where structural cost advantages don’t decide the outcome. Higher price bands, stronger brands, B2B demand, and underserved international markets.
- Make your products legible to AI. Intent-led copy, complete attributes, and clear differentiators are cheap to do now and could become expensive to fix later.
- Use Amazon’s multichannel hub without mistaking it for independence. Real diversification means profit that survives without Amazon.
- Turn AI from a writing tool into an operating tool. Content AI is now standard. Operational AI is where the remaining edge is.
The sellers who come out ahead won’t necessarily be the biggest or the longest-established. They’ll be the ones who see the structural shifts clearly and act on them while the advantage is still there.