


The deck looked convincing. Forty-seven slides, polished charts, a slick executive summary. The AI automation team had spent three weeks on it. Then the CFO asked one question — “What would those metrics look like if we hadn’t deployed AI at all?” — and the room went quiet.
Nobody had built a counterfactual. Nobody had locked a baseline. The “10,000 hours saved” headline was actually a comparison against a peak-season period from two years prior. The whole presentation, built on genuine enthusiasm and real work, collapsed in under four minutes.
This happens more than most technology teams want to admit. In 2026, with boards under intensifying pressure to justify AI spend at a macro level, the gap between a compelling AI presentation and one that survives boardroom scrutiny has widened significantly. Most teams still think the problem is what they measure. The actual problem is that they haven’t thought through how a sceptical financial mind will dismantle what they’ve measured.
This post is written for the people who have to stand in that room and defend the numbers. It covers the specific questions boards and CFOs ask in 2026, why standard AI metrics fall apart under those questions, and what a genuinely board-grade evidence package looks like — built before you ever open the first slide.
This isn’t about making AI look good. It’s about making AI evidence hold up.
Why Most AI ROI Presentations Fail the Boardroom Test
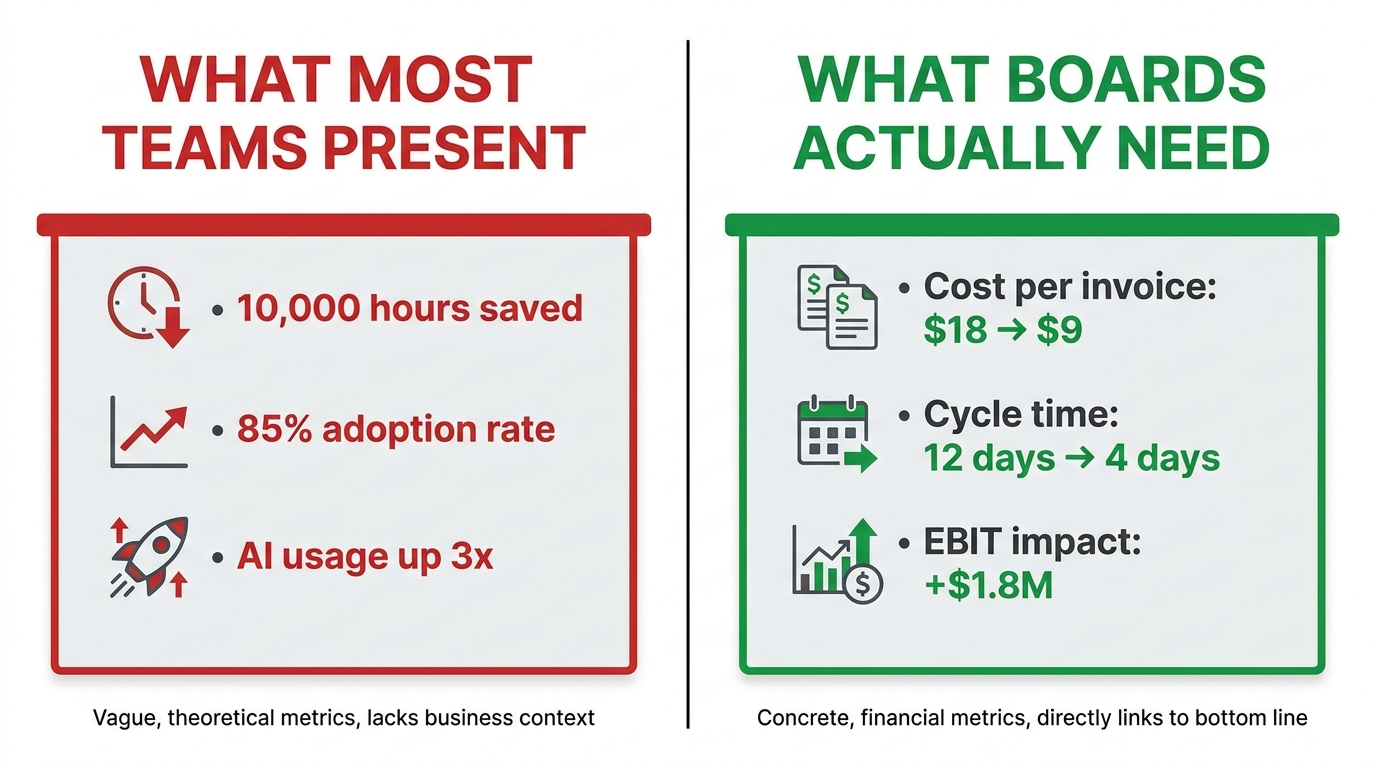
There’s a consistent pattern in how enterprise AI ROI presentations are built, and it almost always starts from the wrong direction. Teams begin with the technology — the model, the deployment, the tool — and work backward toward metrics that seem to justify what they’ve already built. The result is a deck full of activity metrics that feel substantial but prove nothing.
The Adoption Trap
Adoption metrics are the most common culprit. Boards see slides showing that 87% of the relevant team is actively using the AI system, that the platform has processed 2.3 million queries this quarter, or that “AI-assisted tasks” have grown 4x since launch. These numbers feel significant because they’re large and directionally positive.
But a board director with a finance background will immediately ask: so what? Usage doesn’t mean the business is better off. A tool that is used constantly but produces no change in cost, quality, or speed is not delivering ROI — it’s delivering activity. And activity, in financial terms, is indistinguishable from cost.
Research from multiple enterprise surveys conducted in late 2025 and early 2026 found that a significant majority of organisations deploying AI tools at scale could demonstrate adoption and usage growth, but fewer than a third could demonstrate that adoption had translated into measurable financial outcomes. That gap is precisely what boards are now interrogating.
The Hours-Saved Problem
“We saved 10,000 hours of manual work this quarter” is probably the most common headline in an AI ROI deck. It sounds quantified. It sounds specific. It almost never survives board scrutiny.
The problems are structural. First, hours saved is not the same as cost saved unless the company has actually reduced headcount or reallocated those hours to revenue-generating work. If a team of 20 people each saves four hours a week but still comes in for 40 hours and performs the same roles, the business has saved nothing — it has just changed what those 20 people do during those four hours. Boards with financial discipline understand this distinction immediately.
Second, the measurement methodology for “hours saved” is typically self-reported or estimated. It’s rarely drawn from time-tracking systems, process mining tools, or any auditable data source. When a CFO asks “how was that measured?”, the honest answer is usually “we asked managers to estimate it.” That answer ends the conversation.
Third, hours-saved projections typically fail to account for the offsetting costs of AI maintenance, human review of AI outputs, exception handling, and the time spent correcting AI errors. Gross savings without net accounting is not a number boards should be accepting — and increasingly, they aren’t.
The Comparison Period Problem
A subtler failure is when teams show dramatic before/after improvements without establishing that the comparison is valid. A process that was slower during a period of staff turnover, or during a peak season, or during a one-time system migration, will look dramatically improved after AI deployment even if the AI contributed minimally. Without a stable, auditable baseline period, the comparison proves nothing.
Boards in 2026 are more sophisticated about this than they were even two years ago. Many now have independent directors with quantitative backgrounds specifically because of the AI investment surge. They know to ask about the comparison period. If your baseline is shaky, they will find it.
The Four Questions Every CFO Will Ask
Based on the current boardroom environment, there are four questions that consistently define whether an AI ROI presentation succeeds or fails. They aren’t always asked in exactly these words, but they’re always present in some form. Any presentation that can’t answer all four will lose credibility on at least one of them.
Question 1: “What Was the Baseline, and How Was It Measured?”
This is the foundational question, and it disqualifies most presentations immediately. The CFO is asking: before AI was deployed, what was the actual performance of this process? Not an estimate, not an approximation, not a number sourced from memory or a prior year’s report. A documented, time-stamped, methodology-defined measurement of the specific metric you’re now claiming to have improved.
Good answers specify the exact time period used for the baseline (typically at least 90 days), the data source it was drawn from, who verified it, and whether it was established before deployment began. Critically, good answers acknowledge seasonal variation — if your process has natural seasonality, the baseline needs to account for it, and the post-deployment period needs to be compared against a seasonally equivalent period.
The simplest way to pass this question is to have locked your baseline measurement in writing, with sign-off from finance, before the AI system went live. If you don’t have that, you’re defending a number you constructed retrospectively, and that is very difficult to do credibly under questioning.
Question 2: “Would Those Results Have Happened Anyway?”
This is the counterfactual question, and it’s the one that catches the most teams off guard. The CFO is asking whether AI caused the improvement or whether something else — a process redesign, new hires, market conditions, a competitor’s misstep, seasonal patterns — would have produced the same results without the AI investment.
This is not a hostile question. It’s the question any rational investor would ask. If results improved 18% following AI deployment, but the company also hired six new analysts, upgraded its ERP system, and expanded into a new market segment during the same period — the AI’s contribution is genuinely unclear. The board needs to know what portion of the improvement is attributable specifically to the AI.
Strong answers involve either a holdout group (a portion of the process or team that didn’t have access to the AI, measured over the same period for comparison) or a staggered rollout design that creates a natural control group. Both approaches are borrowed from clinical trial methodology and are increasingly expected in enterprise AI evaluation. We’ll return to this in detail in the section on attribution.
Question 3: “What Did It Actually Cost?”
Most AI ROI presentations significantly understate total cost of ownership. Teams typically include licensing fees and sometimes implementation costs. They routinely exclude: internal staff time for integration and maintenance, data infrastructure costs, human review time (because AI outputs require QA), retraining costs when models drift, and the opportunity cost of the engineering and data science team that built and supports the system.
A CFO building a complete picture will ask for all of these. If your ROI calculation used a narrow cost definition, the real ROI is lower than stated. Boards that have been burned by this pattern now ask specifically for “fully loaded” cost of the AI deployment — all direct and indirect costs included. If you haven’t calculated this before walking into the room, you shouldn’t be walking into the room.
Question 4: “What Happens to the Savings?”
This is the reallocation question. If the AI saved 10,000 hours of manual processing, what did the people who used to do that work do instead? If they moved to higher-value activities, which activities? Can you quantify the output of those activities? If the answer is “they have more time to focus on strategic work,” the board will ask what measurable difference that strategic work has made.
If the answer is that headcount was reduced, boards will want to see the cost savings reflected in the P&L, not just projected in a model. And if neither headcount reduction nor measurable reallocation occurred, the honest answer is that the hours were absorbed without financial consequence — which means the ROI calculation needs to be revised.
The Metrics Hierarchy: From Vanity to P&L-Linked Proof
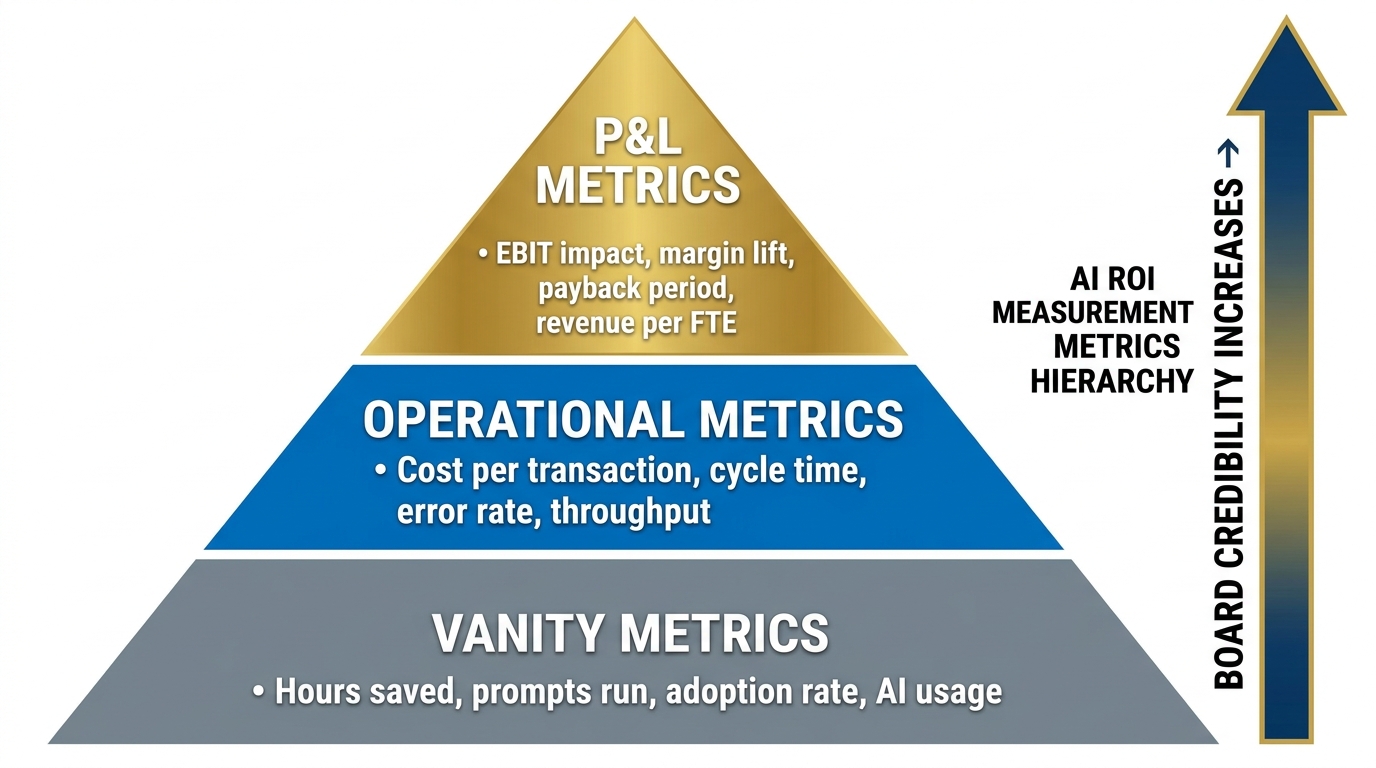
Not all AI metrics are equally defensible in a board setting. Understanding the hierarchy — and knowing which level your current metrics sit at — is critical to knowing how much work you have to do before a presentation is ready for scrutiny.
Tier 1: Vanity Metrics (Don’t Present These as ROI)
Vanity metrics include: number of AI queries processed, percentage of staff using the tool, model accuracy scores, uptime percentages, token consumption, and generic “hours saved” figures without reallocation evidence. None of these belong in the ROI section of a board presentation. They’re useful as supporting context — proving that the system is being used and functioning — but they are not return metrics. Presenting them as ROI will immediately signal to a financially literate board that your team doesn’t understand the difference between activity and impact.
This doesn’t mean you can’t mention them. It means you shouldn’t lead with them, and you should never frame them as proof that the investment paid off.
Tier 2: Operational Metrics (The Middle Ground)
Operational metrics sit closer to real business impact and are significantly more credible than vanity stats. They include: cost per transaction (before and after), process cycle time (before and after), error rate or rework rate (before and after), throughput (volume processed per FTE per day), and exception rate (percentage of AI outputs requiring human intervention).
These metrics are valuable because they’re specific to a workflow, they can be measured with genuine precision, and they translate naturally into financial terms. A reduction in cost per invoice processed from $18.50 to $9.20 is a concrete, auditable, financially meaningful statement. The board can independently verify it, model its portfolio impact, and hold management accountable for it.
The key requirement for operational metrics to be board-grade is that they must be drawn from system records, not estimates. They need a documented methodology, a defined time window, and a clear baseline for comparison. Without those elements, even good operational metrics can be challenged.
Tier 3: P&L-Linked Metrics (What Boards Actually Approve)
The highest tier of AI metrics connects directly to the financial statements the board uses to evaluate the business. These include: EBIT impact (direct contribution to operating profit), margin lift on specific product lines or business units, cost-to-serve delta (total cost of serving a customer or completing a transaction), revenue per FTE change, payback period (time from investment to cumulative break-even), and net present value of the automation programme over a 3-5 year horizon.
These are the metrics that get AI budgets approved and defended. They’re also the hardest to produce, because they require connecting operational changes all the way through to financial outcomes — which means working closely with finance from the start of the measurement process, not at the end when you’re building the slide deck.
The single most important shift teams can make in how they approach AI ROI measurement is to involve finance in metric design at the project scoping stage. Not when the results are ready — at the beginning, when the baseline is being established. Finance teams know how to build P&L-linked measurements. They know which numbers the board will accept. That knowledge should shape the measurement framework from day one.
How to Solve the Attribution Problem Before You Walk Into the Room
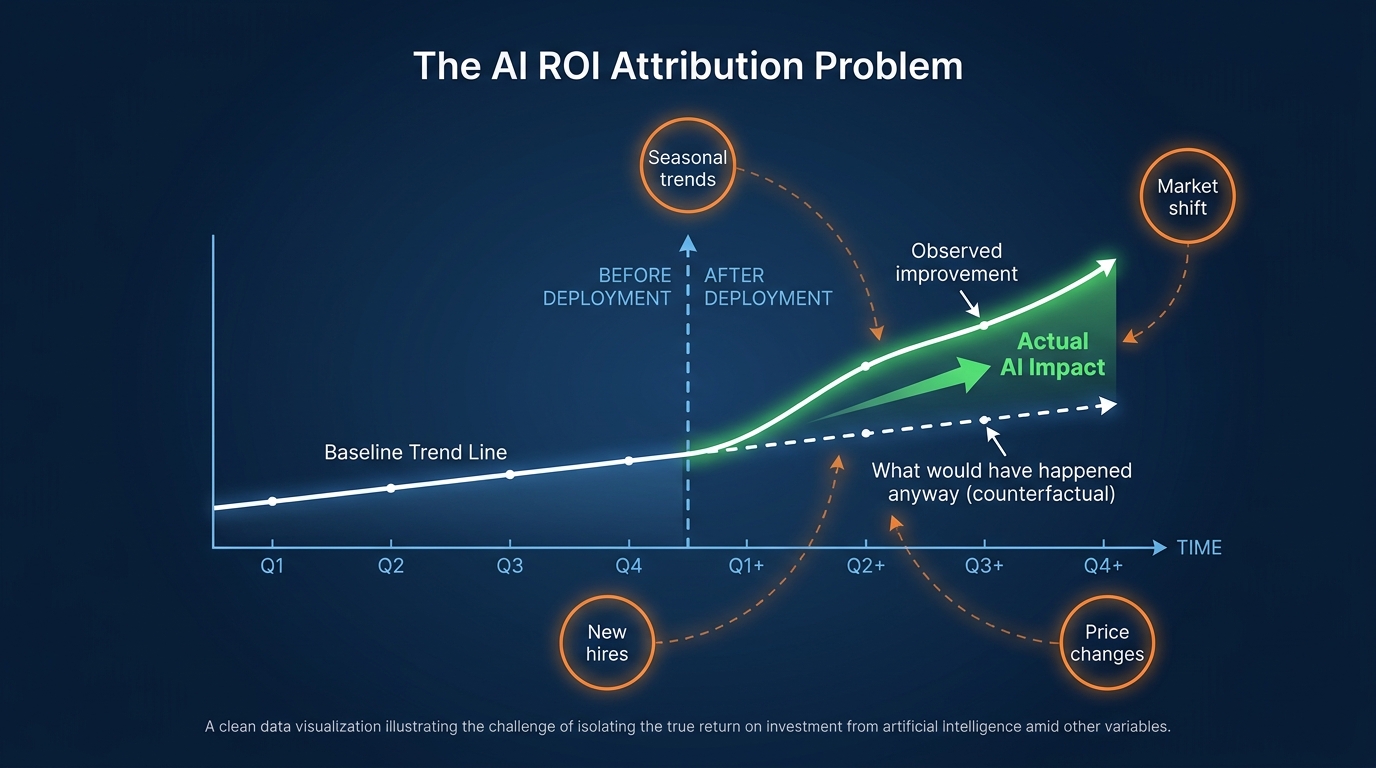
The attribution problem is the central technical challenge in AI ROI measurement, and it’s the one that most enterprise teams haven’t solved systematically. It asks a simple question with a complicated answer: of all the improvements observed after AI deployment, how much was caused specifically by the AI?
Without a rigorous answer to that question, ROI figures are correlational, not causal. A board with financial discipline will recognise the difference immediately. Correlation can be explained away. Causation, demonstrated with a proper experimental design, is much harder to dismiss.
The Holdout Group Method
The most practical solution for most enterprise AI deployments is the holdout group. Before deploying AI to the full relevant population — whether that’s a team, a set of customers, a portfolio of transactions, or a group of processes — designate a randomly selected subset that will not receive the AI capability during the measurement period.
This holdout group becomes your control. Over the measurement period (typically 90 days minimum, ideally longer), you track the same metrics for both the AI group and the holdout group. The difference in outcomes between the two groups — adjusted for any known differences in composition — is the attributable impact of the AI.
This approach requires planning before deployment, which is why most teams haven’t done it. If AI has already been deployed to everyone, you can’t go back and create a holdout group. The time to design this is during project scoping, not during slide preparation.
Practical considerations: the holdout group should be large enough to produce statistically significant results (typically at least 20-30% of the total population, depending on the volume of transactions). It should be randomly assigned to avoid selection bias. And the measurement period should be defined in advance, not selected post-hoc based on when results look best.
Staggered Rollout Design
For teams where a permanent holdout group isn’t feasible — because withholding AI from a portion of the team creates operational inequity or practical problems — a staggered rollout design offers an alternative. In this approach, AI is deployed to different groups or regions at different times. The groups that haven’t yet received AI serve as a natural control for the groups that have.
This is sometimes called a “difference-in-differences” approach, borrowed from economics. It’s particularly useful for large enterprises rolling out AI across multiple business units or geographies, where the sequential nature of rollout creates natural before/after comparisons. It doesn’t require withholding AI from anyone permanently — it just requires that the rollout be sequenced thoughtfully and that the comparison data be captured at each stage.
Statistical Controls When Experiments Aren’t Possible
In some cases, running a controlled experiment genuinely isn’t feasible — perhaps because the process is too small, the AI has already been fully deployed, or operational constraints make withholding the tool impossible. In these situations, the next best approach is statistical control: using regression analysis or similar methods to isolate the AI’s contribution while controlling for known confounding factors.
This is technically more demanding and produces results that are less definitive than experimental methods. But when presented with transparency about its limitations, it is still significantly more credible than a raw before/after comparison with no controls at all. Finance teams understand statistical methods. An honest “here’s our regression model, here are its assumptions, and here’s the range of estimates we’re confident in” is more defensible than a clean-looking number with no methodology behind it.
The key word is transparency. Don’t present a statistical estimate as if it were experimental proof. Present it as what it is — a rigorous estimate with defined assumptions — and the board will generally respect that honesty more than false precision.
Cost Per Transaction: The Single Most Defensible Board Metric
If you’re looking for the one metric that consistently survives board scrutiny across industries, processes, and use cases, cost per transaction is it. It’s specific, it’s financially linked, it’s auditable, and it captures the full efficiency story in a single number that anyone with financial training can immediately interpret.
How to Calculate It Properly
Cost per transaction is the fully loaded cost of completing one unit of the relevant process — one invoice processed, one customer query resolved, one contract reviewed, one fraud alert triaged — divided across all transactions in the measurement period.
Fully loaded means: direct labour cost (time spent on this process multiplied by employee cost rate), technology costs allocated to this process (licensing, infrastructure, support), exception handling costs (the additional cost of cases the AI couldn’t process without human intervention), error correction costs (rework, appeals, or corrections resulting from AI errors), and management and oversight costs (the human time spent reviewing AI outputs and managing the system).
Teams that present cost per transaction using only the labour time saved understate costs and overstate savings. A more accurate number includes all of the above components. It may be less dramatic, but it will hold up under audit. A smaller, auditable number is worth more in a board setting than a larger, unverifiable one.
Benchmark Ranges for 2026
Enterprise automation implementations in 2026 that follow rigorous measurement methodology are reporting cost-per-transaction reductions of 30-50% for well-defined, high-volume processes — invoice processing, customer query routing, contract data extraction, document classification. More complex, judgment-intensive processes typically see 15-25% reductions. These ranges are defensible as benchmarks for setting board expectations before results are in, as long as they’re framed as industry benchmarks rather than guaranteed outcomes.
Payback periods for well-scoped enterprise AI deployments measured across the full cost base typically range from six to eighteen months. Presentations that claim three-month payback should expect to face significantly more scrutiny, because that timeline typically reflects either an undercount of costs or an optimistic early measurement period before error rates and exception handling costs stabilize.
Connecting Cost Per Transaction to the P&L
The final step — and the one most teams skip — is multiplying the per-transaction improvement by the annual transaction volume to produce a total annual cost impact, then connecting that figure to the relevant line on the P&L. If accounts payable processing costs fall by $9 per invoice and the business processes 180,000 invoices per year, the annual impact is $1.62 million. That figure belongs on a specific cost line in the operating expenses. It should be shown alongside the total investment in the AI system, producing a clear payback calculation.
This connection — from metric to P&L — is what most AI teams don’t make, because it requires knowing which cost lines are affected and by how much. That’s another reason why finance involvement from the start is essential rather than optional.
The Reallocation Proof: What Boards Need to Know About the Hours You Save
Every experienced board member knows that saving time doesn’t automatically save money. The reallocation question — what did the people whose time was freed up actually do differently? — is one of the most important and most commonly dodged questions in AI ROI presentations.
Three Honest Scenarios
There are essentially three honest outcomes when AI saves human hours, and each has a different financial story to tell the board.
Scenario 1: Direct headcount reduction. The freed hours translated into a reduction in the size of the team through attrition or restructuring. The financial impact is direct and measurable: reduced payroll, benefits, and overhead. This is the easiest story to tell to a board, because the savings appear on the P&L. The risk is that it requires careful handling of workforce communication and may involve severance costs that need to be included in the full ROI calculation.
Scenario 2: Redeployment to higher-value work. The freed hours were redirected to activities that generate measurable additional output — more customer relationships managed, more deals closed, more cases resolved, more strategic analysis completed. This is a credible story to tell, but it requires evidence. The board should see specific, quantified examples of what the redeployed time produced — not a general statement that “the team is now more strategic,” but a documented outcome like “the customer success team managed 35% more accounts per person, producing $820,000 in incremental retention revenue.”
Scenario 3: Absorption without measurable impact. The freed hours were absorbed into the working day without producing a documented change in output or cost. This is the most common outcome and the hardest to present honestly. The right approach is to acknowledge it clearly, explain what organisational changes are being made to prevent future savings from being absorbed the same way, and reset the ROI calculation to reflect only the gains that were genuinely captured.
Boards will respect honest scenario 3 much more than they will respect a scenario 2 story they don’t believe. If the hours weren’t genuinely redeployed to something measurable, don’t claim they were.
Risk-Adjusted ROI: What Boards Are Now Demanding Beyond the Numbers
In 2026, board-level scrutiny of AI investments extends beyond financial returns. Directors are now routinely asking about the risk profile of AI systems — not because they’re opposed to the technology, but because AI-specific risks have begun to materialise in ways that affect both cost and liability. A presentation that delivers strong financial metrics but ignores the risk dimension will increasingly face pushback from governance-focused board members.
The New Risk Metrics Boards Are Tracking
AI governance frameworks emerging in 2026 have produced a set of board-level risk metrics that are becoming standard in well-governed enterprises. These include:
- AI system inventory coverage: What percentage of AI systems in production are formally registered, risk-classified, and assigned a human owner? A board that doesn’t know what AI is running in its enterprise cannot manage the risk of that AI. Boards are beginning to ask for this number explicitly.
- High-risk model control coverage: For AI systems classified as high-risk (those making decisions affecting customers, employees, financial outcomes, or regulatory compliance), what percentage have documented controls, testing protocols, and escalation procedures? This is the AI equivalent of internal controls in financial reporting.
- Model drift detection rate: AI models degrade over time as the data they were trained on becomes less representative of current conditions. What percentage of production models are being monitored for drift, and what’s the average time from drift detection to remediation? Boards that have been presented with AI ROI and later found that the model had degraded are now asking this proactively.
- Exception and error rate trends: Is the rate of AI outputs that require human intervention increasing or decreasing over time? An increasing exception rate signals model degradation and is a leading indicator of rising operating costs. Boards should be seeing this trend data, not just a point-in-time snapshot.
Regulatory Risk in the 2026 Environment
The EU AI Act, which has phased into enforcement during 2025-2026, has added a compliance dimension to board-level AI oversight that didn’t exist at the same intensity two years ago. For enterprises operating in or selling into European markets, the regulatory classification of AI systems — and the compliance costs associated with high-risk classifications — now belong in any comprehensive AI ROI calculation.
Boards are asking: are any of our AI systems subject to mandatory conformity assessment under the EU AI Act? What are the compliance costs? What is the liability exposure if a high-risk system produces a harmful outcome? These questions don’t replace the financial ROI conversation — they exist alongside it, and teams that haven’t thought through them will find the conversation expanding beyond what they prepared for.
Building the Audit Trail That Survives Finance Review

An audit trail for AI ROI is a documented record that allows any sceptical reviewer — the CFO, an internal auditor, or a board member with financial expertise — to trace a claimed result back through the measurement methodology to the raw data it was built on. It doesn’t need to be elaborate, but it needs to exist and it needs to be complete.
The Five Components of a Board-Grade Audit Trail
1. Baseline documentation. A timestamped record of the pre-deployment metrics, specifying the time period, the data source, the extraction methodology, and the individual who signed off on the baseline as accurate. This document should have been created before deployment, not reconstructed afterward. If it was created after deployment, state that clearly and explain why — and expect more scrutiny.
2. Measurement methodology specification. A written description of exactly how post-deployment metrics are calculated, using the same methodology as the baseline. If the baseline used one definition of “cost per transaction” and the post-deployment measurement uses a slightly different definition (because the system categorises costs differently, or because a new cost component was added), the comparison is invalid. Consistent methodology throughout is non-negotiable.
3. Cost accounting record. A complete breakdown of all investment costs, categorised by type (technology, implementation, maintenance, internal staff time, training, etc.) and time period. This should be reconcilable to the company’s accounts — not a separate estimate that floats free of the financial records. Finance should be able to trace every cost figure back to an invoice, a payroll record, or a time-tracking entry.
4. Attribution methodology statement. A clear explanation of how you separated the AI’s contribution from other factors affecting the measured metrics. This is where holdout group results, staggered rollout comparisons, or statistical control methodology is documented. This document should also acknowledge the limitations of the attribution method — what it can and can’t prove, and what assumptions are baked in.
5. Independent review record. Documentation that someone outside the project team — ideally from finance or internal audit — reviewed the methodology and found no material errors. This doesn’t need to be a full audit, but a documented independent review significantly increases the credibility of the findings. If no independent review has occurred, boards will want to understand why.
Why the Audit Trail Matters Even If Nobody Asks For It
Most boards won’t demand to see the full audit trail during the presentation itself. But knowing it exists changes how a presentation lands. When a CFO asks a hard question and the presenter responds, “We have full documentation on the methodology, the baseline record, and the attribution analysis — I can share that with you and your team after this session,” the conversation moves forward. When the same question receives a more hesitant answer, the conversation stalls.
The audit trail isn’t just about satisfying formal governance requirements. It’s about the visible confidence that comes from knowing your numbers are defensible at every level. Boards are skilled at detecting the difference between a team that has done the underlying work and a team that built a presentation. The audit trail is how you demonstrate which one you are.
The Three-Slide Structure That Actually Gets AI Budgets Approved
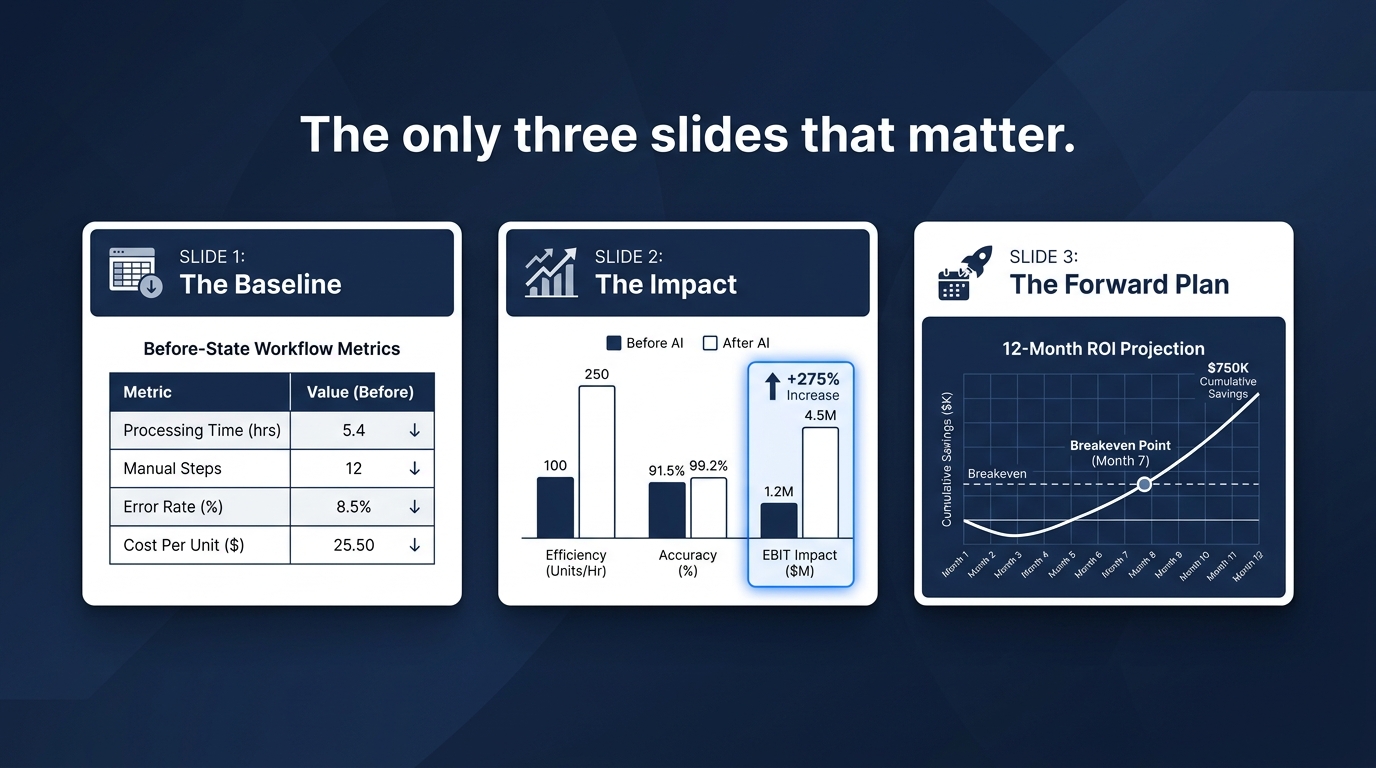
More is rarely better in a board setting. Directors are seeing more AI presentations than at any previous point, and the ones that cut through are concise, confident, and focused on the specific financial and risk questions the board cares about. The forty-seven slide deck is almost never the right format. The right format is three core slides, supported by a detailed appendix.
Slide 1: The Baseline
The first slide exists for one purpose: to establish, beyond doubt, what the process looked like before AI was involved. It should show the specific metrics you’re measuring (cost per transaction, cycle time, error rate), the time period of the baseline, the data source, and who validated the numbers. It should also note any known variability in the baseline — seasonal patterns, outlier periods — and explain how those were handled.
This slide should feel almost boring. That’s the point. A baseline slide that tries to be compelling or dramatic will raise questions about whether the numbers were selected for their narrative convenience. A baseline slide that is dry, specific, and sourced signals that the team is serious about measurement.
Slide 2: The Impact
The second slide shows the post-deployment results using the same metrics and the same methodology as the baseline. It includes the attribution methodology — how you established that the AI caused the improvement — and the confidence level of the attribution. It translates the operational results into P&L terms: this many transactions per year, at this much improvement per transaction, equals this annual financial impact. It shows the total cost of the AI deployment alongside the financial impact, producing a clear payback calculation.
This slide may also show risk-adjusted figures — a base case, a conservative case, and a note on what assumptions drive the difference. Boards prefer conservative estimates with good methodology over aggressive estimates with weak methodology. Present the conservative number confidently rather than the optimistic number cautiously.
Slide 3: The Forward Plan
The third slide answers the implicit question the board is really asking: what do you want from us, and what will we get if we give it to you? It shows the current run rate of the AI initiative, the projected trajectory over the next 12 months (with the assumptions that drive the projection), the next stage of investment required if expansion is proposed, and the governance structure for ongoing measurement and reporting.
This slide should also include a clear statement of what ongoing reporting the board will receive — which metrics, at what frequency, reviewed by whom. Boards are more willing to approve ongoing investment when they have a clear picture of how they’ll continue to track it. Uncertainty about ongoing visibility makes approval harder, even when the initial results are strong.
What Ongoing Reporting Should Look Like After Approval
Getting the board to approve an AI investment is not the end of the measurement challenge — it’s the beginning of the ongoing accountability structure. How you report performance in subsequent quarters will determine whether the programme retains board confidence over time or gradually loses it as novelty fades and scrutiny increases.
Quarterly Dashboard Design
The ongoing board-level AI dashboard should be concise and consistent. Consistency matters enormously: if you change the metrics or the methodology between reporting periods, the board can’t track progress, and it signals that you’re managing the narrative rather than reporting objectively. Choose your core metrics before the first deployment, and stick with them.
A defensible quarterly dashboard for a board-level AI programme typically covers four areas. First, financial performance: current cost per transaction vs baseline, annualised financial impact year-to-date, cumulative investment vs cumulative return, and projected payback period update. Second, operational health: current volume, exception rate, error rate, and cycle time. Third, model integrity: drift indicators, recent retraining events if any, and any material changes to the AI system that could affect performance comparability. Fourth, risk posture: any new risk flags, regulatory developments affecting the programme, and status of key controls.
The total dashboard should fit on one or two pages. More than that and it starts to resemble a management report rather than a governance document, and it will be read less carefully as a result.
When Results Disappoint: The Honest Reporting Standard
The reporting standard that most determines long-term board confidence is how a team handles underperformance. Every AI programme will have periods where results fall below expectations — models drift, volumes change, process conditions shift, exceptions spike. The teams that preserve board trust through those periods are the ones that report the underperformance clearly, explain the cause, and present a specific remediation plan.
The teams that damage board trust are the ones that reframe metrics when results are bad, delay reporting to see if things improve, or explain disappointing results with vague language that obscures the actual problem. Boards have seen all of those patterns, and they respond to them by tightening oversight, reducing future investment, or both.
Honest reporting of a problem is almost always less damaging than evasive reporting, even when the problem is significant. A board that trusts management’s data — because management has been candid when the data is unflattering — is a board that will continue to fund initiatives through difficult periods. That trust, once established, is one of the most valuable assets an AI programme can have.
Boardroom Credibility Is Built Before the Meeting Starts
Almost everything described in this post has to be done before the presentation begins. The baseline has to be documented before deployment. The holdout group has to be designed before rollout. The cost accounting has to be built into the project budget from day one. The finance team has to be involved in metric design at the scoping stage. The audit trail has to be constructed as the project runs, not assembled afterward from memory.
This is the fundamental shift that separates AI programmes that win sustained board support from those that generate initial enthusiasm and then gradually lose credibility. It’s not primarily about the metrics — it’s about when and how those metrics are designed.
The Pre-Deployment Checklist
Before any AI deployment that will require board-level ROI reporting, the following should be in place:
- A documented baseline for the specific metrics that will be measured, drawn from system records and signed off by finance, covering at least 90 days of operations before deployment.
- A written measurement methodology that specifies exactly how post-deployment results will be calculated, using the same approach as the baseline.
- A complete cost accounting framework that covers all direct and indirect costs of the AI programme, connected to the company’s financial systems.
- An attribution design — holdout group, staggered rollout, or statistical control — that establishes how AI’s contribution will be separated from confounding factors.
- Finance sign-off on the ROI measurement framework before deployment begins.
- A defined reporting cadence and dashboard structure that will continue after deployment.
This checklist takes time to work through. But every element of it represents a question the board will ask after deployment. The choice is between answering those questions with evidence you designed in advance, or trying to reconstruct defensible answers after the fact. The former is always more credible, and usually less stressful.
The Long Game: AI Programmes That Earn Compound Credibility
The boards that are most enthusiastic about AI investment in 2026 are not necessarily the ones whose early deployments produced the most dramatic results. They’re the ones whose management teams built the strongest measurement disciplines early, reported honestly through good and bad periods, and accumulated a track record of delivering what they said they would deliver — adjusted accurately when they didn’t.
That credibility compounds. A board that has seen three or four AI initiatives reported to a consistent standard, with honest attribution and complete cost accounting, will approach the fifth initiative with much more confidence than a board that has been served inconsistent, optimistic, or poorly-sourced metrics. The investment in measurement rigour pays dividends not just in the current presentation, but in every future conversation about AI investment the organisation will have.
The question “what does the board actually ask?” has a deeper answer underneath the specific questions covered in this post. What they’re really asking, every time, is: do the people presenting this understand business well enough to have measured it properly? The metrics are the evidence for the answer. Build the evidence first, and the questions become much easier to handle.
Key Takeaways
- Design measurement before deployment, not after. Baselines, holdout groups, and cost accounting frameworks must be in place before AI goes live, or the resulting data is almost impossible to defend under scrutiny.
- Lead with P&L-linked metrics, not vanity stats. Cost per transaction, EBIT impact, payback period, and margin lift are the metrics boards use to evaluate investments. Adoption rates and hours-saved figures are context, not proof.
- Solve the attribution problem explicitly. Use holdout groups, staggered rollout designs, or statistical controls to separate AI’s contribution from confounding factors. Boards with financial sophistication know how to ask the counterfactual question.
- Calculate fully loaded costs. Include labour, technology, exception handling, error correction, maintenance, and management oversight. Understating costs to inflate ROI will be discovered and will damage credibility.
- Answer the reallocation question honestly. If freed hours translated into measurable business outcomes, document and quantify them. If they were absorbed without measurable impact, say so and revise the ROI calculation accordingly.
- Build and maintain an audit trail. Baseline documentation, methodology specification, cost accounting records, attribution analysis, and independent review — each element supports the others and collectively creates a presentation that can survive the most demanding board questioning.
- Keep ongoing reporting consistent and honest. The metrics and methodology should not change between reporting periods. Underperformance should be reported directly, with root cause analysis and a specific remediation plan.