

Most sellers who open TikTok Creative Center do one of two things: they scroll through the Top Ads tab looking for content to imitate, or they glance at a trending hashtag and close the tab. Both are expensive habits dressed up as research.
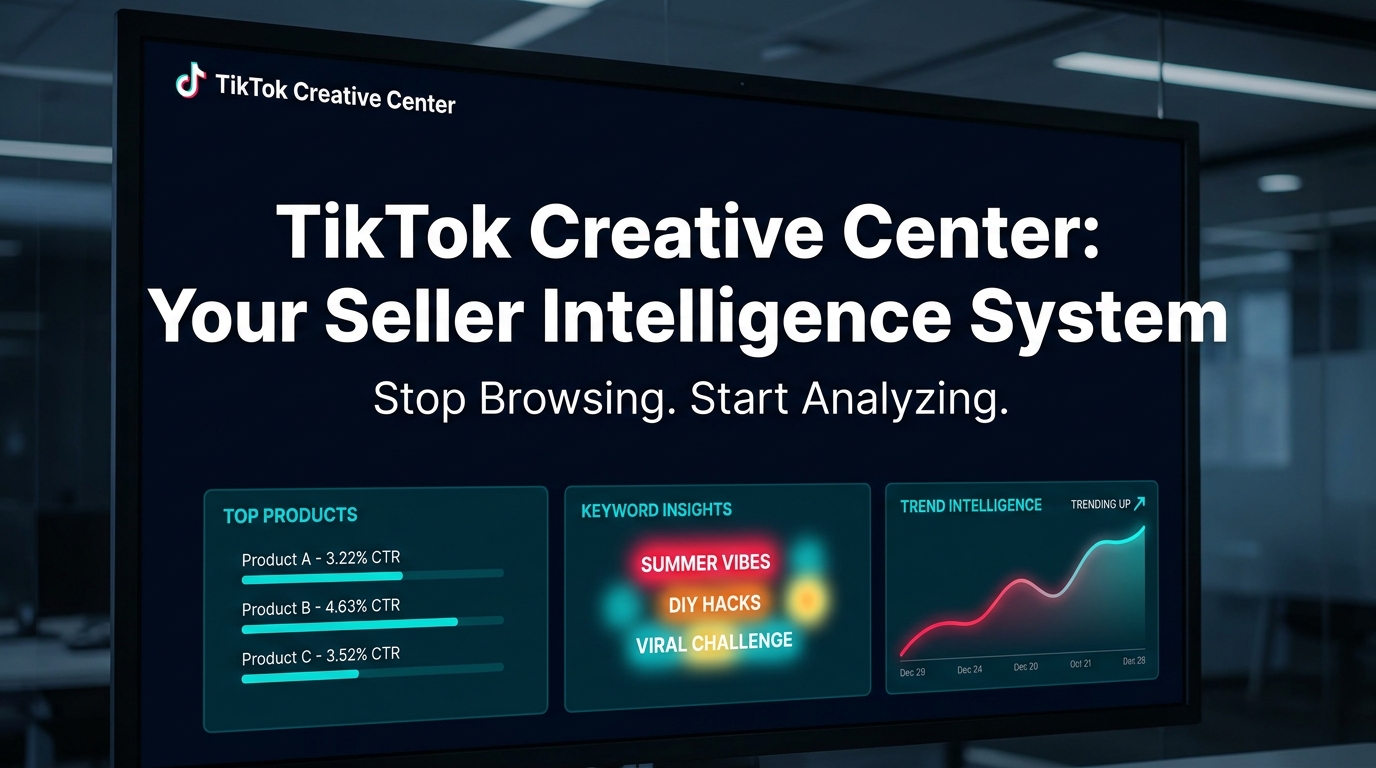
TikTok Creative Center — available free at ads.tiktok.com/business/creativecenter — is not a content inspiration board. It’s a live market intelligence feed built on real ad spend data, real conversion rates, and real consumer behavior across hundreds of millions of active users. The sellers pulling genuine competitive advantage from it aren’t browsing it. They’re running structured analysis sessions against it, cross-referencing the outputs with external validation tools, and building weekly workflows that turn the data into product and content decisions.
This guide is for that second group — or for sellers who want to become it. We’ll go module by module through every meaningful feature, explain what each metric actually signals (and what it doesn’t), expose the mistakes that keep most sellers stuck in surface-level use, and give you a repeatable workflow for making Creative Center the backbone of your TikTok intelligence operation in 2026.
There’s no fluff here. If you’ve already read a “top 5 TikTok Creative Center tips” post, this goes several layers deeper.
What TikTok Creative Center Actually Is (And Why Most Sellers Misread It)
Creative Center is TikTok’s official, publicly accessible advertising intelligence platform. While it was built to help advertisers create better-performing campaigns, it inadvertently exposes something far more valuable: a real-time map of what’s selling, what’s being searched, which content formats convert, and which markets are heating up before everyone else notices.
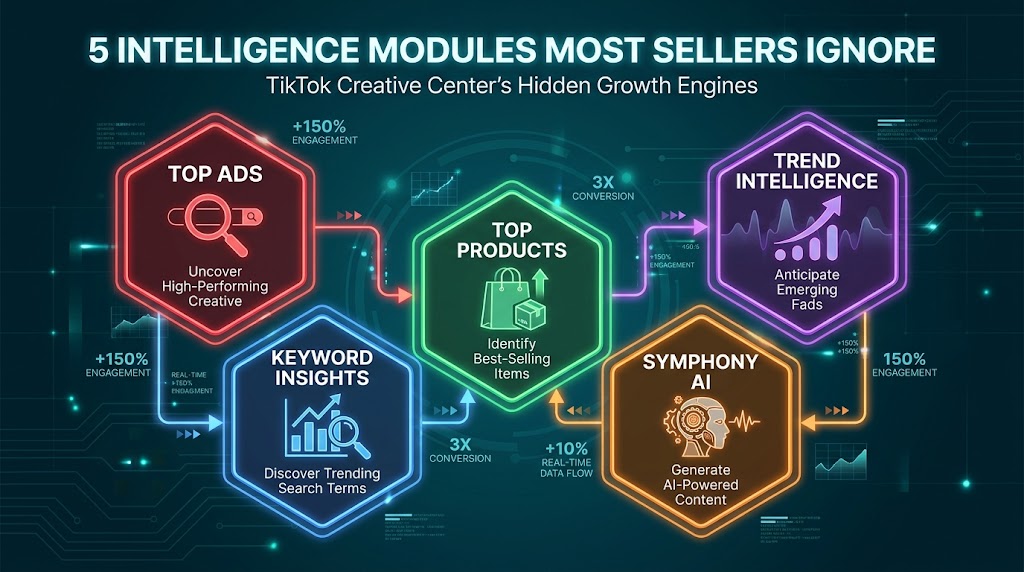
The Five Core Modules
Understanding Creative Center starts with understanding its architecture. There are five distinct intelligence modules, and most sellers only meaningfully engage with one or two:
- Top Ads Dashboard: A filterable library of high-performing auction ads across industries, regions, objectives, and formats. This is the most-used and most-misused section.
- Trend Intelligence (Trend Discovery): Real-time tracking of trending hashtags, songs, creators, and videos by region. Includes forecasting signals for breakout content.
- Keyword Insights: Performance data on the top 500 trending keywords from real TikTok ads — including CTR, CVR, CPA, impressions, and engagement metrics.
- Top Products: A product leaderboard showing trending TikTok Shop items ranked by ad volume, CTR, CVR, spend, and GMV. Filterable by category and region.
- Symphony AI Tools (Creative Studio + Assistant): An integrated AI layer for scriptwriting, video generation, and creative benchmarking — powered by ByteDance’s own models.
Access Tiers: Free vs. Logged-In
Basic Creative Center features — including browsing Top Ads, Trend Discovery, and some keyword data — are accessible without logging in. However, full access to Keyword Insights, Top Products, Creative Insights, and Symphony AI tools requires a TikTok Business account. Creating one is free. If you’re operating a TikTok Shop or running any paid ads, you almost certainly already have one.
The desktop-only caveat matters: several features, including the full Keyword Insights word cloud, the interactive frame-by-frame engagement graphs on Top Ads, and Symphony Creative Studio, only function properly on a desktop browser. Mobile access is limited and not suited to analytical use.
Why Sellers Systematically Misread It
The fundamental misread is treating Creative Center as a content library rather than a market data source. When sellers browse Top Ads for “inspiration,” they’re consuming output without analyzing inputs. The intelligence value of Creative Center isn’t in the content itself — it’s in the performance metrics attached to that content: what retention rate is it hitting? What’s the click-through rate? How long has it been running? What’s the conversion rate by region?
A seller who ignores those questions and walks away with a video concept to replicate has done the equivalent of looking at a bestseller list and copying the cover art. The data is pointing at something much more specific, and we’ll spend the rest of this guide unpacking exactly what.
The Top Products Tab: Reading Real Market Signals Before the Market Does
The Top Products tab is Creative Center’s most commercially direct feature. It aggregates data from TikTok Shop and TikTok advertising to show which products are currently attracting the most ad spend, generating the most views, and converting at the highest rates — broken down by category and region.
The Metrics That Actually Matter
Not every metric in the Top Products tab deserves equal attention. Here’s how to prioritize:
- CTR (Click-Through Rate): The percentage of viewers who tap through to the product page. Industry benchmarks in TikTok ecommerce typically run between 1–4%. Anything above 4% indicates either an exceptionally compelling hook or strong category-audience fit. Use CTR to identify which product categories are naturally engaging — not just which have the most spend behind them.
- CVR (Conversion Rate): The percentage of clickers who actually purchase. High CVR with moderate CTR is the sweet spot — it signals a product that closes well once interest is triggered. A product with 100% CVR and $64K spend (like phone cases in early 2026 data) signals near-zero buyer hesitation.
- GMV (Gross Merchandise Value) + Spend: The ratio of GMV to ad spend is the closest proxy Creative Center gives you to return on ad spend (ROAS). A product showing $231K GMV on a category like perfume with 16K ads tells you it’s a competitive, high-volume market. That’s different from a signal to enter it.
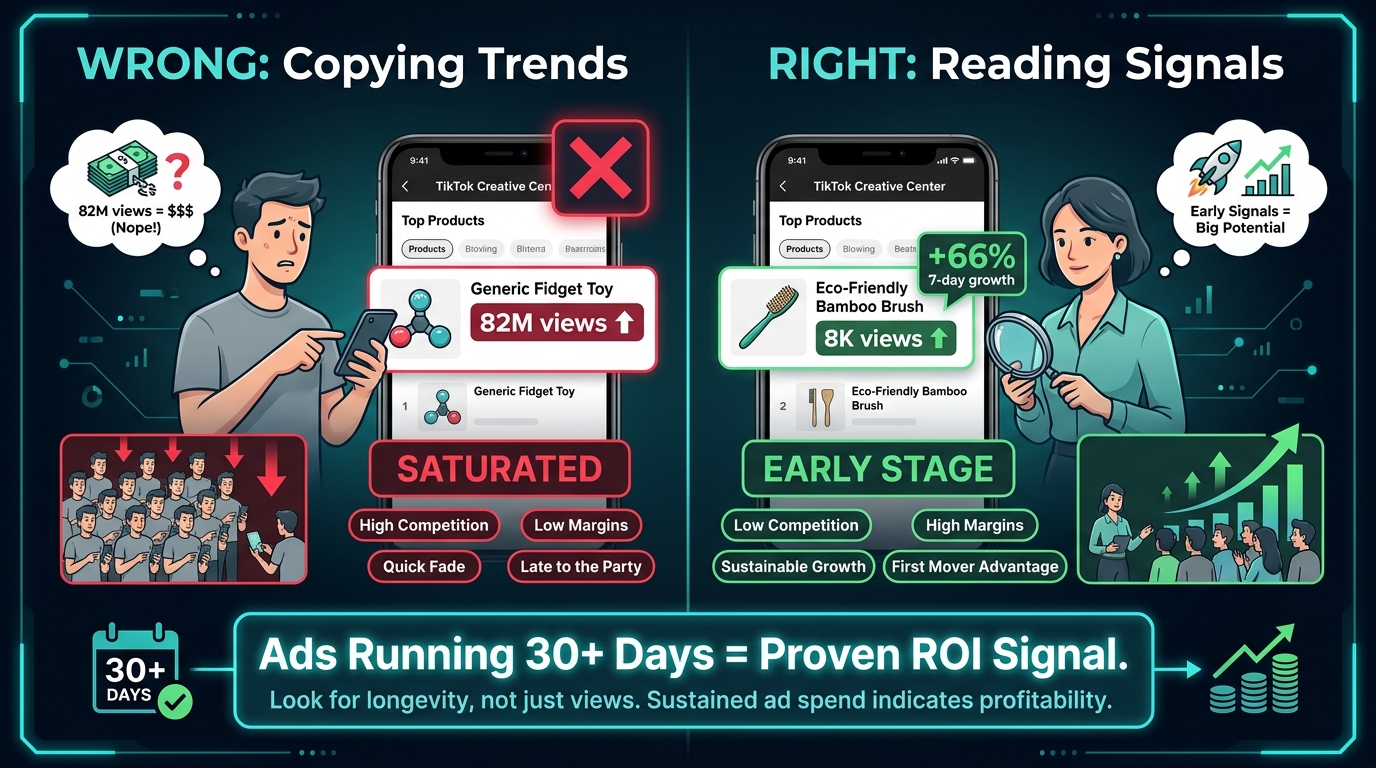
- Video Views and Creator Count: The relationship between these two numbers is critical and overlooked. A product with 82M views and 16K creator videos is deeply saturated. A product with 8K views and only 40 creator videos is potentially early-stage — especially if its week-over-week view count is climbing.
- 7-Day Growth Rate (Popularity Change): This is arguably the most valuable single metric in the tab. A product showing +66% 7-day growth with still-low absolute view counts is in the breakout window. A product showing -11% to -19% month-over-month decline is past its cycle peak, even if the absolute numbers still look impressive.
The 30-Day Ad Run Rule
One of the most reliable heuristics for reading Top Products data: if an ad for a product has been running continuously for 30 days or more, it is almost certainly profitable. Advertisers don’t sustain spend on losing campaigns for a month. This rule cuts through the noise of viral spikes — which are often organic, not paid — and identifies products with genuine, repeatable commercial demand.
When you find a product with 30+ day ads, the next question isn’t whether to sell it — it’s whether the category is still approachable. Cross-reference the creator count and view trajectory. High views + high creator count + long-running ads = category is mature. You’d need a genuine differentiation angle (pricing, positioning, audience niche) to enter profitably. Low views + low creator count + long-running ads = a smaller but highly monetizable niche that hasn’t yet attracted crowding.
Category Hotspots in 2026
The categories consistently performing across Top Products data in early 2026 include: Beauty and personal care (particularly perfumes, moisturizers, serums), Apparel (basic T-shirts and trousers remain persistently strong), Tech accessories (phone cases showing exceptional CVR), and Health/wellness supplements. Within each macro-category, the valuable intelligence isn’t at the top-level filter — it’s in the sub-category breakdown where genuine gaps still exist.
What the Top Products Tab Can’t Show You
Top Products surfaces trending products from TikTok advertising data, not direct TikTok Shop sales data. You’ll see ad-driven metrics, not organic GMV. That means a product could be trending in the tab because a single well-funded competitor is heavily advertising it — not because the market is broadly healthy. Always cross-reference against TikTok’s own Seller Center search data, third-party tools like FastMoss or Kalodata, and external demand signals on Amazon and eBay.
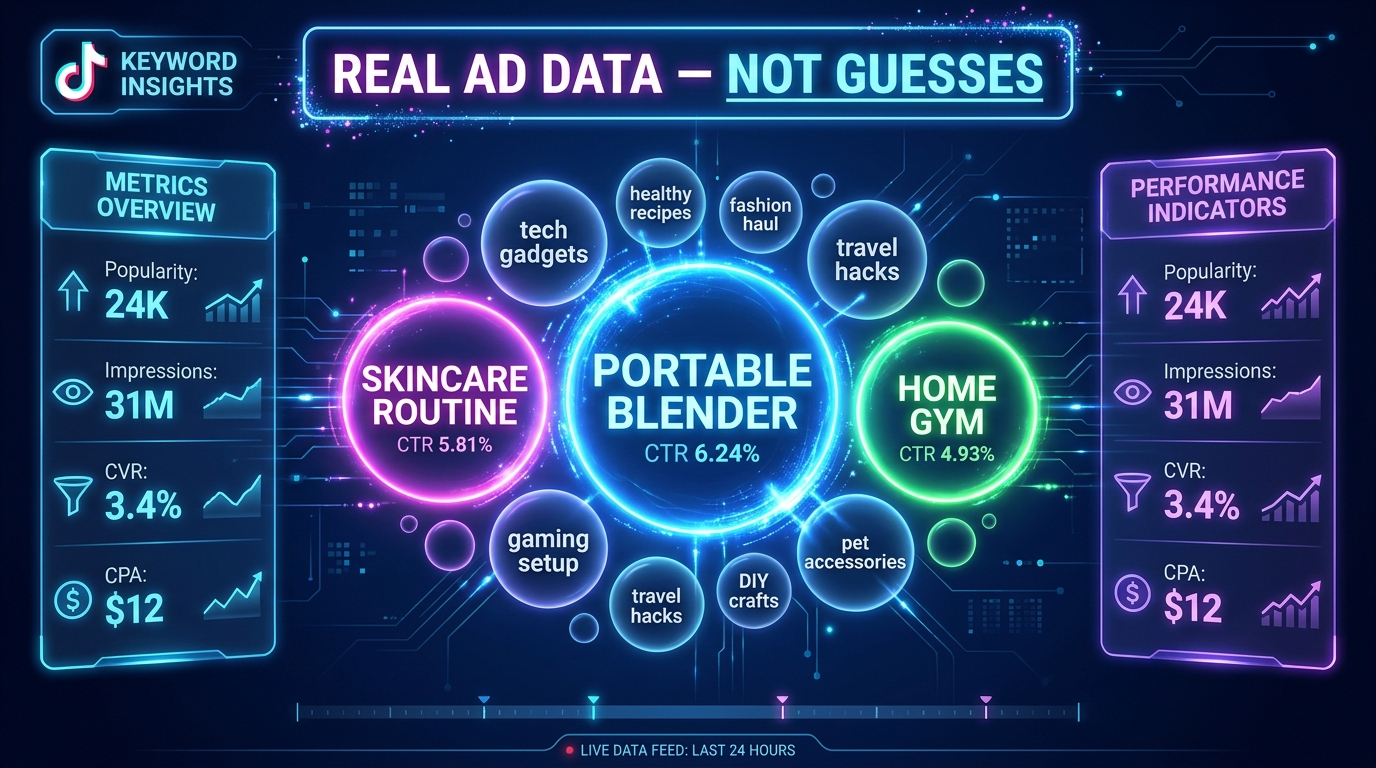
Keyword Insights: The Data Layer Most Sellers Leave on the Table
If the Top Products tab is the what of TikTok commerce — what’s selling — then Keyword Insights is the why and the how. It reveals what language buyers are using, what search intent looks like in your category, and which specific phrases drive clicks and conversions in paid ads. Most sellers either don’t know it exists or assume it’s just another keyword planner. It’s significantly more specific than that.
How Keyword Insights Differs from Standard Keyword Research
Tools like Google Keyword Planner, Ahrefs, or even TikTok’s own organic hashtag search tell you how often words are searched. Keyword Insights in Creative Center tells you how those same words perform as ad copy inside TikTok ads — with CTR, CVR, CPA, 6-second view rate, and impression data attached.
That’s a fundamentally different signal. A phrase like “best portable espresso maker 2026” might have moderate organic search volume but carry a 6%+ CTR in paid TikTok ads — meaning when advertisers use that phrase in their creative, it gets clicked at above-average rates. That data is invisible everywhere except Keyword Insights.
The Top 500 Keyword Framework
Keyword Insights displays up to 500 trending terms at a time, filterable by region, industry, objective, and keyword type. The default view ranks by Popularity — a proprietary TikTok score combining search and ad activity. For sellers, this is rarely the most useful sort order. The more valuable sorts are:
- Sort by CTR: Reveals which phrases are actively compelling viewers to act. High-CTR keywords are copywriting gold — they’re phrases your audience responds to emotionally or with high intent. Use them in video hooks, on-screen text, and ad copy.
- Sort by CVR: Shows which phrases drive purchases, not just clicks. High CVR + moderate CTR keywords signal transactional intent — the viewer who clicks on this phrase is ready to buy. These belong in bottom-of-funnel content and product pages.
- Sort by Popularity Change: Rising keywords — those gaining popularity fast over the past 7 or 30 days — are trend signals. If your product category has a keyword climbing fast, it’s a timing indicator. Build content around it now, not after it peaks.
The Word Cloud Technique for Hook Development
Creative Center’s Keyword Insights word cloud view, sorted by CTR, is one of the most underused tools in the platform. The visual format makes it immediately obvious which phrases are pulling click-through — larger bubbles represent higher CTR. For content creators and ad teams, this is a cheat sheet for opening hooks.
A practical application: search a broad category term (e.g., “skincare”), switch to the word cloud view sorted by CTR, and capture the top 10–15 phrases. These are your hook vocabulary for the next production sprint. Not as direct quotes — as language patterns. The specific phrasing reveals what emotional register your audience responds to: urgency, transformation, social proof, specificity.
Building a Product-Level Keyword Research Workflow
For product-specific research, the workflow looks like this:
- Enter your core product term (e.g., “portable blender”) in Keyword Insights. Review the top keywords sorted by CVR first — these are your purchase-intent signals.
- Switch to popularity change sort and filter for the past 7 days. Note any phrases with rising momentum that have moderate competition — these are content timing opportunities.
- Move to the Top Ads tab and search for ads using the same keywords. Look at which video formats and hooks are associated with the high-CTR phrases you identified.
- Cross-reference the keyword list with TikTok Seller Center’s search volume data (if you’re a registered seller). Where organic search volume and paid CTR data align, you have your highest-priority content and ad copy targets.
One advanced technique: use Keyword Insights to identify what practitioners call “search intent keywords” — phrases that signal a buyer is actively looking for a solution, not just browsing content. In categories like health and wellness or home improvement, these often follow the pattern “best [product] for [specific use case].” These phrases consistently outperform generic category keywords on both CTR and CVR metrics.
Top Ads Intelligence: Beyond Inspiration, Into Structural Analysis
The Top Ads Dashboard is the most visible part of Creative Center and the most thoroughly misused. Sellers browse it looking for video concepts to replicate. What they should be doing is structural analysis — reading the frame-by-frame data to understand why a specific ad converts, not just what it looks like.
Using the Frame-by-Frame Engagement Graph
Every ad in the Top Ads Dashboard, when you click “See Analytics,” includes an interactive engagement graph that maps viewer retention against the video timeline. The graph is indexed 0–100 (with 100 being the highest engagement point in the video). This is where the real intelligence lives.
What to look for:
- The 0–3 second drop rate: The steepness of the curve in the first three seconds tells you how effective the hook is. Top-performing ads in the database show remarkably flat curves in this zone — they hold attention from the first frame. If the curve drops sharply before the three-second mark, the hook is leaking viewers before the message lands.
- Engagement spikes: Sudden rises in the engagement line — which appear as peaks against the general decline curve — indicate a moment that re-engaged viewers: a reveal, a price drop on-screen, a surprising claim, or a visual transition. These spikes tell you exactly what moment in your own content to engineer for maximum impact.
- The CTA zone: If the engagement graph maintains a relatively high score through the final 5 seconds, that’s a strong indicator that the call-to-action (CTA) is landing effectively. Steep drops in the last five seconds suggest viewers are abandoning before the conversion message.
Hook Pattern Taxonomy
Research across 34,635+ clips analyzed from TikTok’s high-performing ads database reveals a clear hierarchy of hook effectiveness. The “Product and Outcome Showcase” hook — which leads immediately with a visual of the product in use, paired with the outcome it delivers — generates an average 6,037 views per clip, roughly double the platform average. Contrast this with “Story Setup” hooks, which delay the product reveal in favor of narrative context — these consistently underperform on initial view metrics because they ask for attention before delivering value.
The practical implication: your first three seconds should answer “what is this and what does it do?” before anything else. That sounds obvious, but a significant portion of brand-created TikTok content still opens with logos, music beds, or scene-setting that delays the value delivery long enough to lose the swipe-prone viewer.
Building a Systematic Swipe File
A swipe file — a curated archive of high-performing ad examples — is standard practice in direct response marketing. For TikTok sellers, the structure should go beyond saving video links. For each saved ad, document:
- Hook type (visual, statement, question, social proof, controversy)
- Product category and price point
- Format (UGC selfie, polished studio, voiceover-only, demonstration)
- CTR and CVR from the analytics panel
- Approximate duration and caption usage (present/absent)
- CTA method (verbal, on-screen text, link sticker, both)
Over 4–6 weeks of consistent collection, patterns emerge that are specific to your product category. The swipe file stops being a reference document and becomes a brief for your content production team — a data-backed template for what high-performing creative looks like in your particular niche, not creative in general.
UGC vs. Polished: What the Data Says
Creative Center’s Top Ads data, aggregated across ecommerce categories in 2026, shows a persistent performance advantage for UGC-style (user-generated content) formats over polished studio production. The reasons are structural to TikTok’s format: the platform’s organic content is predominantly casual, native-looking, and conversational. Ads that mirror this aesthetic get passed over the brain’s “skip the ad” filter more effectively than obvious production-quality commercials.
However, the picture is more nuanced at the category level. Beauty and fashion products show nearly equal performance between UGC and polished formats — likely because high-production aesthetics carry a quality signal relevant to those categories. Tech accessories and home improvement products skew heavily toward UGC-style demonstration. Health supplements and fitness products show the strongest UGC advantage of any category, consistent with the social proof dynamic of those markets.
Trend Intelligence: Getting Ahead of the Cycle, Not Behind It
TikTok’s Trend Discovery module is frequently positioned as a hashtag finder. For sellers, it’s more accurately a timing instrument — a way to measure where a trend is in its adoption cycle before committing inventory, ad spend, or content production to it.
The Three Trend Layers: Hashtags, Songs, Creators
Trend Discovery surfaces data across three parallel layers, and each serves a different strategic purpose for sellers:
Hashtags are the most direct demand signal. A hashtag’s post count, combined with its engagement rate and week-over-week growth, tells you where audience attention is concentrated. For sellers, the goal isn’t to find the hashtag with the most posts — that’s typically a saturated signal. The goal is to find hashtags in the 5K–50K post range with accelerating growth. These represent communities that are active but not yet overwhelmed by brand content.
Songs and audio are a secondary but powerful signal layer that most sellers ignore entirely. When a sound is rising fast in Creative Center’s Trend Discovery, it predicts the type of content that will perform in the next 7–14 days on organic TikTok. This matters for sellers because organic-looking paid ads that use trending audio get a native feel that boosts completion rates. TikTok even flags certain tracks as “Approved for business use” — these are licensed for commercial use and are tagged directly in the trend data.
Creator trends reveal which individual content creators are gaining momentum right now — before they reach macro-influencer pricing. For sellers with affiliate or creator partnership programs, Creative Center’s creator trend data is essentially a pipeline of talent at the inflection point between micro and macro — the window when engagement rates are still high and partnership costs are still accessible.
Regional Filter Strategy for Sellers
One of Creative Center’s most powerful capabilities is regional trend filtering — and one of the least used by sellers outside of the US market. The strategic opportunity: US trends frequently appear in smaller English-language markets (UK, Australia, Canada) 2–4 weeks after they emerge in the US feed. Sellers who catch a US trend early can often enter UK or Australian markets before local competition materializes, using the same content that’s already been validated.
The reverse also applies for import-timing decisions. A category trending hard in Southeast Asian TikTok markets (where certain categories trend earlier) often surfaces in Western markets 4–8 weeks later. Sellers who monitor regional trend data can use those signals to time inventory orders ahead of Western demand spikes — a genuine supply chain advantage available entirely through a free tool.
The Interest Overlap Technique
Creative Center’s Trend Intelligence, when combined with Ads Manager’s Audience Insights tab, enables what practitioners call “interest bridging” — identifying non-obvious audience overlaps that competitors haven’t targeted yet. The example that circulates widely: the audience for minimalist wallets has significant overlap with the carbon fiber and EDC (everyday carry) community. Standard category analysis misses this. Interest data from TikTok’s aggregated behavioral tracking surfaces it.
For sellers, this means your next audience targeting decision shouldn’t be based purely on obvious category interests. Spend time in Audience Insights looking at the top 10 interest categories for your current buyers. The less obvious interests in that list — the ones that seem tangentially related to your product — are where your competitors’ targeting is thin and your cost-per-acquisition can be meaningfully lower.
Creative Insights: Using TikTok’s Machine Learning Data Against Your Competition
Creative Insights is Creative Center’s most technically sophisticated feature and arguably its most underleveraged. It uses TikTok’s own machine learning models to label and categorize patterns in high-performing ads — then surfaces those patterns as benchmarkable data for advertisers. The result is that you can access the same structural intelligence TikTok’s own algorithm uses to evaluate creative quality, before you produce your content.
How ML-Labeled Pattern Analysis Works
Creative Insights analyzes top-performing ads by tagging them with descriptive labels across multiple dimensions: video style (tutorial, testimonial, comparison, demonstration, lifestyle), visual elements (text overlays, product close-ups, human faces, transformations), audio type (trending sound, voiceover, music with dialogue), and pacing (fast cuts, static shots, mixed). It then reports which combinations of these elements correlate with above-average engagement, completion rates, and click-through in your specific industry.
The key practical output: you can sort by engagement rate to see which labeled patterns outperform in your category. In health and wellness, for example, “before-and-after transformation” combined with “UGC selfie format” consistently indexes above category average. In home goods, “product demonstration with voice narration” outperforms by a meaningful margin over silent product showcases.
The Video Anatomy Numbers That Matter in 2026
Analysis of 34,635+ high-performing TikTok clips reveals several clear structural patterns that consistently appear in viral and high-converting content:
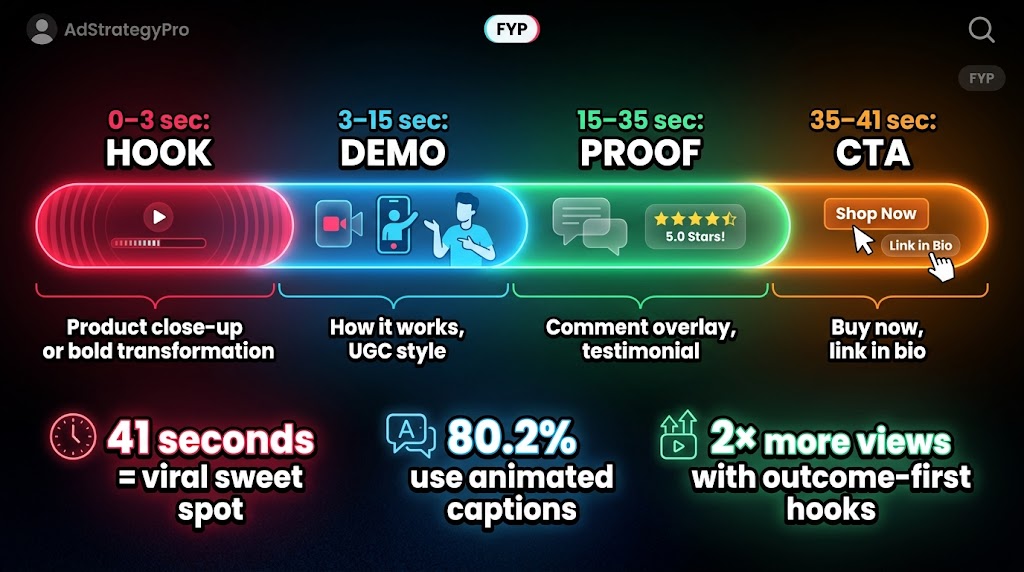
- 41 seconds is the viral sweet spot. Viral clips in the analyzed dataset had a median length of 41 seconds — approximately 18% shorter than the overall platform average for that content category. This isn’t a rule to rigidly apply; it’s a reflection of the attention budget available for commercial content. Long enough to demonstrate and persuade, short enough to complete.
- 80.2% of viral clips use burned-in captions, and 78.6% animate them. Static text overlays still work, but animated captions — where words appear in sync with speech — show meaningfully higher engagement. This matters because a large share of TikTok viewing happens without sound (particularly during initial scroll), meaning captions are often the primary message carrier.
- The 5-second retention benchmark. Winning ads in Creative Center’s database target 40%+ retention at the five-second mark. If you’re running ads and your five-second view rate is below 40%, the hook isn’t doing its job regardless of how strong the rest of the video is. The algorithm weights early retention heavily in distribution decisions.
- Entertaining format ads generate 1.3× higher watch time than purely informational formats. Trend remixes — content that rides a platform audio or visual trend while incorporating a product — show a 14% higher watch time than non-trend content. These aren’t dramatic multipliers, but compounded across a campaign, they represent real cost-per-view differences.
Pre-Production Testing Framework
One of Creative Insights’ most practical applications is pre-production testing — evaluating your content concept against existing performance patterns before you spend money producing it. The process:
- Identify the content format and element combination you’re planning for your next ad (e.g., UGC demonstration with voiceover, 30 seconds, animated captions).
- Filter Creative Insights to your industry and sort by the element combinations closest to your planned format.
- Check the average CTR and completion rate for that pattern combination against category averages.
- If your planned format underperforms in the data, adjust before production — not after spending your budget testing it live.
This doesn’t guarantee results — Creative Insights reflects historical patterns, not predictions — but it provides a meaningful prior probability that lets you make better pre-production decisions, especially when working with limited creative budgets.
Symphony AI Tools: The Integrated Production Layer
Symphony is TikTok’s AI suite embedded directly within Creative Center, and in 2026 it has matured significantly beyond its initial “script generator” positioning. It now comprises two distinct tools with meaningfully different use cases: Symphony Assistant for research and ideation, and Symphony Creative Studio for actual content production.
Symphony Assistant: Research and Scripting in Real Time
Symphony Assistant is an AI chatbot that draws from live Creative Center data — not from a static training set. This distinction matters. When you ask Symphony Assistant “what hooks are performing well in the beauty category this week?”, it’s querying TikTok’s current performance database, not generating a generic answer from data that might be six months old.
Practical applications for sellers include:
- Real-time trend queries: “What audio is trending in the US home goods category right now?” surfaces actual platform data rather than editorial speculation.
- Script generation from product inputs: Provide your product name, key benefit, and target audience, and Symphony Assistant generates TikTok-optimized ad scripts structured around proven hook formats from the Creative Center database.
- Ad benchmarking: Paste in your existing ad script or describe your current content approach, and Symphony Assistant evaluates it against platform best practices drawn from Creative Insights data.
- Writer’s block resolution: For content teams producing high volumes of TikTok content, Symphony Assistant’s ability to generate multiple hook variations from a single product brief is a genuine production accelerator.
Symphony Creative Studio: AI Video for Product Sellers
Symphony Creative Studio, now incorporating ByteDance’s Dreamina Seedance 2.0 model, can generate TikTok-formatted videos from text prompts, product URLs, or uploaded images and clips. The practical ceiling and floor for sellers:
Where it helps: Product photo-to-video generation is the most immediately commercial use case. A product image fed into Creative Studio with a motion prompt can produce a TikTok-native 9:16 video in minutes, complete with motion, music, and on-screen text. For testing early-stage product concepts before investing in UGC shoots, this dramatically reduces the cost of hypothesis testing. AI-generated scripts, subtitles, and voiceovers also meaningfully reduce per-video production overhead for content teams running 15–20 clips per week.
Where it still has limitations: AI-generated videos produced from product images lack the social proof element that UGC delivers. Real-person demonstration content — particularly in health, beauty, and fitness categories — still generates higher trust conversion rates than AI-polished visuals. The platform also requires AI-generated videos to be labeled, which limits their ability to pass as organic-style content. Think of Symphony Creative Studio as a testing and volume tool, not a replacement for high-quality creator-produced content.
The 70% Production Time Reduction Claim
Several practitioners report that using Symphony AI tools — particularly the script generator combined with Creative Studio’s auto-subtitle and voiceover features — reduces overall content production time by approximately 70% for standard product ad formats. This figure refers specifically to the scripting-to-rough-cut stage, not the full production pipeline including creator sourcing, filming, and editing. For sellers running lean content operations, even a 40–50% reduction in time-to-first-draft has meaningful compounding effects on weekly content output.
Building a Weekly Intelligence Sprint Workflow
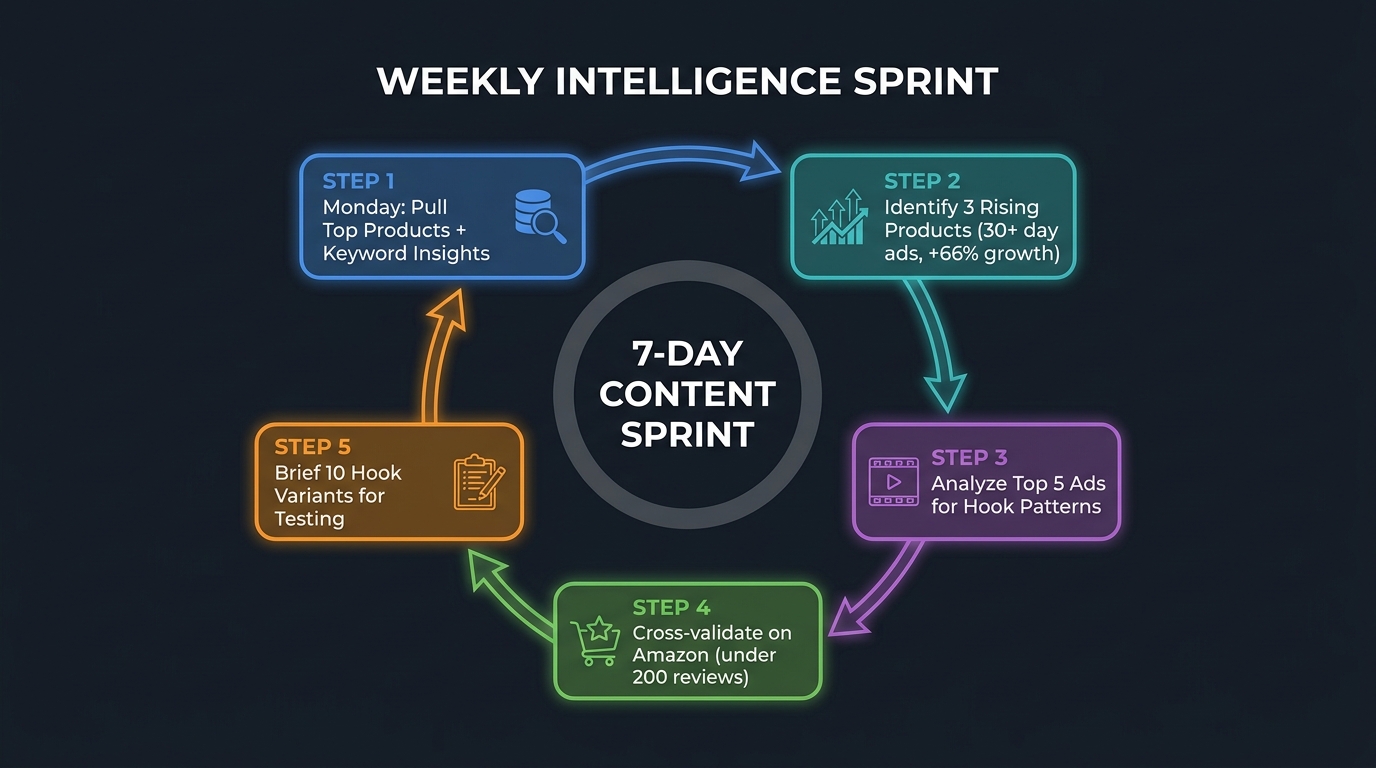
Creative Center is only as useful as the regularity with which you use it. A one-time exploration produces a one-time insight. A structured weekly workflow produces compounding intelligence — the ability to track trend trajectories, monitor competitive shifts, and catch breakout opportunities consistently before they peak.
The Monday Data Pull
Monday is the optimal day to run your Creative Center analysis because TikTok’s 7-day trending data resets toward the end of the week, meaning Monday gives you the freshest relative data for the previous seven days. The Monday pull should take 30–45 minutes and cover:
- Top Products (filter: your category, 7-day view, sorted by popularity change): Identify 3–5 products with significant positive growth trajectories. Note their current video count, average price, CTR, and CVR. Flag any showing +50% or higher 7-day growth with fewer than 100 creator videos — these are your earliest-stage opportunities.
- Keyword Insights (filter: your industry, sort by CTR): Pull the top 15 phrases by CTR. Compare against last week’s list. New entrants in the top 15 are emerging language patterns worth incorporating into next week’s content.
- Trend Discovery (hashtags, 7-day filter): Note any hashtags in the 5K–50K post range with week-over-week growth exceeding 30%. These are your content timing signals for the week ahead.
- Top Ads (filter: your category, sorted by most recent): Review any high-performing ads that entered the top rankings in the past 7 days. What’s new? What hook types are appearing? Are new formats emerging?
Cross-Referencing with TikTok Seller Center
Creative Center data is advertising data. To get the full picture, it needs to be paired with TikTok Seller Center’s search analytics, which reflects organic in-app shopping search behavior. The combination is powerful: Creative Center tells you what’s working in paid content; Seller Center tells you what buyers are actively searching for without being prompted by ads.
When a keyword appears as high-CTR in Creative Center’s Keyword Insights and shows significant search volume in Seller Center, you have a confirmed commercial signal — buyers are both clicking on ads using that phrase and independently searching for it. These double-confirmed keywords should be your highest priority for both ad copy and organic content optimization.
The Amazon and eBay Validation Layer
TikTok Creative Center shows demand signals. External marketplace data validates them. The standard validation protocol: when you identify a rising product in the Top Products tab, cross-check it on Amazon. Specifically, look at the review count for the top 3 listings. Products with fewer than 200 reviews on the top Amazon listings signal a market that has demand (it’s trending on TikTok) but hasn’t yet been captured by established Amazon sellers — meaning both your TikTok Shop and potential cross-platform opportunity are relatively uncrowded.
Products with 1,000+ reviews on dominant Amazon listings are established markets. You can still sell there, but your differentiation requirements are higher and your TikTok advertising cost-per-acquisition will likely be elevated by existing branded competition.
The 10-Hook Testing Sprint
Close out your weekly workflow by using the keyword and trend data you’ve pulled to brief 10 distinct hook variants for the coming week’s content. “Hook variants” doesn’t mean 10 completely different videos — it means 10 different opening 3-second approaches to the same product story. Using the CTR word cloud from Keyword Insights and the hook pattern taxonomy from your swipe file, you can generate these 10 variants in 20–30 minutes per product.
Run them in batches of 3–5 against small audiences in TikTok Ads Manager to identify the top 2–3 performers within 48 hours, then scale spend behind those. This testing cadence, when run consistently, produces a compounding data asset: over time, you develop a category-specific map of what resonates with your specific audience that no competitor with a less disciplined process can replicate.
The Mistakes That Keep Sellers Stuck in Surface-Level Use
After walking through what Creative Center can do when used well, it’s worth cataloguing the specific errors that keep most sellers from reaching that level. These aren’t conceptual mistakes — they’re habitual behaviors that produce systematically worse outcomes.
Copying Winning Ads Instead of Analyzing Why They Win
The most common Creative Center mistake is direct imitation. A seller sees a competitor’s ad with 10M views and makes a close copy — same format, similar hook, comparable product demonstration. The problem: that ad performed in a specific context, with a specific algorithm state, toward a specific audience cohort, probably with spend behind it that you don’t know the scale of. Copying the output without analyzing the structural reasons it performed doesn’t transfer the performance. It transfers the surface appearance.
The engagement graph, the keyword associations, the audience segment it was targeted to, the moment in the trend cycle it was published — these are the variables that produced the result. Your job is to extract those structural insights and apply them to your own creative in your own context.
Ignoring Regional Filters
Creative Center defaults to a US market view. For sellers operating in multiple markets, or for US sellers who want to identify emerging trends before they arrive domestically, ignoring regional filter functionality is a significant missed opportunity. Running your Top Products analysis for US, UK, and Australia in parallel takes an additional 15 minutes but can reveal a 2–4 week timing advantage on trends that are moving from one market to another.
Chasing Trend Peaks Instead of Early Stages
The most expensive Creative Center habit: using it to find what’s already trending, then scrambling to produce content for it. By the time a trend appears prominently in Creative Center’s Trend Discovery with tens of thousands of posts, it is almost always past its growth peak. The platform rewards content that leads trends, not follows them. The value of Creative Center’s data isn’t identifying what’s trending — it’s identifying what’s about to trend, using the growth rate signals in the 5K–50K post range to catch movements before they become universal.
Misreading High-View, Low-Creator Products
A product with very high view counts but very few creator videos is often flagged as a “hidden gem” in various TikTok selling guides. It can be — but it’s often a signal of concentrated paid promotion by a single well-funded advertiser, not organic market interest. To distinguish between the two: look at whether the views are clustered on a small number of videos (concentrated spend) or distributed across many creator videos (organic traction). Concentrated high-view products with few creator videos frequently belong to brands with large ad budgets, not underserved niches.
What Creative Center Can’t Tell You (And What Fills the Gap)
For all its intelligence value, Creative Center has deliberate and structural limitations. Acknowledging them isn’t cynicism — it’s part of using the tool correctly, because misplaced confidence in any data source is worse than acknowledged uncertainty.
The GMV Gap
Creative Center shows advertising metrics, not direct sales data. GMV figures that appear in the Top Products tab reflect estimated revenue from ad-attributed purchases, not total TikTok Shop sales for a product. A product that sells heavily through organic TikTok content or creator affiliate posts may not appear prominently in Creative Center at all — because it’s not generating significant ad spend. This means Creative Center has an inherent bias toward ad-driven products and systematically underrepresents organic commerce.
Third-Party Tools That Fill the Gap
The data Creative Center doesn’t provide can often be approximated by third-party analytics platforms:
- FastMoss and Kalodata: Both tools provide TikTok Shop GMV estimates, shop-level sales data, and creator performance metrics that Creative Center doesn’t surface. They’re paid tools but offer significantly more depth on the commercial side of TikTok Shop.
- TikTok Seller Center: The native search analytics within Seller Center show what buyers actually search for when in the TikTok Shop tab — pure purchase-intent data that’s separate from the ad-behavioral data in Creative Center.
- Comment Sentiment Analysis: Neither Creative Center nor any third-party tool automates this effectively — but manually reading comments on top-performing product ads provides qualitative signals that quantitative data misses. Specifically, comments asking “where can I buy this?” or “what’s the link?” on organic creator content are among the strongest purchase-intent signals on the platform.
The Lagging Indicator Problem
Creative Center data, even with its real-time labeling, reflects what has already happened — ads that have already run, trends that are already measurable, products that are already being advertised. It is, by definition, a lagging indicator of behavior that occurred before you saw it. The gap between when a trend emerges and when it becomes legible in Creative Center data is typically 7–14 days.
For sellers making fast-moving product and content decisions, this lag matters. It means Creative Center should be used for structural insights (what formats work, what language converts, what categories have durable demand) rather than for day-zero trend identification. Real-time trend spotting is better done through organic TikTok browsing, creator monitoring, and community listening — and those signals are then validated and contextualized through Creative Center’s analytical framework.
Treating Creative Center as a System, Not a Tool
The sellers who consistently extract the most value from TikTok Creative Center aren’t the ones who use it most frequently. They’re the ones who use it most systematically — with a defined workflow, clear questions they’re trying to answer, and a way of connecting Creative Center’s outputs to their operational decisions about products, inventory, content, and ad spend.
That distinction — between browsing a tool and operating a system — is the difference between Creative Center as a distraction and Creative Center as a genuine competitive advantage. The platform has made extraordinary intelligence freely available: real ad performance data at scale, real consumer language preferences, real trend trajectories, real product conversion rates. The barrier to using it well isn’t access. It’s discipline.
Key Takeaways for Immediate Implementation
- Run your Top Products analysis sorted by 7-day popularity change, not absolute view count. Growth trajectory is the signal; raw volume is usually just noise by the time you see it.
- Use Keyword Insights sorted by CTR to build your ad copy vocabulary. The phrases that convert in paid TikTok ads are the phrases your audience responds to emotionally. Use them in hooks, on-screen text, and product descriptions.
- Apply the 30-day ad run rule as your primary saturation filter. Long-running ads signal proven ROI. Low creator count + rising growth trajectory signals early-stage opportunity.
- Read Top Ads frame-by-frame, not just as videos to watch. The engagement graph is the actual intelligence. Everything else is surface.
- Cross-reference Creative Center with Amazon review counts for validation. Under 200 reviews on top listings = approachable market. Over 1,000 = established category requiring strong differentiation.
- Build your 10-hook weekly brief from Keyword Insights CTR data. Let the data tell you what language to test, then let your audience tell you which specific execution works.
- Use Symphony Assistant for briefing, not finished content. Treat it as a research acceleration tool — faster hypothesis generation, not final copy production.
Creative Center rewards regular, structured use. Open it with specific questions. Leave with specific answers. Run the same analysis next Monday and compare. Over months, you’ll accumulate a knowledge asset that no competitor who browses it casually can match — and that asset will show up directly in your content performance, your product success rate, and your advertising efficiency.
The platform is free. The competitive advantage is built in how you use it.