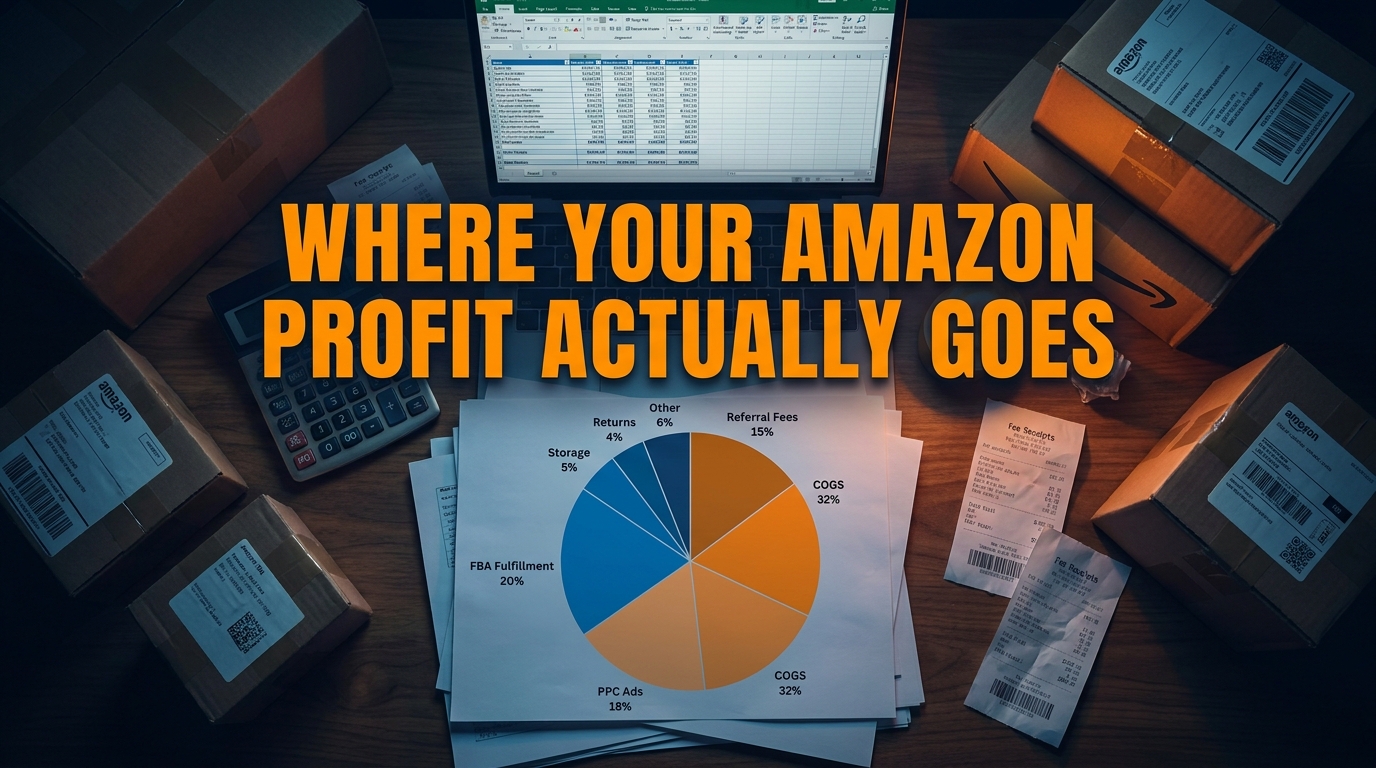

Here’s a pattern that plays out constantly in Amazon seller forums, Facebook groups, and seller communities: someone posts a screenshot of their Seller Central dashboard showing $180,000 in annual revenue. The comments flood in with congratulations. A week later, a follow-up post — quiet, a little embarrassed — reveals they netted $11,000 after fees, ads, and inventory costs.
This is not an edge case. It is close to the median experience for third-party Amazon sellers who haven’t systematically mapped their cost structure. According to Jungle Scout’s annual seller surveys, while 57% of Amazon sellers report profitability, only 19% report profit margins above 20% — and a significant portion of “profitable” sellers are not accounting for their own labor, returns processing overhead, or the capital cost of tied-up inventory.
The problem is almost never what sellers think it is. It’s rarely a listing quality issue, a keyword gap, or even a bad product. More often, it’s structural: a fee stack that compounds in ways sellers don’t model before launch, advertising costs that creep past breakeven, and inventory decisions that quietly strangle cash flow quarter after quarter.
This post does something different. Instead of giving you another list of “growth tactics,” it maps the actual places where Amazon sellers lose money in 2026 — using real fee structures, real cost categories, and real math. If you sell on Amazon or are planning to, this is the financial anatomy lesson most courses and gurus skip entirely.
The Full Fee Stack: What You Actually Pay Amazon on Every Single Sale
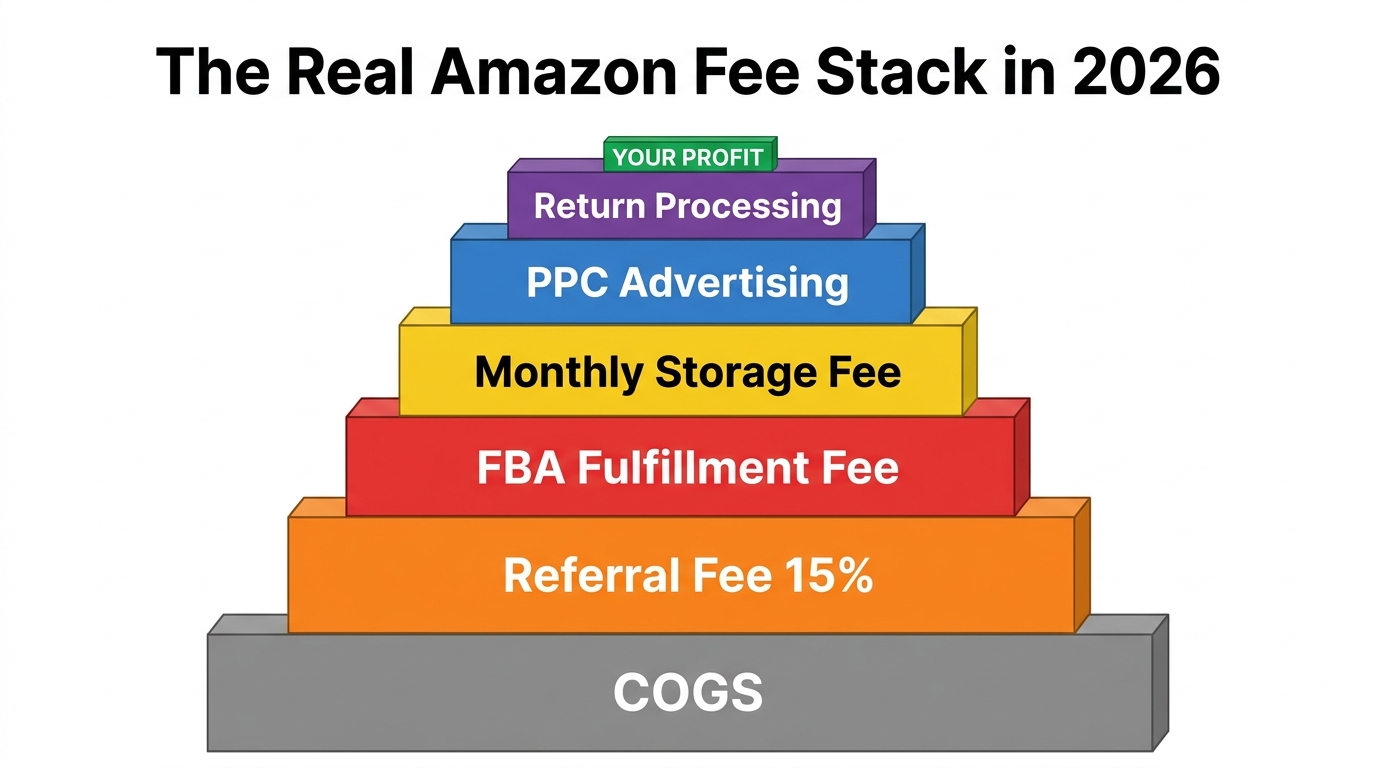
When new sellers ask “how much does Amazon take?”, they usually get a single number: 15%. That’s the referral fee for most categories. But referral fees are just the entry point. The actual fee stack for an FBA seller looks very different once you pull every line item out of the shadows.
The Mandatory Base Layer: Professional Selling Plan
Every seller on the Professional plan pays $39.99 per month regardless of whether they sell a single unit. For a seller moving 50 units a month at $30 each — $1,500 in revenue — that $39.99 already represents 2.7% of gross revenue before a single product has shipped. At scale it becomes negligible, but in the early months of a launch, it’s a real drag on the P&L that gets forgotten in pro forma spreadsheets.
Individual sellers pay $0.99 per unit sold instead of the monthly fee, which works out cheaper only below 40 units sold per month. Most serious sellers move past that threshold quickly, but it’s worth calculating the crossover point before committing to the Professional plan.
Referral Fees: The Percentage That Varies More Than You Think
Referral fees range from 5% to 45% depending on category. The 15% figure that gets quoted most often applies to categories like Home & Kitchen, Everything Else, and Clothing & Accessories. But here are some categories that catch sellers off guard:
- Amazon Device Accessories: 45% — the highest referral fee on the platform
- Jewelry: 20% up to $250 sale price, then steps down
- Entertainment Collectibles: 20% up to $100
- Baby Products: 8% under $10, 15% over $10 — a pricing cliff that directly affects your strategy
- Beauty & Health: 8% under $10, 15% over — same cliff
- Consumer Electronics: 8% — one of the lowest, but margins are already thin in this category
The category-based pricing cliff is a specific and underappreciated trap. If you sell a baby product at $9.99, Amazon charges 8%. Raise the price to $10.01 and the fee jumps to 15% on the entire sale price. That $0.02 price increase on a $10 product costs you an additional $0.70 in referral fees — far more than the extra revenue from the price increase. Sellers in these categories have to build their pricing strategy around these cliffs explicitly.
FBA Fulfillment Fees: Size and Weight Are Everything
FBA fulfillment fees are charged per unit shipped and are determined by the product’s size tier — which Amazon calculates based on dimensions and weight after packaging. This is a critical detail: sellers frequently model their fees based on product weight alone, not packaged weight. A 6-ounce product in a 12-ounce package crosses a weight tier and jumps to a higher fulfillment fee.
The size tier buckets as of 2026 work broadly as follows for standard-size items: small standard, large standard, and then oversize tiers (small oversize through special oversize). Fees start around $3.06 for the smallest standard items and climb steeply into double digits for large or oversize products. A seller who launches what they think is a “small standard” product without measuring the packaged dimensions can find themselves paying large standard fees — a difference of $1.50–$3.00 per unit that obliterates margin on lower-priced products.
The practical rule: Always measure your product in its final, Amazon-ready packaging. Then run the packaged dimensions and weight through Amazon’s fee calculator before you finalize your price or order your first shipment.
Referral Fee Traps: The Categories Where the Math Breaks First
Beyond the category percentages, referral fees interact with pricing strategy in ways that can undermine an entire product line. Understanding these interactions is especially critical for sellers in competitive categories where price elasticity is tight — where a $2 price increase costs more in volume than it gains in margin.
The $10 and $15 Pricing Cliffs
As noted above, Baby Products and Beauty & Health both shift from 8% to 15% at $10. Similarly, Grocery & Gourmet shifts from 8% to 15% at $15. Sellers in these categories who price right at or just above these thresholds are paying nearly double the referral rate on items that may already carry thin margins.
The correct strategy is to model both sides of the cliff explicitly. Price the product at $9.99 and calculate margin. Then price it at $10.99 and recalculate, accounting for the jump to 15%. In many cases, a price of $9.99 will actually yield more net margin than a price of $10.99 because the referral fee increase outstrips the additional revenue. If you’re going to price above the cliff, you typically need to go meaningfully above it — $12.99 or $14.99 — for the higher revenue to compensate for the rate change.
Minimum Referral Fees
Amazon charges a minimum referral fee of $0.30 per item across most categories regardless of sale price. For very low-priced items — say, a $1.99 accessory — the minimum fee represents 15% of the sale price just on the minimum alone, before percentage-based fees even kick in. Selling very cheap items on Amazon is structurally punishing unless you’re driving high volume with extraordinary margins.
Closing Fees on Media Products
Sellers in Books, Music, Video, DVDs, Video Games, Software, and Video Game Consoles pay a per-item closing fee of $1.80 in addition to the referral fee. If you’re reselling used books at $4.00, a $1.80 closing fee plus a referral fee plus FBA costs means you’re likely selling at a loss unless the book itself cost you essentially nothing.
FBA vs. FBM: The Real Math Behind the Choice in 2026
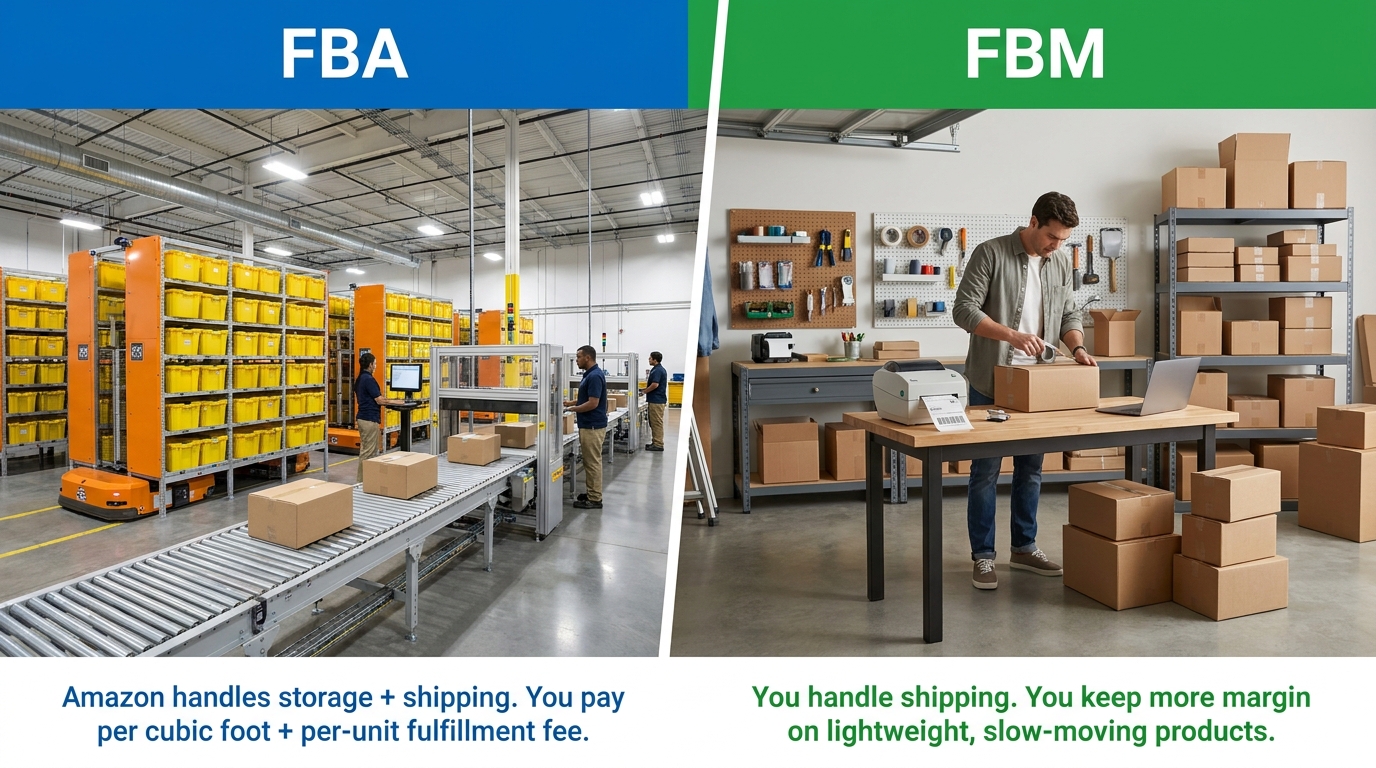
The FBA vs. FBM decision is one that most sellers make instinctively — FBA is “the Amazon way,” it comes with Prime eligibility, and it removes operational headaches. All of that is true. But FBA is not always the higher-margin option, and understanding when FBM wins on pure economics is a genuine skill that can add meaningful profit to your operation.
When FBA Wins
FBA makes strong economic sense when:
- Your products are small, light, and high-velocity. Amazon’s per-unit fulfillment cost for small standard items is competitive with — often cheaper than — what you’d pay a 3PL or handle in-house once you factor in labor, packaging materials, and shipping rates.
- Your products need Prime eligibility to convert. Data consistently shows that Prime badge products convert at higher rates than non-Prime FBM listings in the same category. For high-competition categories where Prime is table stakes, FBM is often a non-starter.
- You don’t have the warehouse infrastructure to fulfill orders same-day or next-day. Customer expectations have shifted dramatically. A two-day delivery promise from FBA is hard to replicate independently without significant infrastructure investment.
When FBM Wins
FBM becomes genuinely superior in several specific scenarios:
- Large, heavy, or oversize products. FBA fees for oversize items can be $10–$30+ per unit. If your shipping cost to the customer is $8 via a negotiated carrier rate, FBM can save you $5–$20 per sale.
- Slow-moving inventory with unpredictable demand. Long-term storage fees compound painfully on items that sit in FBA warehouses for more than 181 days. FBM keeps that inventory in your own space — or a cheap 3PL — at a fraction of the storage cost.
- Seller-Fulfilled Prime (SFP) qualified sellers. If you can meet Amazon’s stringent SFP requirements — which include same-day shipping on most orders, very high on-time delivery rates, and use of Amazon Buy Shipping — you get Prime eligibility without paying FBA fulfillment fees. SFP is genuinely difficult to maintain, but sellers who crack it can see significant margin improvements on high-ticket items.
- Products with high return rates. FBA’s return process is streamlined for customers but costly for sellers. Returns go back to Amazon warehouses, where they’re inspected and either relisted, classified as unfulfillable, or sent to liquidation — sometimes at your expense. With FBM, you control the returns process entirely and can inspect, repackage, and relist items yourself, recovering more value per returned unit.
The Hybrid Approach
Sophisticated sellers don’t make a binary FBA/FBM choice — they run hybrid fulfillment. High-velocity, small, high-margin SKUs go FBA. Slow movers, heavy items, and products with seasonal demand patterns go FBM or to a 3PL. This requires more operational complexity but allows you to optimize the fulfillment method for each SKU’s specific economics rather than applying a one-size-fits-all strategy that over-pays in some categories and under-serves customers in others.
Storage Fee Time Bombs: How Aged Inventory Quietly Destroys Margins
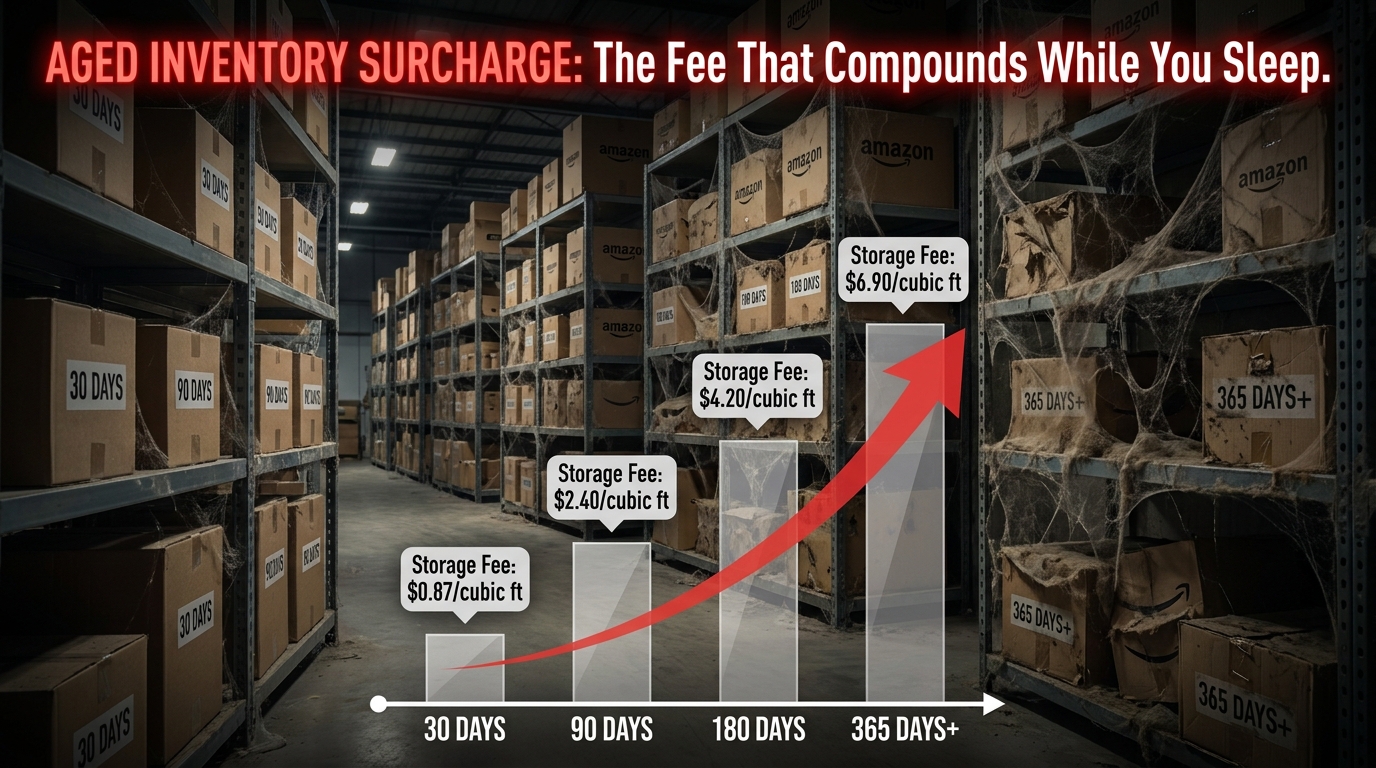
Monthly FBA storage fees are relatively modest when inventory turns quickly. The per-cubic-foot rates for standard-size items run roughly $0.78–$0.87 during January through September, and spike significantly higher October through December during the holiday peak season. For a small product in a 0.25 cubic foot package, that’s a matter of cents per month.
The real danger isn’t monthly storage fees at normal turn rates. It’s what happens when inventory ages past the 181-day and 365-day thresholds.
The Aged Inventory Surcharge
Amazon charges what it calls an “aged inventory surcharge” on units that have been in FBA warehouses longer than 181 days. This surcharge escalates sharply the longer inventory sits. Units between 181–270 days incur a surcharge on top of regular monthly storage. Units between 271–365 days face a higher surcharge. And units beyond 365 days face the most severe charges — which can reach several dollars per unit per month on items that may be selling for $15–$20 total.
The compounding nature of this is what makes it so damaging. Consider a seller who sends in 500 units of a product in Q1, sells 300 by mid-year, but the remaining 200 slow down as competition increases. By Q3, those 200 units have crossed 181 days. By Q4, they’ve crossed 271 days. Each threshold increase in storage cost reduces the seller’s incentive to run the price promotions that might clear the inventory — because the deeper the discount needed to move stale units, the less the seller nets after the surcharge.
The Removal and Disposal Fee Trap
When sellers finally decide to get aged inventory out of FBA warehouses, they face two choices: pay Amazon to return the inventory (removal fees per unit) or pay Amazon to dispose of it (disposal fees per unit). Neither is free. Removal fees vary by item size but can run $0.97–$2.35 per standard-size unit. For an item that cost you $4.00 to produce and is now worth $2.00 on the secondary market, removal followed by liquidation elsewhere may net you close to zero — or negative — after all-in costs.
The preventive framework: Model your sell-through rate before sending inventory. If you expect 60 days of sales velocity at current rates, don’t send 180 days of stock. Use Amazon’s Inventory Health reports to track IPI scores and stay ahead of the aged inventory thresholds. A proactive price cut at 90 days is almost always cheaper than an aged inventory surcharge at 181 days.
Holiday Peak Surcharges: The Fee Spike Most Sellers Don’t Budget For
Between October 15 and January 14, Amazon increases storage fees significantly for both standard-size and oversize items. The precise amounts vary by year, but the pattern is consistent: Q4 is the highest-cost storage period on the platform. Sellers who “load up” for Q4 by sending massive shipments in September face storage costs in the $2.40–$3.60 per cubic foot range for anything that doesn’t sell through in October and November. If your holiday demand forecast is wrong by 20%, the carrying cost on that excess inventory can wipe out your Q4 profit entirely.
Return Rates and the True Cost of “Free Returns” — Who Really Pays
Amazon’s customer-facing returns policy is a significant competitive advantage for the platform. Customers know they can return almost anything, which reduces purchase hesitation and drives conversion rates. The question sellers rarely ask loudly enough: who funds that confidence, and what does it actually cost?
The Return Processing Fee
Amazon charges return processing fees in product categories with high return rates, including Apparel, Shoes, Jewelry, Watches, and Luggage. In these categories, when a customer returns an item and Amazon determines it’s still sellable, Amazon may charge a return processing fee equivalent to the original FBA fulfillment fee. Effectively, you pay the fulfillment fee twice: once to ship it to the customer, and once for the return processing. For a clothing seller running a 15–20% return rate, this is a material cost line.
Sellable vs. Unsellable Returns
When a returned item arrives back at an Amazon fulfillment center, warehouse staff inspect it and classify it as either “sellable” — it can go back into your active FBA inventory — or “unsellable” — it’s damaged, opened, or otherwise cannot be sold as new. The unsellable classification triggers a further decision: Amazon will either dispose of the item (at your expense) or return it to you (also at your expense). In either case, you’ve paid for the return processing and lost the sellable unit.
In categories like electronics, beauty, and personal care, unsellable return rates tend to be higher because customers open, use, and then return products claiming defects. Some categories see 30–40% of returns classified as unsellable. For every 100 units you sell in these categories at a 15% return rate, 15 units come back — and if 35% of those are unsellable, you’ve permanently lost approximately 5 units of inventory while paying return and disposal fees on them.
The Customer Abuse Problem
Returns fraud and abuse — customers ordering, using, and returning products with fabricated defect claims — is a persistent and growing problem on the platform. Amazon’s seller protection mechanisms for this have improved somewhat, but the platform still errs heavily toward the customer in dispute resolution. Sellers in high-return categories need to build return costs explicitly into their unit economics — not as a best-case scenario line item, but as a realistic operating assumption based on category-level data.
PPC Spend Creep: When Advertising Costs More Than It Returns
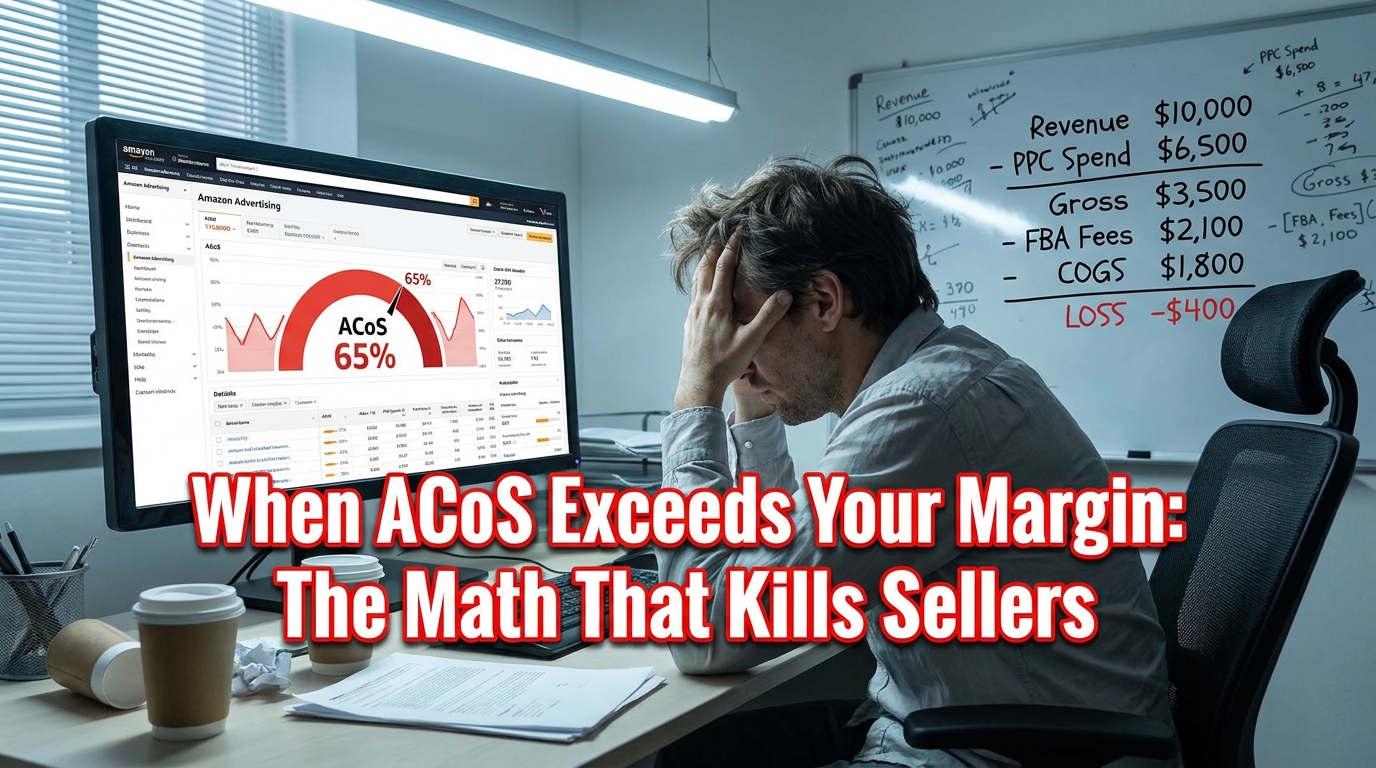
Amazon PPC advertising is simultaneously the platform’s most powerful growth lever and its most efficient profit drain when mismanaged. The core metric most sellers track is ACoS — Advertising Cost of Sale — which expresses ad spend as a percentage of ad-attributed revenue. The problem is that sellers often don’t connect their ACoS target to their actual profit margin with enough precision to know when they’ve crossed from profitable advertising into subsidized sales.
Calculating Your Break-Even ACoS
Break-even ACoS is simply your profit margin before advertising expressed as a percentage. If you sell a product for $35, and after referral fees, FBA fees, and COGS you have $10 remaining, your pre-advertising margin is 28.6%. Your break-even ACoS is therefore 28.6% — any ACoS above that means you’re spending more on ads than the profit that sale generates.
The calculation sounds straightforward, but sellers frequently miscalculate it because they:
- Use gross margin (after COGS only) rather than true pre-advertising margin (after COGS, all Amazon fees, and storage allocation)
- Forget that ACoS is calculated on ad-attributed revenue, not total revenue — the denominator is smaller than you think
- Don’t account for the TACoS (Total Advertising Cost of Sale) impact — what your total ad spend is as a percentage of all revenue, not just PPC-attributed revenue
The TACoS Metric: The Number That Actually Tells the Story
TACoS is arguably more important than ACoS for understanding your business health. If your ACoS is a healthy 20% but you’re spending $5,000 in ads per month on $15,000 in total revenue, your TACoS is 33.3%. If your pre-advertising margin is 30%, you are operating at approximately breakeven — all of your organic sales profit is being consumed by advertising to drive more sales. You’re running faster on a treadmill that isn’t moving forward.
Target TACoS should be well below your pre-advertising margin. The exact threshold varies by business model and growth phase — sellers in aggressive launch mode may tolerate a high TACoS deliberately as an investment in ranking — but any seller who is past the launch phase and still running TACoS above 25–30% on a product with a 30% pre-ad margin is likely destroying value, not creating it.
The Keyword Bid Spiral
Competitive categories drive a bidding dynamic that systematically pushes CPCs upward over time. As more sellers enter a category and existing sellers increase budgets, keyword auction clearing prices rise. Sellers who set “auto” bids and forget them can see their effective CPC increase 40–60% over a 12-month period without any change in their campaign structure — simply because the competitive landscape has shifted. Regular bid audits — at minimum monthly, ideally weekly for high-spend campaigns — are not optional. They are a core financial control.
Match Type Discipline
Broad match keywords are the single biggest source of wasted ad spend for most Amazon sellers. Broad match casts a wide net — and in competitive categories, that net captures irrelevant search terms that drain budget without converting. Sellers who run broad match campaigns without rigorous negative keyword harvesting are essentially writing Amazon a blank check to show their ads on loosely related searches. Transitioning high-performing broad match terms to exact or phrase match after sufficient data collection is a basic but frequently neglected optimization that can cut wasted spend by 20–40%.
COGS Miscalculation: Why Most Sellers Don’t Know Their True Unit Economics
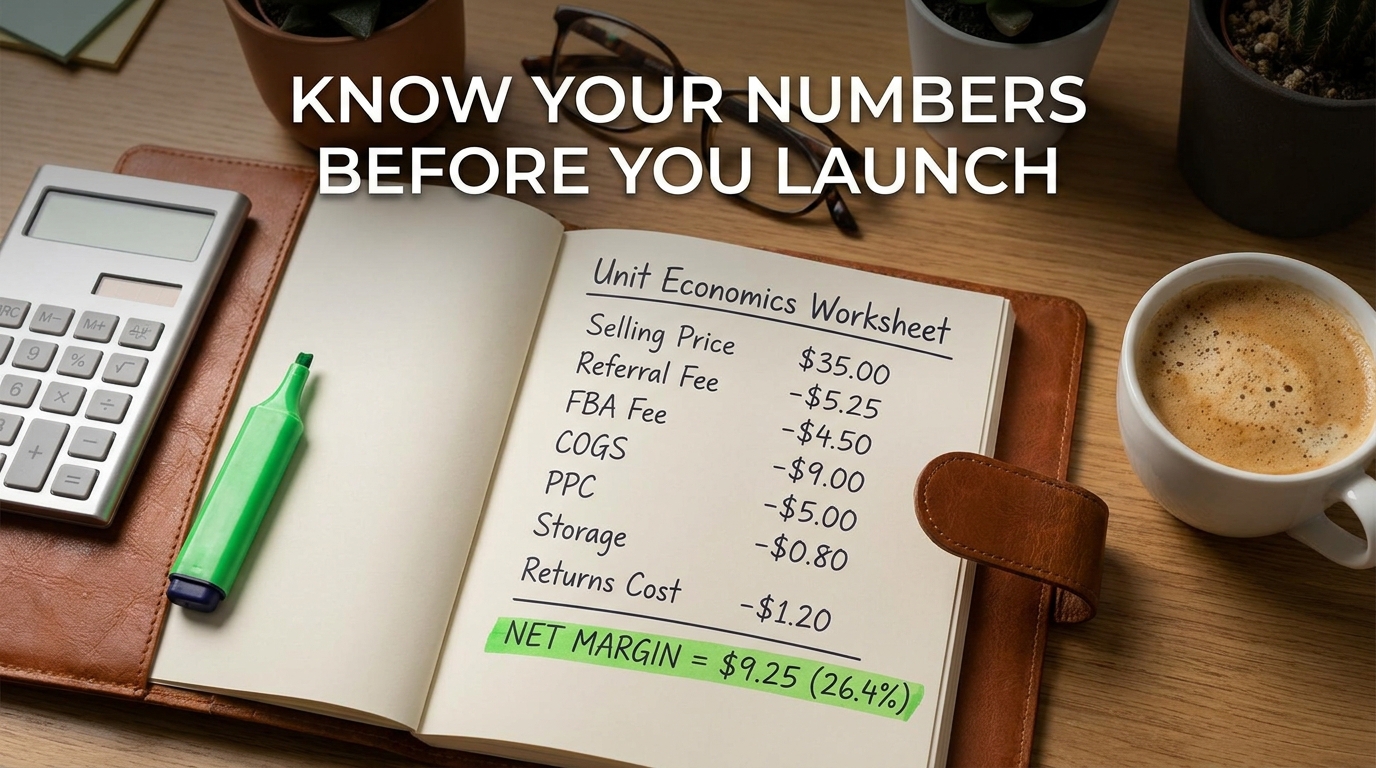
Cost of Goods Sold sounds like a simple number: what you paid for the product. In reality, for Amazon sellers, COGS is a composite that includes a range of costs that are easy to forget or mislabel. Sellers who understate COGS overstate margins and make product, pricing, and reorder decisions on false information.
The Full COGS Checklist
True COGS for an Amazon FBA product includes:
- Factory price per unit — the negotiated manufacturing cost
- Packaging and labeling costs — boxes, inserts, poly bags, FNSKU labels
- Inbound freight to Amazon — sea freight, air freight, or domestic trucking from your supplier or 3PL to Amazon’s fulfillment centers, divided by units per shipment
- Import duties and tariffs — for China-sourced products especially, these have fluctuated significantly and can represent 7–25% of the factory cost depending on the product classification and current trade policy
- Amazon inbound placement fees — a relatively recent addition to Amazon’s fee structure, charging sellers for the service of distributing their inventory across Amazon’s fulfillment network
- Inspection fees — third-party quality control inspection at the factory before shipment
- Prep costs — if you use a prep center or 3PL to receive, inspect, and prep goods before sending to Amazon, those costs belong in COGS per unit
The Tariff Variable in 2026
Import tariffs on goods from China have been a rolling variable for Amazon sellers for several years, and 2026 is no exception. Sellers who source from China and fail to model current tariff rates into their COGS are flying blind on their actual landed cost. For many product categories, tariffs add 20–35% to the factory price — meaning a product that costs $5 at the factory effectively costs $6.50–$6.75 landed in the US before any shipping, prep, or Amazon fees apply.
Sellers who are aware of this and have shifted sourcing to Vietnam, India, Mexico, or other lower-tariff countries may have a real structural cost advantage over competitors still sourcing from China. This sourcing arbitrage is a genuine competitive moat right now — but it requires advance capital investment and longer lead times to establish.
Fixed Cost Allocation
Beyond variable COGS, sellers need to allocate their fixed operating costs across their SKU catalog. Software subscriptions (keyword research tools, analytics platforms, listing optimization tools), photography and creative costs, account management fees if outsourcing to an agency, and even the professional seller plan fee all need to be attributed across sales volume to understand true unit-level profitability. A seller running $800/month in fixed overhead with 400 units sold needs to load at least $2.00 per unit in fixed cost absorption into their margin model. Ignore this and your reported margins are pure fiction.
The Cash Flow Gap: How Inventory Cycles Trap Working Capital
Profit and cash flow are not the same number, and the Amazon business model creates a specific cash flow structure that is worth understanding in detail — especially for sellers who are growing quickly. Rapid growth on Amazon frequently produces a cash crisis even when the P&L looks healthy.
The Timeline of a Dollar in Your Amazon Business
Follow a dollar from the moment you decide to reorder inventory:
- Day 1: You place a purchase order with your supplier and wire a 30% deposit. Cash leaves your account.
- Day 30–45: Manufacturing completes. You pay the remaining 70%. More cash out.
- Day 45–75: Sea freight transit. Your capital is on a container ship in the Pacific. Zero revenue flowing.
- Day 75–90: Customs clearance, domestic freight to Amazon fulfillment center, FBA check-in and receiving. Another 7–21 days of lag.
- Day 90+: Product goes live. First sales begin.
- Day 90+14: Amazon disburses payments on a 14-day cycle. Your first cash receipt arrives approximately 90–105 days after you made your initial deposit.
Now consider: you’re growing at 30% per quarter. Every time you reorder, you’re ordering 30% more units than the last time. Each order cycle requires 30% more working capital than the last. If you’re simultaneously paying for PPC, monthly fees, and any overhead, the working capital requirement compounds aggressively. Many sellers discover they are “profitable” but “broke” — their P&L shows healthy margins but their bank account is dry because all their cash is either in transit, in Amazon’s warehouse, or waiting in Amazon’s 14-day payment hold.
Inventory Reorder Timing Errors
A separate but related cash flow trap is reorder timing. Sellers who wait until they’re nearly out of stock before reordering face two simultaneous problems: a stockout that kills their organic ranking (and often takes weeks to recover), and an emergency air freight shipment to replenish quickly — which can cost 4–6x the sea freight rate. A single emergency air shipment on a large reorder can wipe out months of margin on that SKU.
The reorder point formula sounds simple — reorder when you have enough stock to last through your full replenishment lead time — but in practice, sellers routinely underestimate lead times (especially when factoring in Chinese New Year, port delays, and Amazon receiving backlogs) and end up in stockout or expensive air freight situations that a 30-day inventory buffer would have completely avoided.
Solutions to the Cash Flow Gap
Options for managing the Amazon cash flow gap include:
- Inventory financing: Several fintech lenders now offer inventory financing specifically for Amazon sellers, using your sales history as the underwriting basis. Interest rates vary widely — shop this carefully, as high-rate inventory loans can consume the margin benefit of staying in stock.
- Amazon Lending: Amazon offers its own lending products to qualified sellers within Seller Central. Terms are generally competitive, though access is not universal and is invite-based.
- Revenue-based financing: Platforms like Clearco provide advances against future revenue at a flat factor fee rather than traditional interest. Can work well for established sellers with consistent sales history.
- Negotiate supplier payment terms: Moving from 30/70 to 50/50 or even net-30 terms with your supplier (typically requires a track record and higher order volumes) significantly reduces your upfront cash outlay per cycle.
Profit Engineering: How Top Sellers Build Margin Before They Launch
The most profitable Amazon sellers share a discipline that separates them from the rest: they engineer their margin before they place their first purchase order, not after. They don’t discover their profitability — they design it in advance.
The Pre-Launch Margin Model
Before committing to any product or supplier, the clearest operators build what amounts to a complete pro forma income statement at the unit level:
- Target selling price: Based on competitive analysis of existing listings in the category, not wishful thinking.
- Less referral fee: At the appropriate category rate, accounting for any pricing cliff effects.
- Less FBA fulfillment fee: Using packaged dimensions and weight, not product dimensions and weight.
- Less estimated monthly storage per unit: Based on projected sell-through rate, allocated monthly.
- Less COGS (full landed cost): Including factory price, packaging, freight, duties, prep, and inspection.
- Less PPC allocation: A realistic target spend per unit based on category-level CPC data and expected conversion rates.
- Less return cost allocation: Based on category return rate benchmarks.
- Less fixed cost allocation: Software, photography, and account overhead divided by projected monthly units.
- = Net margin per unit and as a percentage of selling price
If this model doesn’t yield at least 20–25% net margin, most experienced sellers won’t launch the product. Not because 20% is magical, but because real-world conditions — a supplier price increase, a competitor dropping their price, an unexpected storage surcharge, a keyword CPC spike — will erode that margin. You need a buffer to absorb reality.
Negotiating Margin at the Source
For private label sellers, the supplier negotiation is the single highest-leverage activity in the entire business. A $1.00 reduction in factory price on a product you sell 1,000 units per month of is worth $12,000 per year in pure margin improvement — more than most PPC optimizations will ever yield. Yet many sellers accept the first quote they receive from Alibaba and spend the next six months trying to squeeze margin through ad optimization.
Effective supplier negotiation in 2026 involves getting competing quotes from at least three suppliers, using order volume commitments to negotiate better rates, paying attention to minimum order quantities (and negotiating them down on initial orders), requesting itemized cost breakdowns to understand where cost reduction is feasible, and building a long-term relationship with your best supplier so that as your volume grows, your price drops.
Diversification vs. Focus: When Expanding SKUs Kills Rather Than Grows Profit
The growth narrative in Amazon seller communities tends to revolve around catalog expansion: more SKUs, more categories, more variation listings, more market coverage. There’s logic to this — spreading revenue across multiple products reduces single-product risk. But catalog expansion has its own cost structure, and sellers who expand too fast or too widely frequently discover that their apparent revenue growth is masking a collapse in per-SKU profitability.
The Management Overhead of Every New SKU
Every new SKU you add to your catalog requires: a launch PPC budget (often $500–$2,000+ to build initial ranking history), ongoing keyword monitoring and optimization, inventory forecasting, storage management, listing maintenance, review generation strategy, and periodic repricing analysis. The more SKUs you add, the more thinly all of this attention is spread. Sellers managing 50 SKUs with a team of two are almost certainly not managing most of those SKUs well — they’re letting the majority of their catalog run on autopilot while focusing on the top performers.
The 80/20 Concentration Problem
In most Amazon catalogs with more than 10 SKUs, a version of the Pareto principle applies: roughly 20% of the SKUs generate 80% of the revenue and an even higher percentage of the profit. The remaining 80% of the catalog generates modest revenue, creates disproportionate operational complexity, and often drags the overall account’s average inventory performance metrics down.
Periodic SKU profitability audits — at minimum semi-annually — should result in active culling of underperformers. Products that don’t meet your minimum margin threshold, that have chronic stockout problems, or that require disproportionate management attention relative to their profit contribution should be removed or handed off. This is uncomfortable because sellers equate catalog size with business maturity. In practice, a focused catalog of 10 highly profitable, well-managed ASINs will almost always out-earn a bloated catalog of 50 mediocre ones.
The Variation Listing Trap
Variation listings — parents with multiple child ASINs for different sizes, colors, or configurations — can be powerful consolidators of review history and conversion rate. But they also create inventory management complexity that catches sellers off guard. You now need to forecast demand for each individual variant, manage separate inventory levels per ASIN, and handle the situation where one popular variant runs out of stock while others accumulate aged inventory. Building a variation family is often the right move for established products, but launching with 15 color variations on an unproven product is a recipe for a storage fee crisis six months later.
The Margin-First Mindset: What Actually Separates Sustainable Amazon Businesses
Across every area covered in this post — fee structures, fulfillment choices, inventory management, advertising, COGS, cash flow, and catalog strategy — a single organizing principle separates the sellers who build durable, profitable businesses from those who ride the revenue roller coaster without ever finding stable ground.
That principle is the margin-first mindset: the discipline of asking “what is the margin impact?” before making any significant operational or strategic decision, rather than asking “what is the revenue impact?” first.
Revenue Is Vanity, Margin Is Sanity
The Amazon platform makes it genuinely easy to generate revenue. Drop your price 15%, run an aggressive PPC campaign, participate in a Lightning Deal — you’ll move units. The platform’s mechanics reward velocity, and it’s entirely possible to scale your revenue rapidly while your margin simultaneously deteriorates to the point of loss. Sellers who optimize for BSR rank and revenue figures without equal attention to the margin consequences of those tactics routinely find themselves with impressive-looking businesses that generate no cash.
The countervailing instinct — margin-first — means being willing to let a competitor win the Buy Box at a price that doesn’t make sense for your unit economics, being willing to slow down inventory orders rather than over-stock and incur storage fees, being willing to pause PPC campaigns that are running above break-even ACoS rather than continuing to buy revenue at a loss, and being willing to exit product categories that can’t support sustainable margins regardless of how competitive or popular they are.
Building Your Financial Monitoring Stack
Sustainable Amazon businesses run monthly P&Ls that capture every cost category outlined in this post — not just revenue and COGS. The tools for this have matured significantly. Platforms like Sellerboard, Helium 10’s Profits tool, and Jungle Scout’s financial dashboard can now pull live data from Seller Central and construct reasonably accurate P&Ls at the SKU level. None of them are perfectly precise — Amazon’s fee reporting has its own lags and quirks — but any of them are infinitely better than managing a seven-figure Amazon business off the Seller Central revenue dashboard and a gut feeling.
Weekly check-ins on your five most important financial metrics — TACoS by SKU, net margin by SKU, aged inventory volume, cash conversion cycle, and working capital runway — are the minimum viable financial management practice for any serious seller. Monthly deep dives into the full P&L, with comparison to the prior month and the prior year equivalent period, complete the picture.
The Takeaways That Actually Matter
If you read nothing else in this post, carry these forward:
- Model every fee before you launch. Referral fees, FBA fees by packaged size, storage allocation, returns cost, and PPC per unit — build the full model first.
- Know your break-even ACoS. If you don’t know this number for every SKU, you don’t know whether your advertising is making or losing money.
- Audit your aged inventory monthly. The aged inventory surcharge is silent and accumulating. A proactive price cut at 90 days is almost always cheaper than paying the 181-day surcharge.
- Separate profit from cash flow. A healthy P&L and an empty bank account can coexist on Amazon. Model your cash conversion cycle and build working capital buffers accordingly.
- Your supplier negotiation is worth more than your PPC optimization. A $1 reduction in unit cost at 1,000 units/month compounds permanently. A CPC reduction saves money only when the ads run.
- Cull your catalog. More SKUs are not better if they dilute attention from your winners. Audit, prune, and focus.
Amazon remains one of the most accessible and powerful platforms for building a product-based business from scratch. The fee structures, algorithms, and competitive dynamics are genuinely complex — but they are learnable, modelable, and manageable. The sellers who figure out where the money actually goes are the ones who still have a business worth having three years from now.