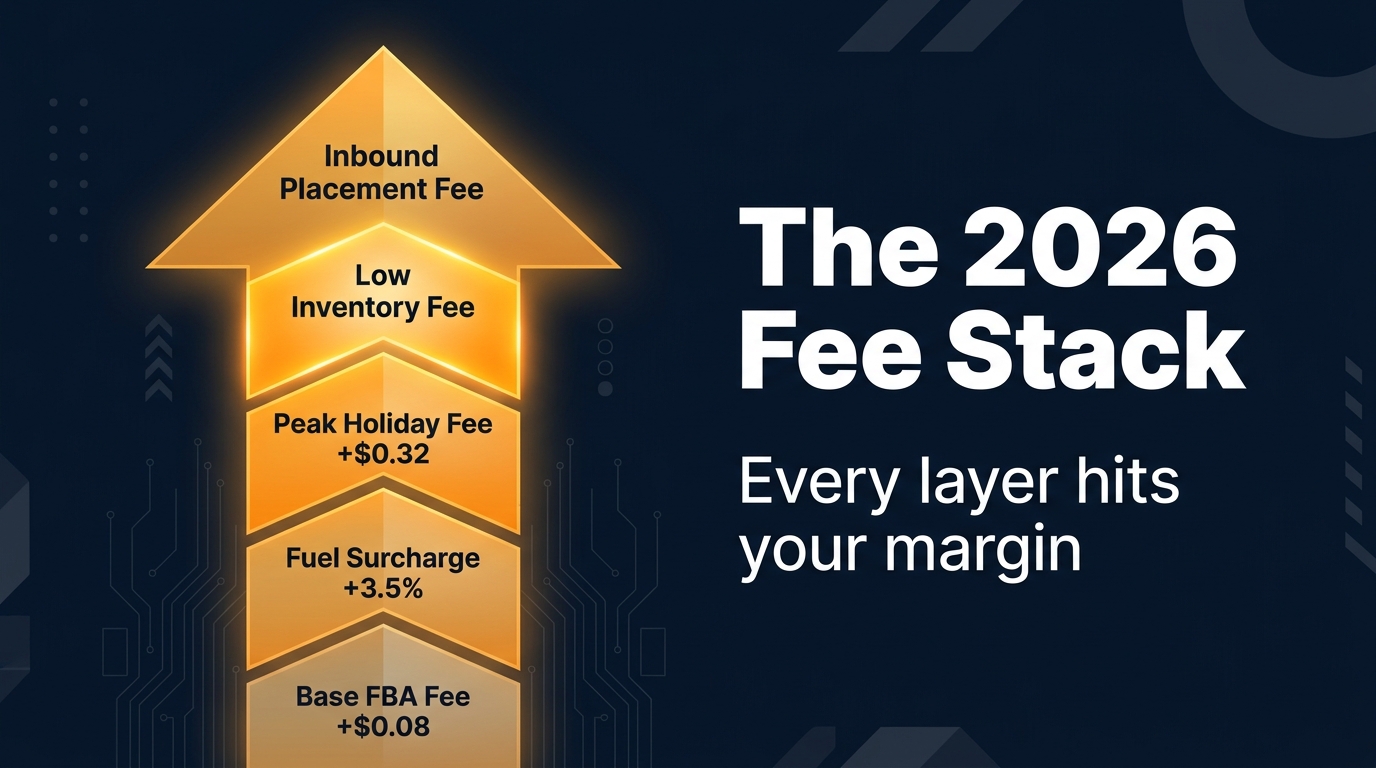

Most Amazon sellers treating the 2026 fee changes as a single “price adjustment” event are going to get hurt — not because the individual numbers are dramatic, but because those numbers compound in ways the average Seller Central dashboard doesn’t surface clearly.
The headline figure Amazon has publicized — an average $0.08 per-unit FBA increase — is technically accurate but practically misleading. It averages across product types, price bands, and size tiers in ways that obscure where the real damage lands. For some SKUs, the true per-unit fee increase in August through Q4 2026 will be north of $0.90 once every active layer is accounted for. For others, there’s actually a pricing opportunity that most sellers haven’t modeled yet.
This post isn’t about panicking over fee increases. It’s about understanding exactly which fee changes apply to which SKUs in your catalog, how they interact, and where your current pricing is now undercharging for your actual cost structure. There are ASINs in most catalogs that should be repriced upward immediately. There are others where a price move would backfire. And there are inventory decisions that need to be made before October 15 — or you’ll pay a compounding penalty you can’t undo mid-Q4.
Let’s go layer by layer.
Why 2026 Is a Rolling Cost Stack, Not a One-Time Event
The framing of “August 2026 fee changes” suggests a clean moment in time where Amazon flipped a switch and costs moved. The reality is more complex and, for sellers who aren’t watching closely, more expensive than it appears.
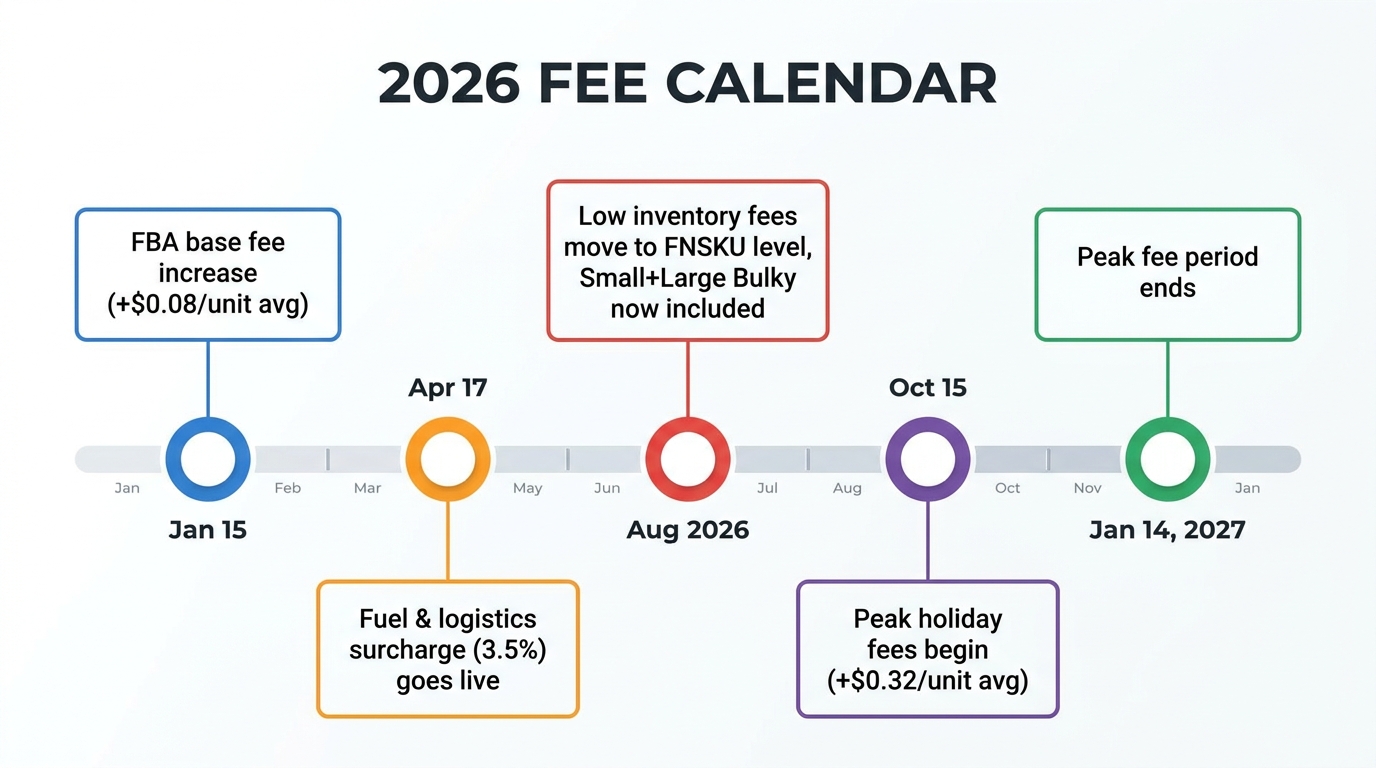
Amazon’s 2026 fee changes have unfolded across multiple dates, each of which introduced a distinct cost layer:
- January 15, 2026: Base FBA fulfillment fee increase took effect. Average increase of $0.08 per unit across U.S. standard-size products, with variance by price band and size tier.
- April 17, 2026: A 3.5% fuel and logistics-related surcharge was added on top of U.S. and Canada FBA fulfillment fees. This is a percentage surcharge applied to the fulfillment fee amount — not a flat dollar figure — meaning higher-fee items absorb more of it in absolute terms.
- Mid-2026 (in effect by August): Low-inventory-level fees shifted from parent-ASIN calculation to FNSKU-level calculation, and expanded to cover Small Bulky and Large Bulky products. Inbound Placement Service Fees also expanded to include Small Bulky and Large Bulky tiers.
- October 15, 2026: Peak holiday fulfillment fees begin, adding an average of $0.32 per unit through January 14, 2027.
The Compounding Problem Nobody Is Modeling
The critical thing to understand is that these aren’t alternative fees — they’re additive. A seller shipping a large standard-size item priced above $50 during Q4 is simultaneously paying the higher January base rate, the 3.5% fuel surcharge calculated on that higher base rate, and the peak holiday surcharge on top. If that same item has a variant that’s been running low on stock, there may also be a low-inventory-level fee applying at the FNSKU level.
For many catalog types, this stacking effect hasn’t been fully modeled into current pricing floors. Sellers who set their minimum prices in January based on the base fee increase haven’t accounted for the April surcharge. Sellers who updated floors in April haven’t necessarily accounted for the expanded low-inventory fee scope. And almost no seller has yet built Q4 peak fees into their October floor prices — because those dates haven’t arrived yet.
That’s the repricing window. Right now, in August, sellers have time to model the full stack and adjust pricing before the peak-season fee layer kicks in. The sellers who do this now will enter Q4 with protected margins. The ones who don’t will discover the problem in their November P&L reports.
The FNSKU-Level Low Inventory Fee: Variant Catalogs Are Most Exposed
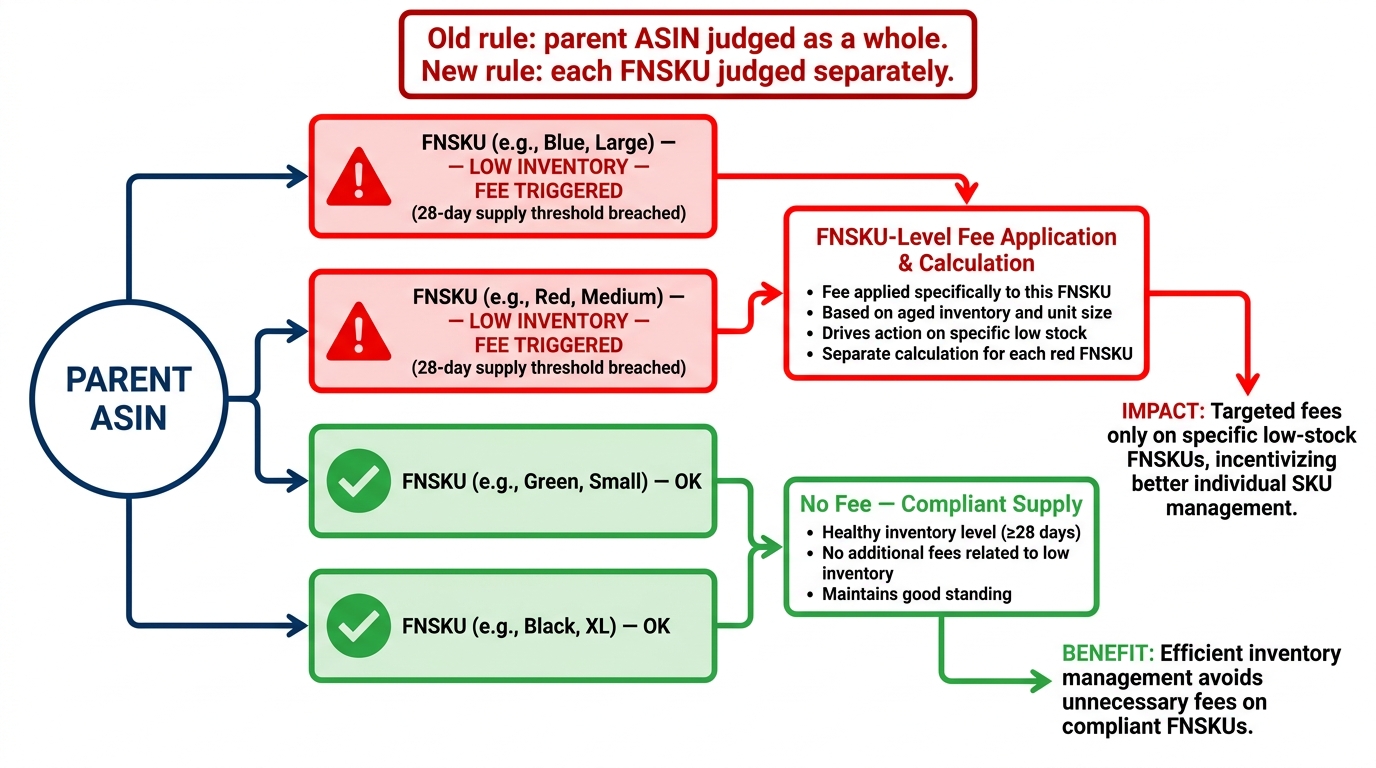
Of all the structural changes in Amazon’s 2026 fee revisions, the shift of the low-inventory-level fee from parent-ASIN level to seller-FNSKU level is the one most likely to catch experienced sellers off guard — precisely because it disrupts an assumption that has been true for years.
Previously, Amazon assessed low-inventory fees based on the health of a parent ASIN’s aggregate inventory position. A seller with a listing that had six color variants could have two or three weak FNSKUs buffered by stronger stock on the others. The parent-level calculation smoothed out the variation, and sellers naturally managed replenishment at the listing level rather than the individual variant level.
That’s no longer how the math works.
How the New FNSKU-Level Rule Actually Triggers
Under the revised structure, Amazon evaluates each seller-FNSKU independently. The fee triggers when both the 30-day and 90-day historical days of supply fall below 28 days for that specific FNSKU. Both thresholds must be breached simultaneously — the 90-day figure alone isn’t sufficient to trigger the fee, and neither is the 30-day figure alone.
This dual-threshold structure means a variant that has been intermittently low can still trigger the fee even after a partial restock, because the 90-day historical average takes time to recover. You can’t fix a low-inventory fee by sending in a small replenishment shipment today if the historical supply record is weak over the past three months.
Which Seller Types Are Most Exposed
The sellers most at risk are those with:
- Apparel and footwear with size/color depth: A listing with 12 size-color combinations (e.g., a t-shirt available in 4 colors × 3 sizes) now has 12 separate FNSKU positions to monitor. Any of the 12 can independently trigger a low-inventory fee.
- Supplement or grocery-exempt awareness gap: Grocery is explicitly exempt from the low-inventory fee. Sellers straddling grocery-adjacent categories should confirm which FNSKUs qualify for exemption and which don’t.
- Seasonal sellers clearing inventory between peaks: An FNSKU that was deliberately wound down after a seasonal run will have a degraded historical days-of-supply record that could penalize the next replenishment cycle if you’re not planning for the delay in recovery.
- Sellers with long lead times from overseas manufacturers: If your typical restocking cycle is 60–90 days from order to FBA receipt, a demand spike can drop a FNSKU below the 28-day threshold faster than you can respond — and the fee clock starts immediately.
What to Do Right Now
Pull your inventory health report filtered by FNSKU, not parent ASIN. Sort by days of supply. Any FNSKU showing below 35 days of supply should be treated as a replenishment priority — not 28 days, because the shipping and check-in time means a restock ordered today won’t register in Amazon’s historical supply calculation for another two to three weeks. The 35-day threshold gives you a buffer. The 28-day threshold is where you’re already paying the fee.
For pricing, a FNSKU incurring a low-inventory fee that you can’t immediately replenish should have its price floor adjusted upward to absorb the fee. Selling at your previous floor price on an understocked FNSKU now means selling below your true cost structure.
Inbound Placement Service Fees: The Bulky Product Trap
Amazon’s Inbound Placement Service Fee (IPSF) has been in place since 2024, but its scope expanded materially in 2026. Two changes matter most for sellers who haven’t revisited their inbound strategies this year.
The Small Bulky and Large Bulky Expansion
The old Large Bulky product tier has been split into two separate classifications: Small Bulky and Large Bulky. Both now carry their own IPSF fee schedules and, critically, both are now subject to low-inventory-level fees that previously applied only to standard-size products.
For Large Bulky sellers using minimal shipment splits, the fee increase averages $0.27 per unit. For standard-size sellers using minimal shipment splits, the average increase is around $0.05 per unit. The Small Bulky tier has its own fee bands calculated by weight, with fees ranging from $1.10 upward depending on the shipment configuration.
The important qualifier — and the one that shifts the decision calculus — is that Amazon-optimized shipment splits remain fee-free. If Amazon’s system determines the optimal distribution of your inventory across fulfillment centers and you let Amazon route it, you pay no IPSF. The fee only applies when you elect a minimal-split configuration that limits where your inventory goes.
Minimal Split vs. Amazon-Optimized: The Real Trade-Off
Many sellers have historically preferred minimal-split inbound shipping because it simplifies prep work — you send everything to one or two FC locations rather than splitting shipments across four or five. For standard-size, lower-weight items, this was often worth the fee to save on prep complexity and labor.
That calculation changes when you’re shipping bulky products. A $0.27 per-unit IPSF increase on Large Bulky items multiplied across hundreds or thousands of units shifts the math considerably. A seller sending 1,000 units of a Large Bulky item via minimal split now pays approximately $270 more in inbound fees than a seller who uses Amazon-optimized routing.
The counter-argument to Amazon-optimized splits is the operational complexity of splitting shipments. That complexity is real — but it’s worth quantifying. If you’re using a 3PL for prep, the extra routing complexity may add $50–$100 in labor. If you’re doing it in-house, model the actual labor time. In most cases for Large Bulky items, the $0.27/unit IPSF savings outweigh the routing complexity cost at volume above a few hundred units.
Repricing Implication
If you’re currently using minimal splits for Large Bulky items and you’ve built your price floors around pre-2026 IPSF rates, those floors are now understated by approximately $0.27 per unit. That isn’t catastrophic on a $50+ item — it’s about half a percentage point of cost. But on a large bulky item priced at $18–$22 (common in home goods, garden, and sporting goods), that’s 1.2–1.5% of your selling price that’s now missing from your cost model.
The Price Band Tiers: Which of Your SKUs Are in the Wrong Bracket
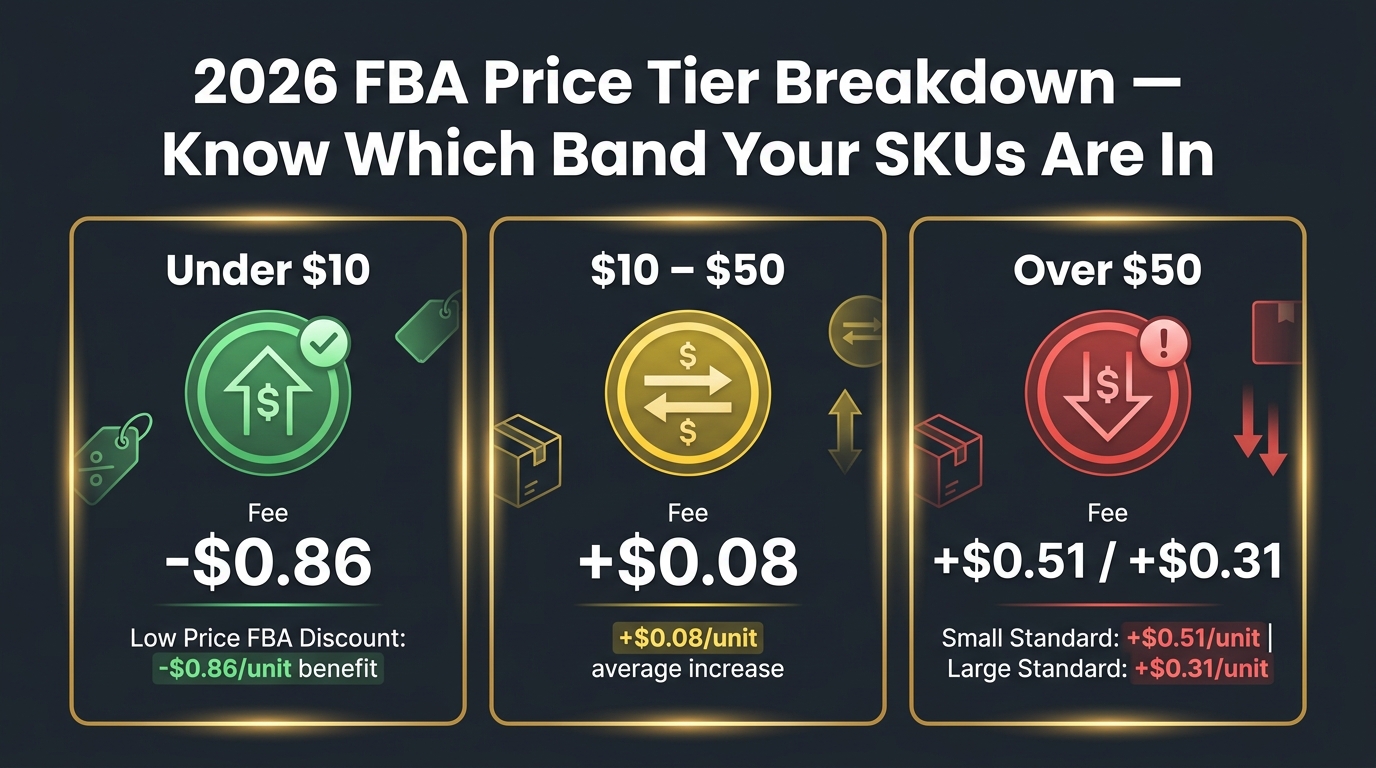
Amazon’s 2026 fee structure uses three price bands for standard-size fulfillment fees. Understanding which band applies to each of your SKUs isn’t just accounting — it actively shapes whether a price increase or decrease is margin-positive for a given product.
Under $10: The Low Price FBA Advantage
Products priced below $10 qualify for the Low Price FBA rate, which carries a discount of approximately $0.86 per unit compared to the standard rate that applies to products priced above $10. This isn’t a minor rounding difference — it’s a meaningful per-unit cost advantage that makes sub-$10 pricing genuinely economically attractive for the right products.
The counterintuitive implication: if you have a product currently priced at $10.49 or $11.00 because you wanted to escape the psychological “cheap” perception of single-digit pricing, the fee differential means you’re paying $0.86 more per unit to be in the $10–$50 band than you would be if you dropped pricing to $9.99. On low-COGS items with thin margins, that $0.86 could be the difference between profitability and breakeven.
This doesn’t mean all sub-$10 products should stay there, or that raising a product above $10 is always wrong. The point is that the pricing decision shouldn’t be made on conversion rates alone — the $10 threshold is now a meaningful cost discontinuity that needs to be factored into the model.
$10–$50: The Middle Band Reality
Products in the $10–$50 range face the “average” $0.08 per-unit increase that Amazon has widely publicized. For most catalog categories, this is where the majority of SKUs live, and the impact here is straightforward — costs went up, and if you haven’t updated your minimum price floors since January, you’re eight cents short per unit across every FBA sale you’ve made this year.
That sounds small. Multiply it by your annual FBA unit volume. For a seller moving 50,000 units per year, $0.08 per unit is $4,000 in margin erosion that wasn’t in anyone’s plan.
The more consequential issue in the $10–$50 band is the April fuel surcharge, which adds 3.5% to the fulfillment fee — not to the sale price. A product with a fulfillment fee of $3.50 now effectively carries a $3.62 fulfillment fee (3.5% × $3.50 = $0.12 surcharge). That $0.12 compounds on top of the $0.08 January increase, bringing the real per-unit cost increase for many products in this band to approximately $0.20 rather than the headline $0.08.
Over $50: The Highest Absolute Exposure
Products priced above $50 bear the steepest fee increases in absolute dollar terms. For small standard-size items above $50, the January fee increase averages $0.51 per unit — more than six times the catalog average. For large standard-size items above $50, the average increase is $0.31 per unit.
This is the price band where the fuel surcharge also has the highest absolute dollar impact, because fulfillment fees for larger, heavier, higher-priced items are themselves larger. A 3.5% surcharge on a $6.00 fulfillment fee is $0.21. Stack that on a $0.31–$0.51 January increase and the total 2026 fee increase for a single unit in this band can exceed $0.50 before peak season fees are added.
Sellers with high-ticket, standard-size products ($50–$150 range) who haven’t repriced since 2025 should treat this as an urgent audit priority.
The 3.5% Fuel Surcharge: How the Math Actually Compounds
The April 17, 2026 fuel and logistics-related surcharge of 3.5% is one of the fee changes that’s easiest to underestimate, for a simple reason: it’s expressed as a percentage of the fulfillment fee, not of the sale price. This framing makes it feel smaller than it is.
Why Percentage-of-Fee Surcharges Are Deceptive
If Amazon said “we’re adding $0.12 to your per-unit FBA cost,” sellers would model it as a flat $0.12. When Amazon says “we’re adding 3.5% to your fulfillment fee,” many sellers mentally round it to “roughly $0.10 or so” and move on — without checking the actual fulfillment fee for each SKU tier.
The problem is that fulfillment fees vary significantly across size and weight combinations. For a small, lightweight standard item with a $3.22 fulfillment fee, the 3.5% surcharge adds $0.11. For a heavier large standard item with a $7.17 fulfillment fee, the surcharge adds $0.25. For extra-large items, the fees can be substantially higher, making the 3.5% surcharge a material dollar amount.
The Compounding Calculation
The fuel surcharge applies to the post-January-increase fulfillment fee, not the 2025 base rate. This means the calculation starts from an already-elevated number. If the January increase added $0.08 to a fulfillment fee, bringing it from $3.22 to $3.30, the 3.5% surcharge then applies to $3.30 — not $3.22. The compounding effect is small in absolute terms but directionally important when modeling SKU-level floors.
The practical implication: when updating price floors, calculate the surcharge against the current applicable fulfillment fee rate, not against a historical fee figure or a rounded estimate. Amazon’s fee preview tool in Seller Central will show you the current fulfillment fee for a specific ASIN at a specific price point — use that number, not an industry average.
Q4 Peak Surcharge: Plan Now or Pay More
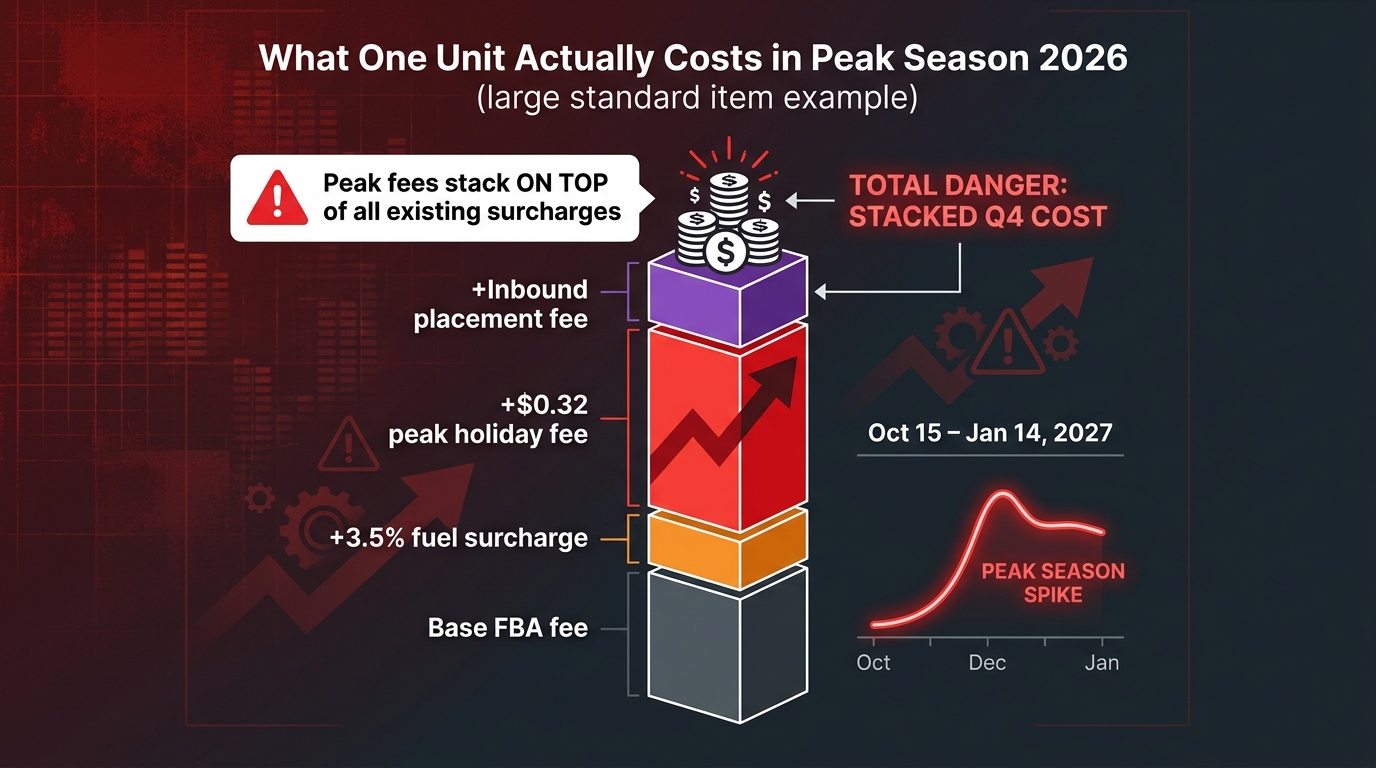
Beginning October 15, 2026 and running through January 14, 2027, Amazon’s peak fulfillment fees apply. The average increase is $0.32 per unit above non-peak rates — and this surcharge sits on top of, not instead of, the 3.5% fuel surcharge and all existing fulfillment fee amounts.
What the $0.32 Average Actually Means
Like the $0.08 January average, the $0.32 peak average obscures significant variance. Amazon’s own published examples show peak fee amounts such as $2.68 for a small standard item and $6.53 for a large standard item — meaning the uplift from non-peak to peak varies by size tier, not just in percentage terms but in structure.
Sellers in categories with strong Q4 demand — gifts, home goods, toys, electronics accessories — face a direct conflict between the fee pressure of Q4 and the competitive pricing dynamics of the season. Black Friday and Cyber Monday create enormous pressure to discount or match lower competitor prices, but those very discounts are happening at a moment when your per-unit cost structure is at its annual peak.
The Pre-Q4 Pricing Window
August and early September represent a critical window to set pricing that will survive Q4 economics. The specific action items are:
- Calculate peak-period price floors now: Add the $0.32 average peak surcharge (or the applicable per-tier amount) to your current cost model for every SKU you expect to sell in Q4. This is your new minimum floor price for October 15 onward.
- Identify SKUs where Q4 floor prices exceed your planned promotional prices: If your Black Friday promotional price is below your October 15 cost floor, you’re planning to sell at a loss. That’s not inherently wrong — some sellers use loss-leader pricing strategically on certain ASINs — but it should be a deliberate decision, not an accounting oversight.
- Evaluate whether Q4 volume justifies accepting tighter margins: Some categories have such significant Q4 velocity that thin margins multiplied by high volume still produce acceptable absolute profit. Others don’t. Model both the margin percentage and the absolute dollar contribution before deciding on pricing strategy.
Inventory Positioning Affects the Calculation Too
An often-overlooked interaction: if you’re holding excess inventory going into Q4, Amazon’s long-term storage fees (which run separately from fulfillment fees) add another layer. Sellers who over-stocked in preparation for Q4 and find their inventory sitting through November without selling face both the peak fulfillment fees when units do sell and potential storage cost pressure on units that don’t. The inventory quantity decision and the pricing decision are not independent in a fee environment like this one.
Category-Specific Landmines: Apparel, Returns, and High-Return Categories
While the FBA fulfillment fee changes apply broadly, certain product categories face compounding cost pressure from a second direction: returns processing fees. This is particularly acute for apparel and footwear, and it’s a dimension that pure-FBA-fee analysis tends to miss.
Apparel and Footwear: The Returns Trap
Amazon’s returns processing fee structure has a category-specific quirk that hits apparel and footwear sellers harder than almost any other segment. For most product categories, the returns processing fee only kicks in when a seller’s return rate exceeds a threshold. For apparel and footwear, the fee applies to every returned unit — there’s no threshold exemption. The first return and the hundredth return in a given period both incur the fee.
This matters enormously in a 2026 fee environment where base FBA fees are already elevated. A clothing item that already saw its January fee increase, is paying the fuel surcharge, and has a 15–20% return rate (typical for fashion categories on Amazon) is now absorbing multiple simultaneous cost pressures. The returns processing fee on every returned unit stacks on top of the fulfillment fee already paid when the item shipped outbound.
The Double-Dip Problem on Returns
The economics of a returned unit in high-fee, high-return categories are worth spelling out explicitly. When a customer buys and then returns a clothing item, the seller pays an outbound fulfillment fee, a returns processing fee, and may also lose some or all of the product’s resale value if it arrives back in unsellable condition. In peak season, that outbound fulfillment fee is higher than at any other time of year.
For sellers in high-return categories, the margin model needs to explicitly include an average returns cost per unit sold — not just per unit returned. If 18% of your units are returned and each return costs $1.20 in fees plus some percentage of COGS, then $0.216 of expected returns cost should be baked into your price floor for every unit sold, before the product ships.
What to Actually Do
Sellers in apparel, footwear, and other high-return categories should:
- Pull returns data by ASIN and calculate the actual average return cost per unit sold (not per unit returned) for your top ASINs.
- Rebuild price floors that include this expected returns cost as a line item.
- Evaluate whether high-return ASINs remain viable at market-competitive prices, or whether they need to be reduced in catalog prominence or phased to FBM.
The SKU-Level Repricing Framework That Actually Works
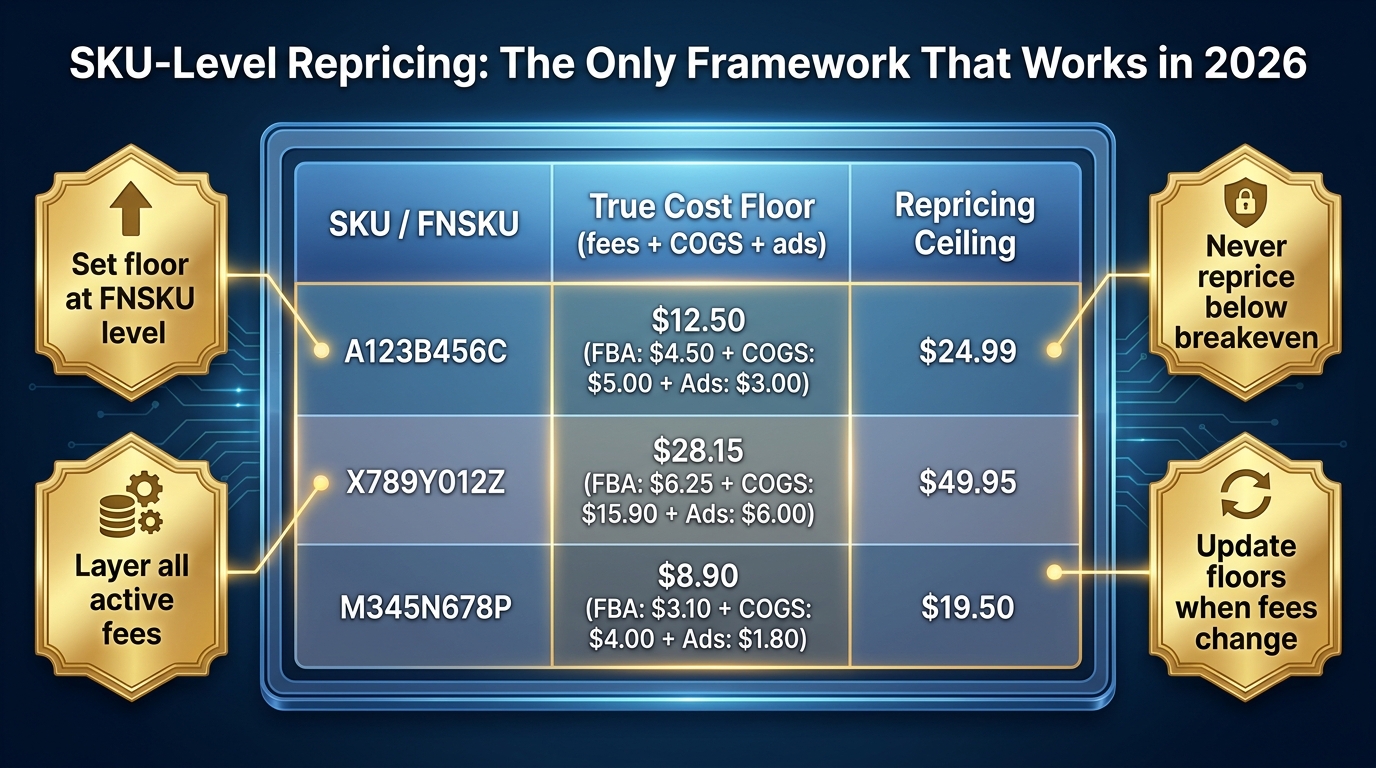
The single most important insight from the 2026 fee structure is that catalog-level repricing is no longer adequate. A blanket rule like “maintain 25% margin across all products” will protect some SKUs and silently destroy margins on others, because the fee inputs vary too much by price band, size tier, and fulfillment method.
Building a True Cost Floor Per FNSKU
A true cost floor for a given FNSKU in August 2026 needs to include the following line items:
- COGS (landed): Product cost plus all inbound freight, import duties, and prep costs, divided by units.
- FBA fulfillment fee: Pulled from the fee preview tool for the specific ASIN at the intended price point. Use the current fee, not the 2025 figure.
- 3.5% fuel surcharge: Applied to the fulfillment fee (not the sale price).
- Referral fee: Category-specific percentage applied to the sale price (plus delivery and giftwrap if applicable). U.S. referral fees are unchanged in 2026 for most categories.
- Inbound placement service fee: Applicable if using minimal splits. Calculate at the shipment level and amortize per unit.
- Low-inventory-level fee: Add this line if the FNSKU’s current historical days of supply puts it in fee territory. This is a temporary cost that should drop off once inventory is replenished, but it should be in the floor while active.
- Expected returns cost per unit sold: Category return rate × per-unit returns fee × (1 + COGS write-off rate for unsellable returns).
- Per-unit advertising cost: Total ad spend ÷ total units sold for that ASIN, based on the last 30–60 days.
- Target contribution margin: The minimum acceptable margin above all costs, expressed as a dollar amount or percentage, which defines the floor price.
Sum all of these and you have a true floor price below which no automated repricer should be allowed to set your price. This number is different for every FNSKU, and it changes when any input changes — including when Amazon updates a fee, when your COGS changes with a new supplier order, or when your ad spend efficiency shifts.
Setting the Ceiling
The ceiling price on a given FNSKU is equally important but often neglected. Without a ceiling, repricing tools can drift prices upward in low-competition moments to levels that suppress conversion, damage organic rank, and reduce the velocity data Amazon’s algorithm uses to evaluate listing quality.
A ceiling price should be set based on competitive market research for each ASIN — specifically, what the highest price is at which the product still wins the Buy Box or maintains acceptable conversion rates. This is a live variable that changes as competitors enter, exit, or change their own pricing. Check it quarterly at minimum, or use a competitive intelligence tool that flags significant price-band shifts in your category.
Automation Rules That Protect Margins
If you’re using an automated repricing tool (ChannelAdvisor, Feedvisor, Profit Peak, or any comparable solution), the tool’s effectiveness is only as good as the floor inputs it receives. An automated repricer with an outdated cost floor can legally reprice you below profitability because it’s following your instructions from six months ago.
The maintenance discipline is the actual work: updating floor prices every time a material fee changes, every time COGS shifts, and every time your advertising cost-per-unit moves meaningfully. August 2026 is a mandatory update event because multiple fee inputs changed simultaneously across the first half of the year.
Common Mistakes Sellers Are Making Right Now
Based on the patterns emerging in 2026 seller discussions and the structure of Amazon’s fee changes, there are several recurring errors in how sellers are responding to (or failing to respond to) the current environment.
Treating the $0.08 Average as the Actual Increase
The $0.08 figure is a weighted average across all U.S. FBA products. It masks significant variance by price band and size tier. Using this number to update your floor prices wholesale will leave you underpriced on high-ticket or large-standard items and potentially overpriced on sub-$10 items where the Low Price FBA discount is material. Pull the actual fee for your specific ASIN using Amazon’s fee preview tool.
Not Accounting for the Fuel Surcharge
A surprising number of sellers have updated their floors for the January base fee increase but haven’t yet reflected the April 17 fuel surcharge. This is partly because the surcharge was framed as a separate, later event — but it’s been in effect for months. If you set floors in January and haven’t touched them since, they’re understated.
Managing Inventory at the Parent ASIN Level
The shift to FNSKU-level low-inventory fee assessment means parent-level inventory health reports are no longer sufficient for fee risk management. You need to see days of supply at the FNSKU level, sorted ascending, and you need a replenishment trigger set at 35 days of supply per FNSKU — not 28, to account for transit time.
Ignoring the Interaction Between Price and Fee Band
Prices near the $10 threshold (roughly $9.50–$11.50) warrant explicit modeling on both sides of the band break. Products at $10.25 that could move to $9.99 might be more profitable at the lower price due to the Low Price FBA rate differential. Products at $9.50 where a $0.50 price increase would push them to $10.00 (and into the standard fee band) might be better left below $10.
Not Planning Q4 Floor Prices Before October 15
The peak period begins October 15. Price floors need to reflect peak-period fees before that date, not after. If you wait until mid-October to model peak costs, you’ll either be selling at unprofitable prices during the first weeks of peak season while you adjust, or you’ll be scrambling to raise prices during the period when competitive pressure is highest.
The August Repricing Audit: What to Work Through This Week
Given everything above, here’s a practical working sequence for sellers who want to address the full fee stack before Q4 pressure arrives.
Step 1: Export Your FBA Inventory at the FNSKU Level
Go to Seller Central → Reports → Inventory → FBA Manage Inventory Health. Download the report and filter the data to show each FNSKU with its current days of supply (both 30-day and 90-day historical). Flag every FNSKU with fewer than 35 days of supply on either metric.
Step 2: Pull Current Fulfillment Fees Per ASIN
Use the FBA Revenue Calculator in Seller Central for your top ASINs by revenue. Enter the current sale price and check the current fulfillment fee figure — not an estimate, the actual fee Amazon is currently charging. This is your baseline for the fuel surcharge calculation.
Step 3: Build the Full Cost Model Per FNSKU (Top 20 by Revenue)
Don’t try to do this for your entire catalog at once. Prioritize the top 20 ASINs by revenue, which likely account for 60–80% of your FBA volume. Build the complete cost stack (COGS, FBA fee, surcharge, referral, placement, returns estimate, ad spend) for each. Calculate the true floor price. Compare to your current minimum price setting in your repricer or in Seller Central’s Automate Pricing rules.
Step 4: Identify Misalignments and Prioritize Updates
Flag any ASIN where the current minimum price is below the true cost floor. Update those first. Then flag ASINs where the current price is more than 5% above the floor — these may have room to be more competitive if competitive pricing is throttling your Buy Box share.
Step 5: Set Q4 Floor Prices Separately
Create a secondary floor price for each top ASIN that reflects the October 15 peak fee addition. Note this figure and schedule a reminder for October 10 to update your repricer floors before peak fees kick in. The October 10 update should be a calendar item right now — not something you plan to remember.
Step 6: Set a Quarterly Review Cadence
Amazon’s fee structure has now demonstrated that it changes multiple times per year, not just at annual updates. A quarterly cost-floor review — timed to February, May, August, and November — ensures you’re catching changes before they compound. The August review cycle is this one. The November review is right as peak season gets underway and is critical for identifying post-peak fee return to normal rates so you can drop floors back down for post-holiday clearance.
Conclusion: The Margin Is in the Detail Work
Amazon’s 2026 fee environment is one where the sellers who protect their margins will be the ones doing per-FNSKU math rather than per-catalog averages. The headline numbers — $0.08, 3.5%, $0.32 — are summaries of a more granular reality that treats every product tier, every price band, and every inventory position differently.
The practical opportunity in August 2026 is that most sellers haven’t done this work yet. They’ve seen the Seller Central notices, absorbed the headline numbers, maybe adjusted a few floors in January, and moved on. The fuel surcharge has been silently compressing margins since April. The FNSKU-level low-inventory fee is now penalizing variant-heavy catalogs in ways the parent-ASIN-level dashboard doesn’t reveal. And the Q4 peak fee surcharge is two months away from stacking on top of everything that’s already in place.
Sellers who treat August as a repricing and inventory audit moment — not a passive observation moment — enter Q4 with a cost model that matches reality. That means floor prices that protect profitability under peak conditions, inventory levels that avoid FNSKU-level low-inventory fees, and inbound strategies that minimize placement fees on bulky products.
The margin improvement from this work isn’t speculative. It’s the difference between what you’re currently paying and what you’d pay if you updated every input in your cost model to today’s actual fee structure. For most multi-SKU FBA catalogs, that gap is measurable in dollars per unit, across thousands of units. Do the math before Q4 does it for you.