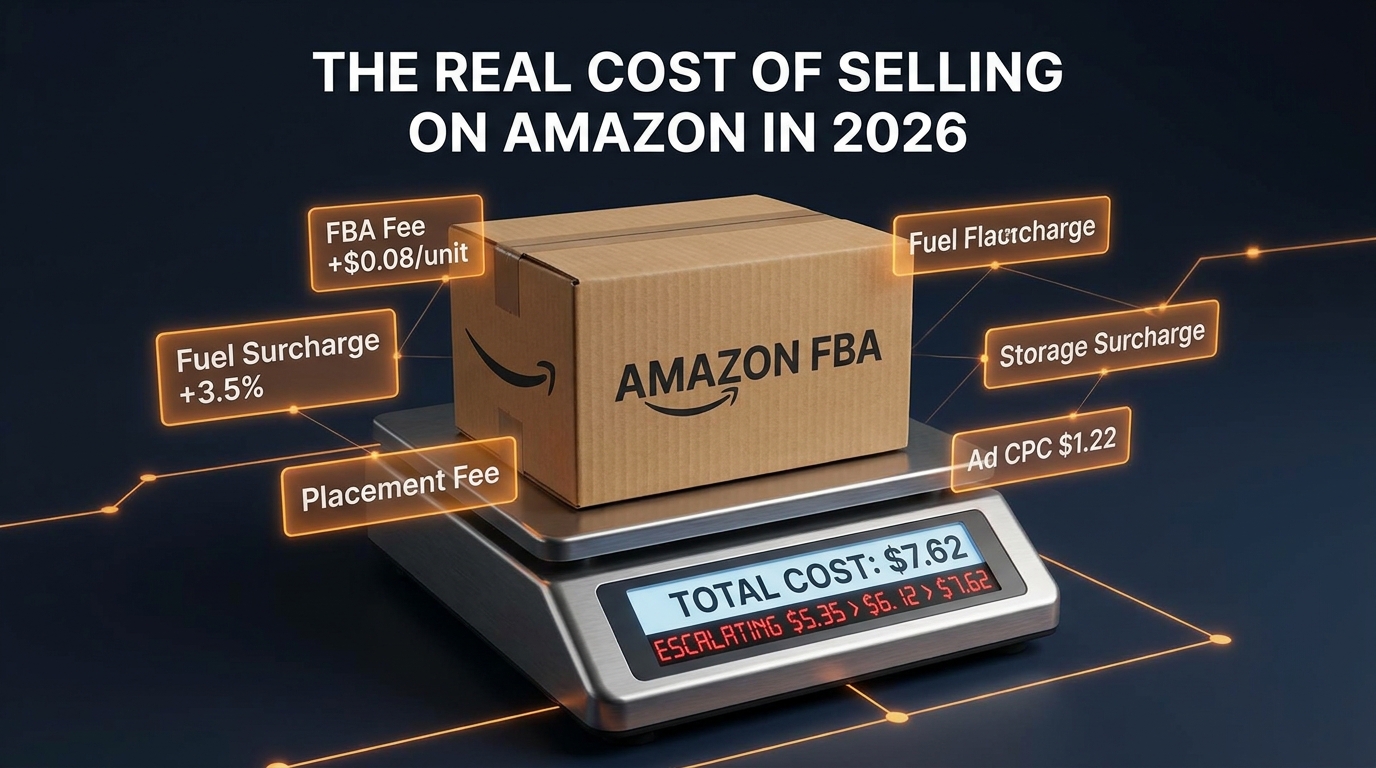

Amazon didn’t announce one giant fee hike in 2026. It didn’t need to. What happened instead was a sequence of individually defensible adjustments — a base fulfillment rate reset in January, a fuel surcharge in April, a restructured inbound placement fee schedule, a low-inventory fee recalculated at a more granular level, an aged-inventory surcharge with sharper tiers, and advertising costs that quietly kept climbing. Each change, taken alone, reads as minor. The official line on the January FBA increase was “less than 0.5% of an average item’s selling price.” That sounds reasonable.
But sellers don’t absorb one fee. They absorb all of them, simultaneously, on every unit, for every active FNSKU in their catalog. And when you start doing the real arithmetic — stacking referral fees, base fulfillment costs, placement charges, storage penalties, advertising spend, and surcharges — the picture that emerges is one of cumulative margin erosion that no single press release was ever going to advertise clearly.
This article is that math. Not the headline version. Not the official summary. The version that shows what these fees actually cost across different product types, price points, and operational scenarios — and what sellers who are adapting successfully are doing differently as a result. If you’ve been running your SKU-level P&L off last year’s numbers, this is worth reading before you reprice, reorder, or reforecast.
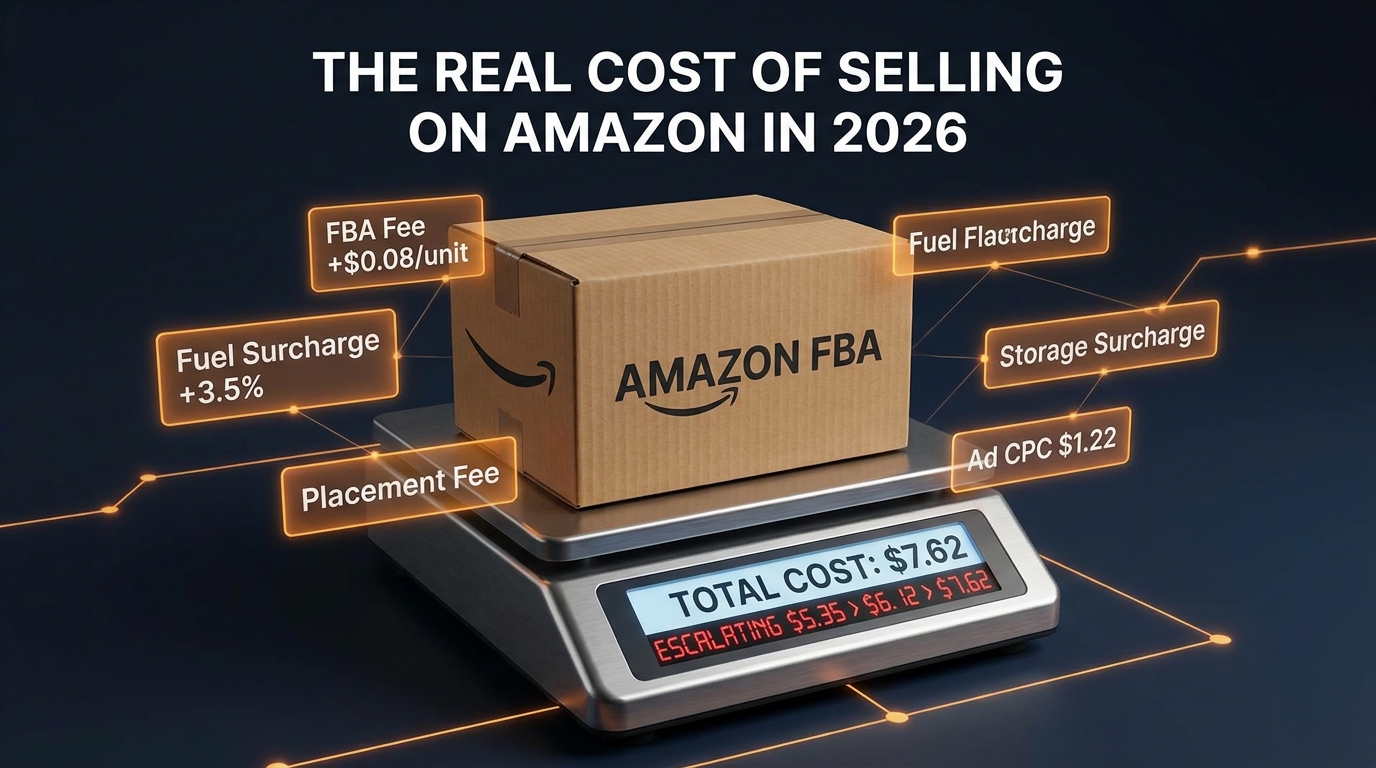
The January Reset: How the 2026 FBA Base Fee Hike Actually Works
Amazon’s FBA fulfillment fee increase that took effect on January 15, 2026, is the foundation of this year’s cost story. The official average — $0.08 per unit — is technically accurate in the same way that “average” water temperature tells you nothing useful about whether you’ll get burned. The actual increase varies substantially by size tier and price band, and the variance matters enormously depending on what you sell.
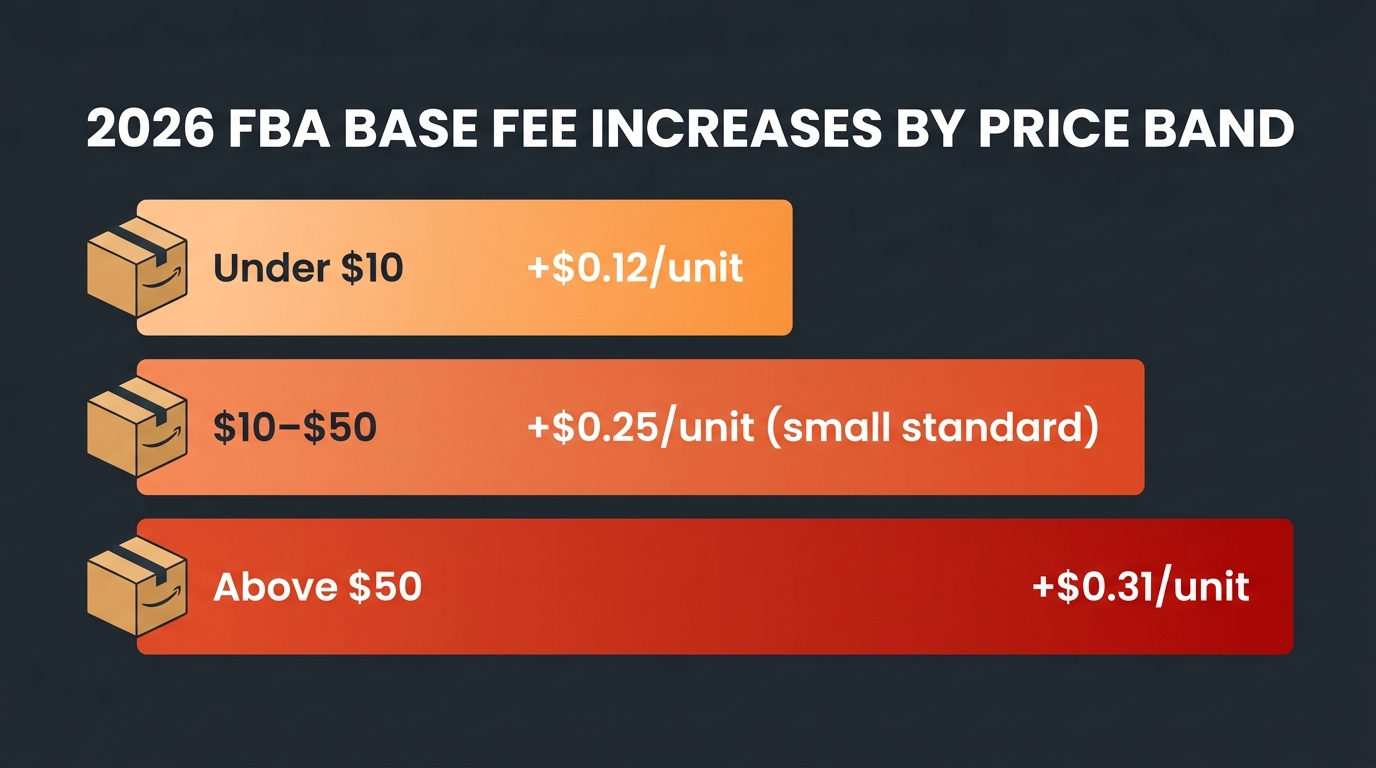
What the Price Bands Actually Show
For small standard-size items priced between $10 and $50 — arguably the most popular segment of the Amazon catalog — the fulfillment fee increase averages $0.25 per unit. That’s not $0.08. For items above $50 in the small standard tier, the increase averages $0.31 per unit. On large standard-size items in the same $10–$50 band, the increase is approximately $0.05 per unit. Below $10, small standard items see roughly $0.12 more per unit.
The headline $0.08 average is blended across all tiers and all price points — including categories where increases are minimal. If your catalog is concentrated in the $10–$50 standard-size range, you’re not experiencing the average. You’re experiencing something considerably higher.
Why This Timing Matters
Amazon skipped a U.S. FBA fee increase in 2025. That was widely reported as seller-friendly. And in isolation, it was. But the 2026 increase didn’t arrive as a standalone event — it arrived alongside the inbound placement fee update, the low-inventory fee restructuring, and the impending April surcharge. The 2025 reprieve meant sellers had one year where their cost models stayed reasonably stable. That’s now over, and the adjustment is happening across multiple fee categories at once.
For sellers who didn’t update their pricing or cost models during 2025, the gap between what they expected to pay and what they’re actually paying in mid-2026 can be significant. A standard-size item selling for $29.99 that generated $3.50 in margin before the fee changes may now generate $3.00 or less — before advertising is factored in.
The Size Tier Reclassification Trap
It’s also worth flagging a pattern that catches sellers every year: dimensional weight and size tier reclassifications. Amazon periodically updates its measurement standards and may reclassify products that were borderline large-standard into a higher tier, or borderline standard into Large Bulky. If your product is near a size boundary, it’s worth verifying your current tier assignment in Seller Central before assuming your 2025 fulfillment cost still applies.
The April Gut Punch: The 3.5% Fuel and Logistics Surcharge
If the January base fee increase was the slow burn, April’s 3.5% fuel and logistics surcharge was the more visible hit. Effective April 17, 2026, Amazon added a 3.5% surcharge to U.S. FBA fulfillment fees — framed as a response to rising fuel and transportation costs in the logistics network.
How the Surcharge Stacks
The 3.5% isn’t applied to your selling price. It’s applied to your FBA fulfillment fee, after the January base rate already took effect. So if your small standard item previously cost $3.22 to fulfill, and the January increase brought that to roughly $3.47, the April surcharge adds approximately $0.12 on top — bringing total fulfillment cost to around $3.59 for the same unit that cost $3.22 before January.
That’s an 11.5% increase in fulfillment cost over two months, on what Amazon characterized as a modest adjustment. For high-volume sellers processing tens of thousands of units per month, that math adds up fast. A seller moving 50,000 standard-size units per month sees over $18,500 in additional annual fulfillment costs from these two changes alone — before storage, placement, or advertising changes are layered in.
The Surcharge as a Precedent Problem
The more strategically important issue with the fuel surcharge is what it represents as a mechanism. Traditional FBA fee increases go through a formal announcement cycle, give sellers several months to adjust, and come with detailed rate cards in Seller Central. A surcharge is structurally different — it can be adjusted, expanded, or extended without requiring a full rate card revision. Amazon’s carrier partners have used fuel surcharges this way for years. This is Amazon applying that same tool to its seller-facing fee structure.
Sellers who treated the April surcharge as a one-time event and moved on may be underestimating the extent to which surcharge-style adjustments could become a more regular part of Amazon’s fee toolkit. Building a cost model that assumes a static FBA rate is now more fragile than it was two years ago.
Inbound Placement Fees: The Hidden Cost Most Sellers Are Still Miscalculating
The inbound placement fee is arguably the least understood cost in the FBA ecosystem, which is a problem because it’s one of the more controllable ones — if you understand how it works. For shipment plans created on or after January 15, 2026, Amazon updated the inbound placement fee schedule, and the changes are not trivial for sellers using minimal shipment splits.
Minimal Split vs. Amazon-Optimized: The Core Trade-Off
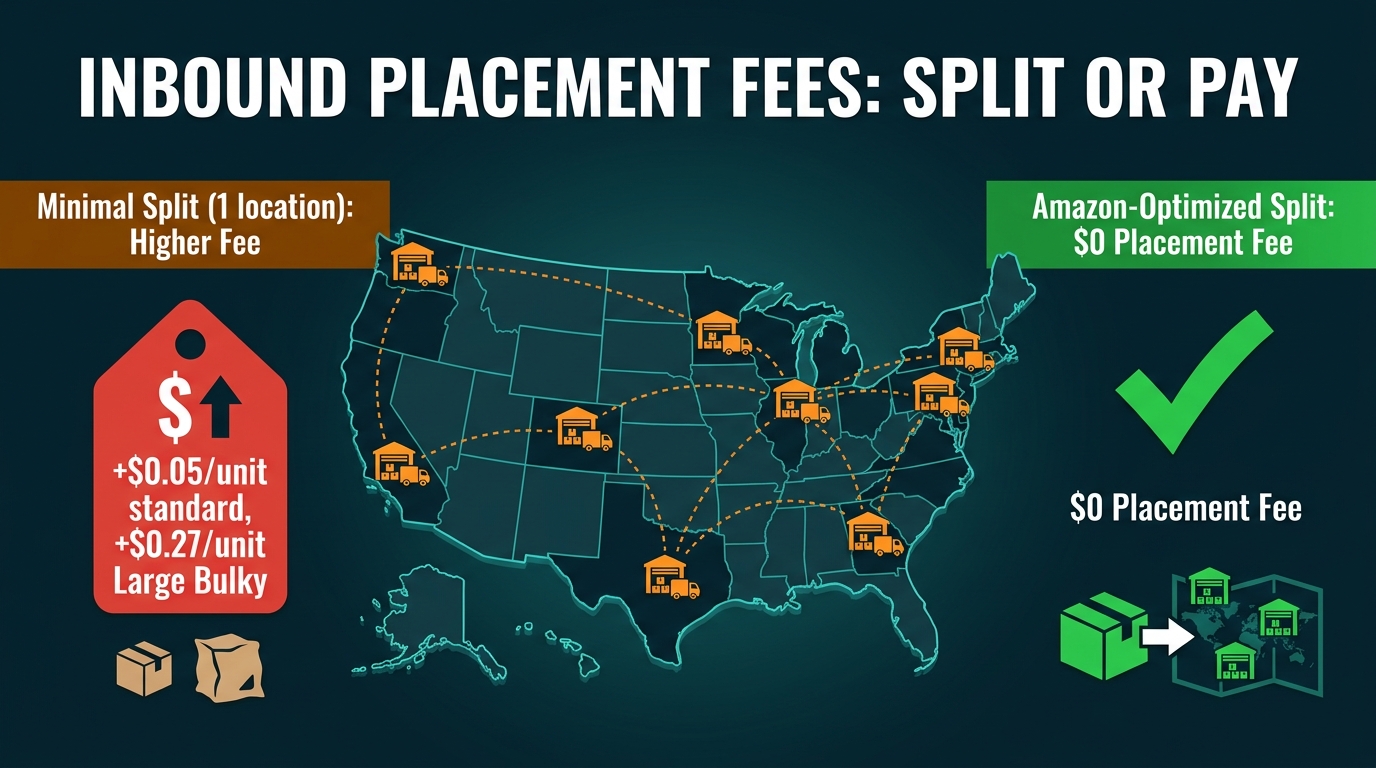
Amazon’s inbound placement fee is essentially a charge for the network optimization Amazon has to do when your inventory doesn’t arrive distributed across multiple fulfillment centers. If you send all your inventory to one location — a “minimal shipment split” — Amazon still needs to move units to wherever demand exists. You pay for that logistics work via the placement fee.
The update for 2026 increased the minimal-split fee for standard-size items by about $0.05 per unit on average. For the new Large Bulky tier (Amazon split the old Large Bulky category into Small Bulky and Large Bulky), minimal-split fees increased by approximately $0.27 per unit. In practical terms, a 100-unit standard-size shipment that previously cost $37 in placement fees now costs approximately $42 for the same minimal-split configuration.
The Zero-Dollar Alternative
The critical nuance that many sellers miss: Amazon-optimized splits carry a $0 placement fee. If you’re willing to send inventory to multiple Amazon-designated fulfillment centers in a single shipment plan, you can eliminate the placement fee entirely. The trade-off is operational complexity — shipping to two, three, or four locations instead of one means higher carrier costs on your side of the transaction.
Whether the zero-fee option actually saves you money depends on your carrier rates, your shipment volumes, and the destinations Amazon assigns. For sellers working with 3PLs or freight forwarders who can build multi-destination shipments efficiently, the Amazon-optimized split often pencils out. For smaller sellers shipping via UPS or FedEx in smaller batches, the carrier cost of splitting shipments can exceed the placement fee savings.
The New Size Tier Complexity
The creation of separate Small Bulky and Large Bulky tiers also means sellers with products previously in the undifferentiated Large Bulky category need to verify which tier their products now fall into and recalculate placement fees accordingly. The Large Bulky tier carries meaningfully higher minimal-split fees than Small Bulky, so the reclassification isn’t cost-neutral for products near the boundary.
For sellers who haven’t audited their inbound strategy since the January update, this is the single most actionable line item to review. The placement fee difference between minimal-split and Amazon-optimized can represent a meaningful per-unit cost that compounds across high-volume SKUs.
Low-Inventory Fees Go Granular: The FNSKU-Level Trap
The low-inventory-level fee has existed in Amazon’s fee structure for a while, but its 2026 configuration creates a specific operational trap that’s caught a significant number of multi-variation sellers off guard. The fee now applies at the seller-FNSKU level rather than the parent ASIN level — a change that sounds technical but has real financial consequences for sellers with variation listings.
How the Calculation Works
Amazon charges the low-inventory-level fee when a product’s both 30-day and 90-day historical days of supply fall below 28 days. The fee is added on top of the standard FBA fulfillment fee for eligible units shipped during that period. It applies to standard-size, Small Bulky, and Large Bulky products (Grocery and a few other categories are exempt).
Under the old parent-ASIN calculation, if you had a listing with five color variants and four of them were well-stocked, the healthy inventory across the parent could mask a single depleted variant. The FNSKU-level calculation removes that averaging. Each variant is now evaluated independently. A size XL that’s running low triggers the fee on XL units sold — regardless of whether XS, S, M, and L are fully stocked.
Why Variation Sellers Are Most Exposed
The real-world impact falls hardest on sellers with broad variation matrices — apparel, footwear, personal care products, supplements with multiple formats, or any product line with significant size or color optionality. Managing inventory balance across 15 or 20 FNSKUs with different sell-through rates is genuinely difficult, and a single slow-moving variant that dips below 28 days of supply is now a fee trigger in its own right.
The strategic implication is a push toward tighter inventory discipline at the FNSKU level. That means more frequent restocking cadences for individual variants, earlier reorder points, and potentially discontinuing or throttling back on slow variations that are expensive to keep above the 28-day threshold but don’t sell enough to justify the overhead. For catalogs with dozens of variations, this fee has quietly become an inventory management tax on complexity.
AWD Auto-Replenishment as a Bypass
Amazon’s own Amazon Warehousing and Distribution (AWD) program offers an exemption: items enrolled in AWD with auto-replenishment enabled are not subject to the low-inventory fee. This is a meaningful benefit for sellers whose reorder cycles are long enough to regularly dip below 28 days. Whether AWD’s economics make sense overall depends on your storage needs, inbound volumes, and whether AWD’s monthly storage cost is lower than the combined low-inventory fee exposure plus traditional FBA storage fees. It’s worth modeling before assuming AWD is automatically the right answer.
Aged Inventory Surcharges: The New Tier Structure That Punishes Slow SKUs Hard
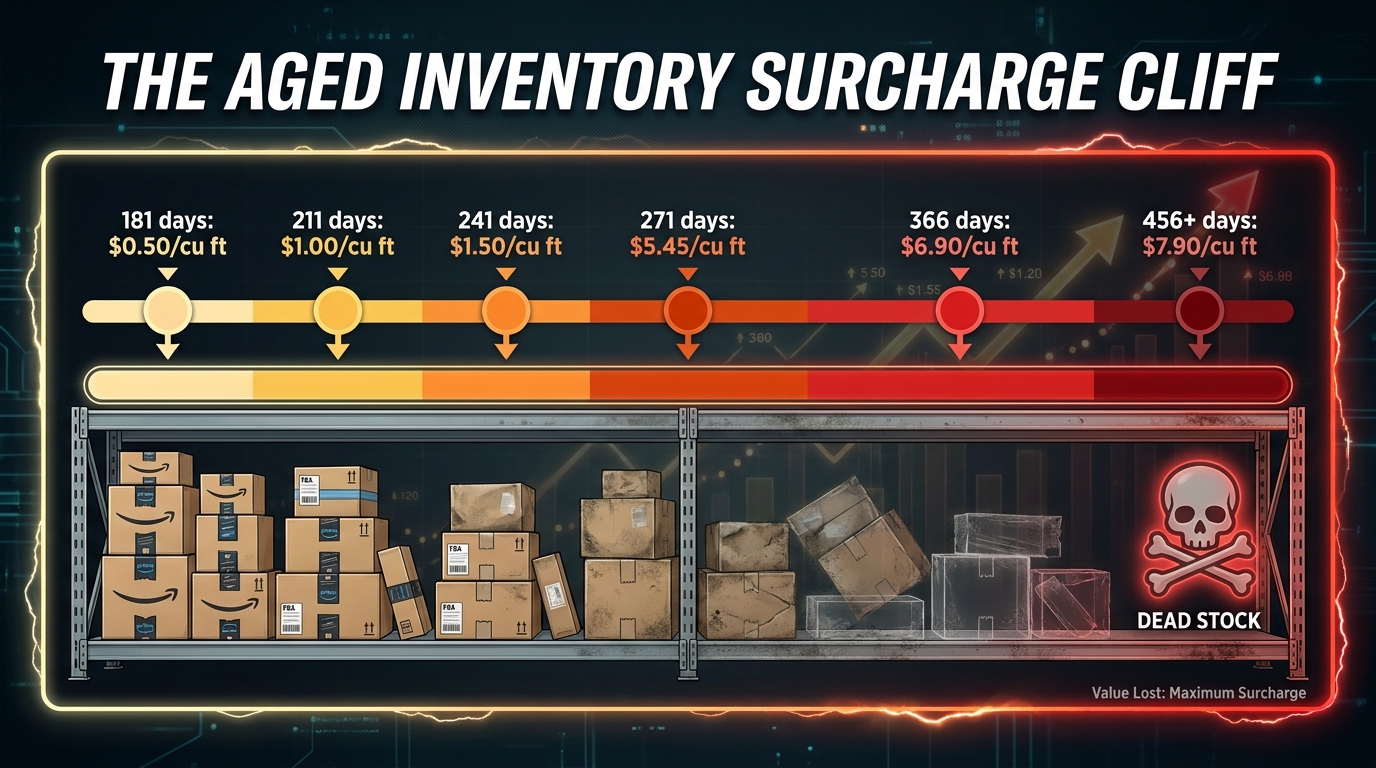
Amazon’s aged inventory surcharge — the renamed replacement for what was previously called the long-term storage fee — underwent a structural shift that makes slow-moving FBA inventory significantly more expensive to hold. The most important change: the surcharge now starts at 181 days, and the rate escalation beyond that threshold is steep.
The Tier Structure in Full
The 2026 aged inventory surcharge structure, charged monthly on top of regular storage fees, progresses as follows:
- 181–210 days: $0.50 per cubic foot per month
- 211–240 days: $1.00 per cubic foot per month
- 241–270 days: $1.50 per cubic foot per month
- 271–300 days: $5.45 per cubic foot per month
- 301–330 days: $5.70 per cubic foot per month
- 331–365 days: $5.90 per cubic foot per month
- 366–455 days: $6.90 per cubic foot per month (or $0.30 per unit, whichever is greater)
- 456+ days: $7.90 per cubic foot per month (or $0.35 per unit, whichever is greater)
The cliff at 271 days is dramatic. A product costing $1.50/cu ft at day 270 jumps to $5.45/cu ft at day 271 — a 3.6x rate increase overnight. For a moderately sized product occupying 0.5 cubic feet, that’s the difference between paying $0.75/month and $2.73/month in aged surcharges, on top of already-accruing standard storage fees.
The Old LTSF vs. The New Structure
Many sellers still mentally model their inventory costs against the old long-term storage fee schedule, which had a cleaner cliff structure and different trigger points. That mental model is now incorrect in two important ways: the surcharge starts earlier (181 days vs. the older 271-day trigger many sellers remember), and the rate escalation is more granular, meaning costs compound more gradually but start sooner than expected.
Sellers who habitually let slower-moving inventory sit in FBA for five to six months — perhaps seasonal products, slow variations, or promotional stock that underperformed — need to recalibrate their carry-cost assumptions. A unit that hits 181 days of FBA storage is now a fee event, not just a space-management concern.
The Proactive Response: Liquidate, Remove, or Reroute
The practical response framework for aged inventory in 2026 involves three decision points: (1) can you accelerate sell-through by adjusting price, running promotions, or improving ad visibility before the 181-day mark? (2) if not, does a removal or disposal make sense given current fees? (3) for products that reliably slow down seasonally, should the inventory be rerouted to FBM or a 3PL during slow periods rather than sitting in FBA accruing surcharges? The answer to all three depends on your product economics, but making no decision is now the most expensive option by default.
The Ad Cost Multiplier: When Rising CPCs Stack on Rising Fulfillment Costs
Advertising costs don’t appear on the Seller Central fee schedule, but they function as a de facto tax on discoverability — and in 2026, they’re rising in ways that amplify the pressure from structural fee increases. Amazon’s blended average CPC sits around $1.18–$1.22 in 2026, representing an estimated 8–12% year-over-year increase versus 2025, and roughly 60% above 2020 levels.
The ACoS Reality Check
Sponsored Products — still the highest-volume, most cost-efficient ad format — carries a platform median ACoS near 29% across most benchmarks, with category-specific variance that can push it well above 35% in competitive niches. Put that in context: a product selling at $29.99 with a 29% ACoS is spending $8.70 in advertising per unit sold. Add a 15% referral fee ($4.50), $3.59 in fulfillment fees (post-January and April changes), and you’re already at $16.79 in platform costs before inbound placement, storage, returns, or product cost are touched.
That leaves $13.20 against cost of goods, overhead, and profit — on a nearly $30 product. For many sellers in mid-priced, competitive categories, those numbers are uncomfortable. For sellers who haven’t refreshed their break-even ACoS calculation since last year’s fee schedule, they may be running campaigns that actively destroy margin without realizing it.
Why CPCs Will Keep Climbing
The structural driver of Amazon CPC inflation is relatively straightforward: the number of sellers competing for visibility continues to grow faster than available ad inventory. Prime Day, peak Q4, and major promotional events create predictable CPC spikes — some benchmarks project Q4 2026 CPCs hitting $1.35–$1.45 for competitive standard-size products. Sellers who fix their ad budgets but don’t adjust for seasonal CPC changes often find their Q4 traffic drops precisely when conversion rates are highest.
The interaction between rising CPCs and rising fulfillment fees is where the margin math gets most treacherous. Higher fulfillment costs reduce the margin available to support advertising. But reducing ad spend in competitive categories often reduces visibility, which reduces conversion, which can affect BSR and organic ranking — pushing more sales through paid traffic, which costs more. It’s a feedback loop that sellers need an explicit strategy to break out of.
The Break-Even ACoS as a Fee Dashboard Input
The most useful reframe for managing advertising costs against 2026’s fee structure is updating your break-even ACoS calculation every time any input fee changes. Break-even ACoS = (selling price − all non-ad costs) ÷ selling price. When fulfillment fees go up, break-even ACoS goes down, meaning you have less room to spend on ads before going negative. Sellers who treat break-even ACoS as a quarterly recalculation rather than a set-and-forget number are in a meaningfully better position to manage ad spend against the current fee environment.
MCF and Buy with Prime: The Off-Amazon Fee Creep
Fee pressure in 2026 isn’t limited to FBA listings on Amazon.com. Multi-Channel Fulfillment (MCF) and Buy with Prime — Amazon’s tools for using FBA inventory to fulfill orders from other channels — both saw cost increases that affect sellers operating omnichannel strategies.
MCF Base Fee and Surcharge Timeline
MCF fulfillment fees increased by approximately $0.30 per unit on average with the January 15, 2026 base rate update — a larger per-unit increase than FBA’s average, reflecting the additional handling required for non-Amazon channel orders. On top of that, Amazon added the 3.5% fuel and logistics surcharge to U.S. MCF fees starting May 2, 2026, roughly two weeks after the same surcharge hit FBA fees.
For the latter half of 2026, sellers also need to account for a peak-season MCF surcharge running from October 15, 2026 through January 14, 2027 — an additional cost layer during the period when MCF usage typically spikes alongside direct-to-consumer holiday demand.
Buy with Prime Cost Impact
Buy with Prime fulfillment fees increased by approximately $0.24 per unit on average in 2026. For brands using Buy with Prime to bring Prime-level conversion rates to their Shopify or DTC storefronts, that increase is meaningful. The question of whether Buy with Prime still generates enough conversion lift to justify its total cost — fulfillment fee plus the Buy with Prime service fee — is now a more complex calculation than it was when fees were lower.
One notable offset: Amazon is currently waiving the 5% surcharge for blocking Amazon Logistics (the fee for MCF sellers who choose not to use Amazon delivery branding) through January 14, 2027. For brands with DTC positioning that prefer neutral packaging or carrier branding, that waiver has real value — but it’s temporary, and planning beyond mid-January needs to account for its expiration.
The Omnichannel Math Shift
For sellers who built their fulfillment strategy around using a single FBA inventory pool to serve both Amazon and other channels, the 2026 cost increases have shifted the economics of that approach. The efficiency argument for unified inventory — fewer stockouts, simpler operations, shared replenishment — still holds. But the cost advantage over dedicated 3PL fulfillment for off-Amazon channels has narrowed. Sellers moving more than a few hundred MCF units per month should be running a direct comparison against their 3PL options under current rates.
Total Cost to Sell: Building the Real Number Most Sellers Ignore
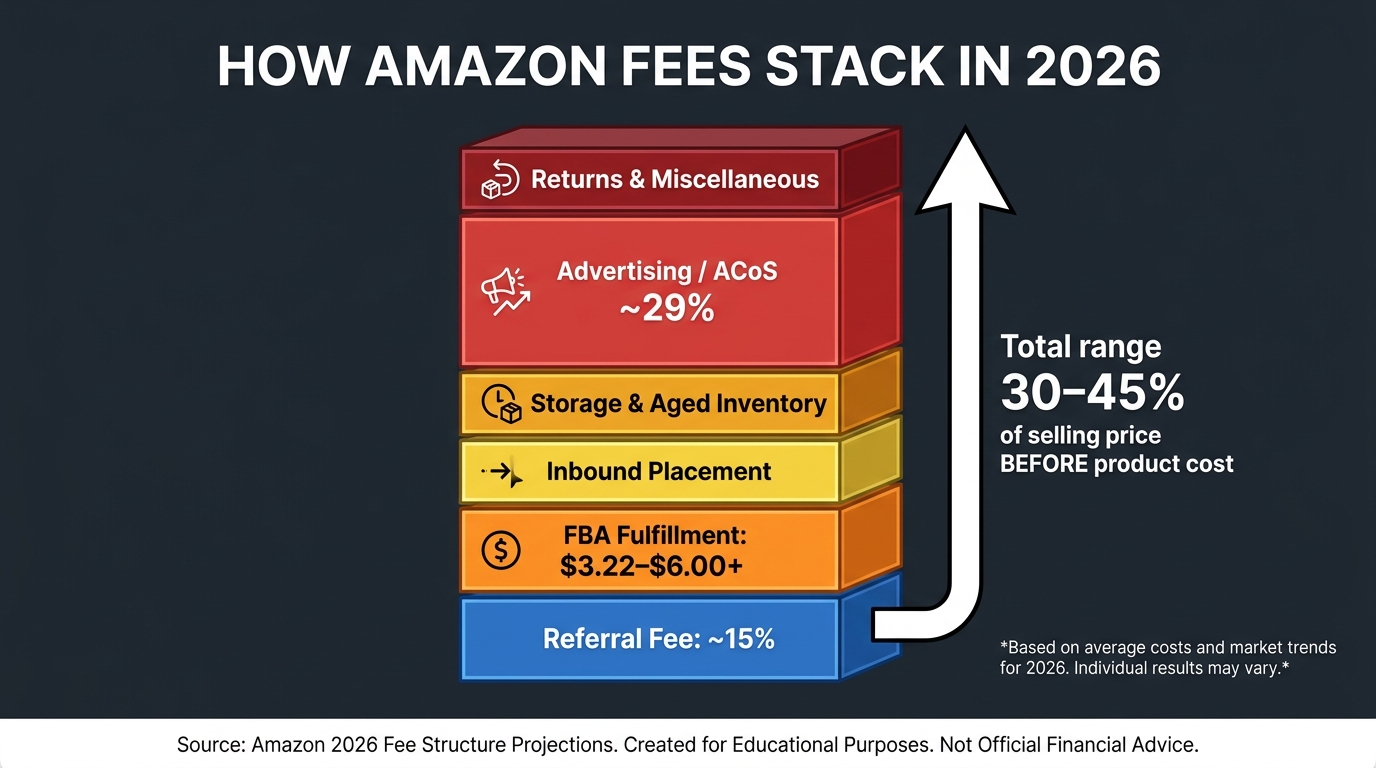
The most common analytical failure in Amazon seller P&L management is calculating margin against revenue instead of against total platform cost. Industry analysis of Amazon’s 2026 fee structure consistently puts the all-in platform cost at 30–45% of selling price before product cost for typical FBA sellers — and higher when advertising spend is included. That’s not a number Amazon publishes. It’s a number sellers have to build themselves.
The Full Fee Stack, Layer by Layer
A realistic total cost model for a $29.99 standard-size FBA product in a 15% referral fee category looks something like this in mid-2026:
- Referral fee (15%): $4.50
- FBA fulfillment fee (post-January + April surcharge, small standard ~8 oz): ~$3.80–$4.20
- Inbound placement fee (minimal split, standard-size): ~$0.40–$0.60 per unit
- Monthly storage fee (prorated per unit): $0.15–$0.50 depending on cubic footage and season
- Advertising spend (29% ACoS): $8.70
- Returns, reimbursements, and miscellaneous: typically $0.50–$1.50 per unit on average
Summing the midpoints: approximately $18–$20 in total platform costs on a $29.99 product. That leaves roughly $10 against cost of goods and any remaining profit — a contribution margin of around 33% before COGS. For sellers with COGS of $7–$9 (common for private-label products in this price range), actual net margin is $1–$3 per unit. That’s thin by almost any standard.
Why Account-Level Revenue Masks SKU-Level Pain
One of the most dangerous patterns in Amazon account management is evaluating performance at the account level while individual SKUs erode. Total revenue may be up, total units sold may be up, and the account may appear healthy — while a growing percentage of the catalog is operating at breakeven or negative contribution margin. Fee increases don’t hit all SKUs equally. Low-priced items, bulky items, slow movers, and variation-heavy listings absorb disproportionate cost increases. A portfolio that looked profitable six months ago may now have a meaningful share of deadweight SKUs that are dragging overall margin down.
The answer is SKU-level contribution margin analysis, run under current fee inputs. It’s tedious. It requires pulling fulfillment fee data by ASIN, storage data by FNSKU, advertising performance by campaign and product target, and applying current surcharge rates. But it’s the only way to know which SKUs deserve continued investment and which ones are quietly destroying margin at scale.
The 3× COGS Pricing Rule Is More Important Than Ever
A longstanding heuristic in the FBA seller community — price at 3× cost of goods to maintain viability — has become less of a rule of thumb and more of a floor in 2026. At a $29.99 price point with COGS of $10, the 3× rule generates a 33% COGS margin. As the analysis above shows, that 33% is being absorbed almost entirely by platform costs at current fee levels, leaving very little room for error. For newer sellers setting price, or established sellers evaluating whether to raise prices, the 2026 fee structure makes a strong case for pricing at the higher end of what the market will bear rather than at the lowest competitive price.
FBA vs. FBM in 2026: When the Math Flips
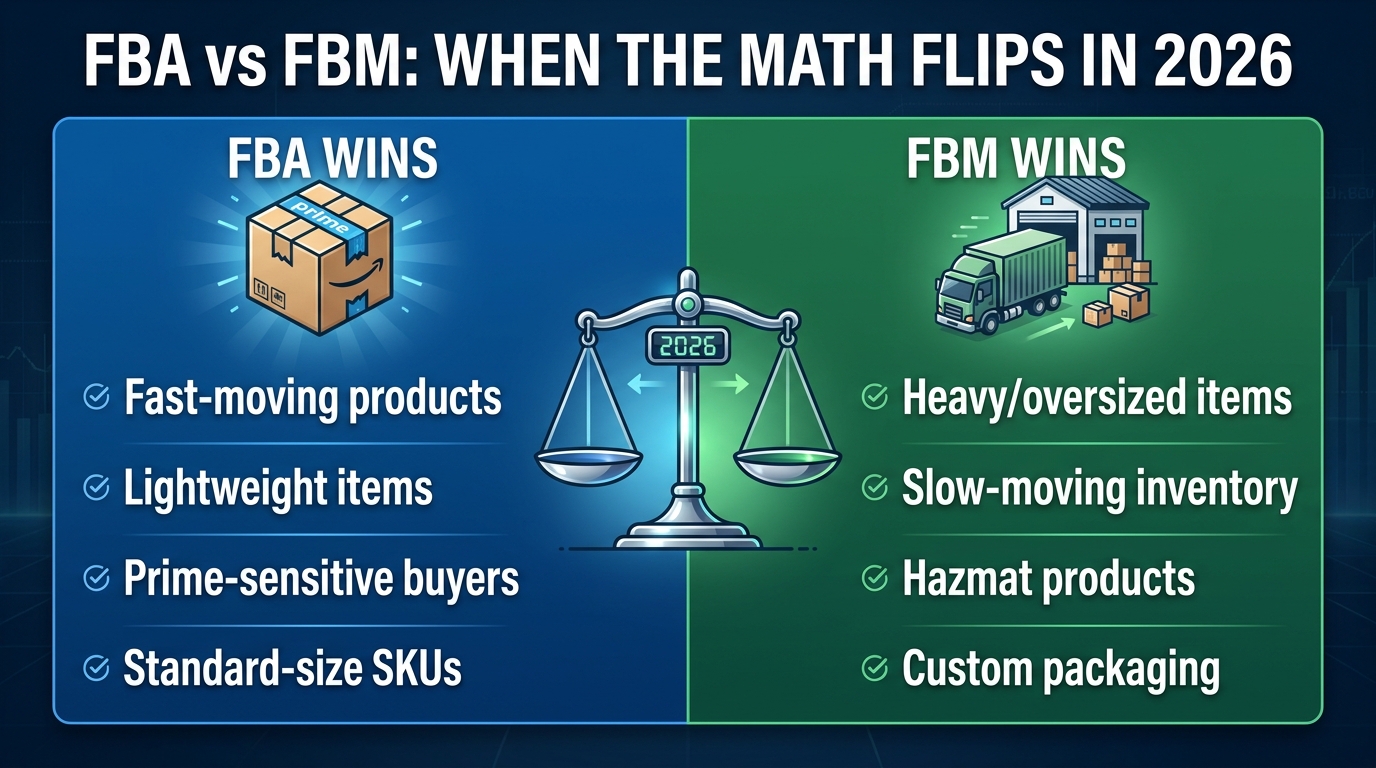
The conventional wisdom that FBA is almost always better than Fulfilled by Merchant (FBM) has eroded in 2026. It hasn’t reversed — FBA still wins decisively for many product types. But the conditions under which FBM makes more financial sense have expanded, and sellers who haven’t compared the two under current rates may be leaving margin on the table.
Where FBA Still Wins
For lightweight, fast-moving, standard-size products that sell through in under 60 days, FBA’s economics remain compelling. The combination of Prime eligibility (and the conversion premium that comes with it), Buy Box preference for FBA listings, and Amazon’s carrier rates — which typically undercut what individual sellers can negotiate — means FBA is genuinely hard to beat for this product profile. The fee increases of 2026 hurt, but they don’t change the fundamental math for high-velocity, well-priced standard-size items.
Where FBM Is Now the Better Call
Heavy, oversized, slow-moving, hazmat, or custom-packaged products present a different calculus. For these items, 2026’s fee structure creates several compounding disadvantages under FBA:
- Inbound placement fees are higher (especially for Large Bulky after the tier split)
- Monthly storage fees are larger due to cubic footage
- Aged inventory surcharges hit faster and harder on slow-moving bulky items
- The low-inventory fee risk is higher on slow-moving SKUs with variable sell-through
A seller fulfilling a heavy item (say, 15 lbs, large standard) via FBA might face a fulfillment fee of $12–$15 per unit, plus placement, plus storage. If the item’s sell-through rate is 30–60 days consistently, and it can be shipped from a 3PL within Prime-adjacent delivery windows (2–3 days), the math may favor FBM or Seller Fulfilled Prime (SFP) — especially if the seller has existing warehouse or 3PL relationships with competitive shipping rates.
The Hybrid Approach
Sophisticated sellers in 2026 are increasingly running hybrid fulfillment models: FBA for their fast-moving, lightweight core SKUs, and FBM or SFP for their heavy, seasonal, or slow-moving tail. This approach requires more operational management but can reduce total platform costs significantly. The key is not treating fulfillment as a set-and-forget decision per SKU, but as a variable that should be reviewed whenever fee inputs or sell-through rates change materially.
Tactical Responses: How Smart Sellers Are Adapting
Across the seller community in 2026, the operators absorbing fee pressure most effectively share a set of common practices that go beyond simply raising prices. The adaptations that are generating the most measurable improvement in contribution margin are largely operational and analytical — not the sort of moves that appear in a single bullet-point tip.
Surgical Catalog Pruning
The first and arguably most high-impact move sellers are making is cutting catalog dead weight. Every slow-moving variation, underperforming size, or low-volume bundle that’s been grandfathered into a catalog because it used to work is now more expensive to maintain than it was 12 months ago. Between placement fees, storage surcharges, low-inventory fees on weak variants, and the opportunity cost of warehouse space, a SKU that generates $200/month in revenue but costs $180/month to maintain is no longer a neutral presence in a catalog — it’s a drain.
The process for identifying candidates isn’t complicated: sort by contribution margin at the FNSKU level, flag anything below a threshold that justifies its fee footprint, and make an explicit decision to promote, reprice, remove, or discontinue. What’s different in 2026 is the urgency — the cost of inaction is higher than it’s ever been.
Inventory Velocity Management
Sellers who’ve historically replenished by calendar cycle — send inventory every 90 days, for example — are shifting to velocity-based replenishment that keeps individual FNSKUs consistently above the 28-day days-of-supply threshold without overstocking into aged inventory territory. This sounds straightforward, but executing it across dozens of SKUs with different sell-through rates requires either disciplined spreadsheet management or a replenishment tool with FNSKU-level tracking. The cost of getting it wrong in either direction — stockout fees vs. aged surcharges — has increased.
Advertising Efficiency Over Volume
With CPCs rising and break-even ACoS tightening, the sellers maintaining margin are prioritizing advertising efficiency over raw traffic volume. That means tighter match types, more aggressive negative keyword management, campaign segmentation by margin profile, and a willingness to pull back on spend for SKUs where break-even ACoS has been breached by fee increases. It also means investing more in listing quality — images, A+ content, review programs — to improve conversion rate on existing traffic rather than spending more to drive additional traffic that converts at the same mediocre rate.
Price Elasticity Testing
The most direct lever for restoring margin — raising prices — is one that many sellers resist for fear of losing Buy Box share or category ranking. But with fee increases affecting all FBA sellers in a category equally, competitors are facing the same margin pressure. Selective price testing at the SKU level often reveals that many products have more pricing headroom than sellers assume, particularly in categories where differentiated products command some degree of customer preference. Even a $1–$2 price increase on a $25–$35 product can recover most of the margin eroded by 2026’s fee changes.
Supply Chain Diversification and Tariff Navigation
For sellers sourcing from China, 2026’s tariff environment has added a third layer of cost pressure on top of fee increases and ad inflation. Strategies sellers are using to navigate this include diversifying sourcing to Vietnam, India, or Mexico for some SKU categories, negotiating landed-cost adjustments with existing suppliers, and in some cases restructuring their FBA shipment strategy to reduce per-unit fees at the margin. There’s no silver bullet for tariff exposure, but sellers who treated their supply chain as static through 2025 are finding 2026 a more expensive lesson in diversification.
The New Arithmetic of Amazon Selling: A Realistic Conclusion
The 2026 Amazon fee environment doesn’t represent a catastrophic disruption for sellers who understand what they’re working with. It does represent a meaningful structural increase in the cost of doing business on the platform — one that can’t be managed by gut feel, last year’s spreadsheet, or the assumption that what was profitable in 2025 is still profitable today.
The core shift is this: Amazon has moved from a model where one or two fees drove most of the cost story to a model with multiple granular fee categories, each of which can increase independently and apply differently to different product types. The January base rate change, the April fuel surcharge, the FNSKU-level low-inventory fee, the inbound placement structure, the aged-inventory tier cliff, and the rising CPC environment all interact. None of them is catastrophic in isolation. Together, they’ve materially changed the margin math for a wide range of catalog configurations.
The Three Numbers Every Seller Needs to Know
Before making any pricing, sourcing, or advertising decisions, every FBA seller in 2026 should know three numbers for each active FNSKU:
- Total cost to sell per unit — including all current fees, not just referral and FBA fulfillment
- Break-even ACoS — recalculated against current fees, not last year’s rates
- Days of supply — tracked at the FNSKU level, not the parent ASIN level
Sellers who have these numbers current are in a position to make good decisions. Sellers who don’t are making decisions based on assumptions that the 2026 fee calendar has already invalidated. The Amazon platform is still one of the most powerful retail distribution channels in the world. But it’s no longer one where the margin is generous enough to absorb operational imprecision. The sellers who adapt to that reality — by knowing their numbers, managing their inventory tightly, pricing appropriately, and auditing their catalog regularly — are the ones who will still be growing when the next round of adjustments arrives.
Key Takeaway: Amazon’s 2026 fee changes aren’t a single event — they’re a compounding cost structure requiring SKU-level analysis, current break-even ACoS calculations, and FNSKU-level inventory management. Update your numbers. The margin you think you have may not be the margin you actually have.