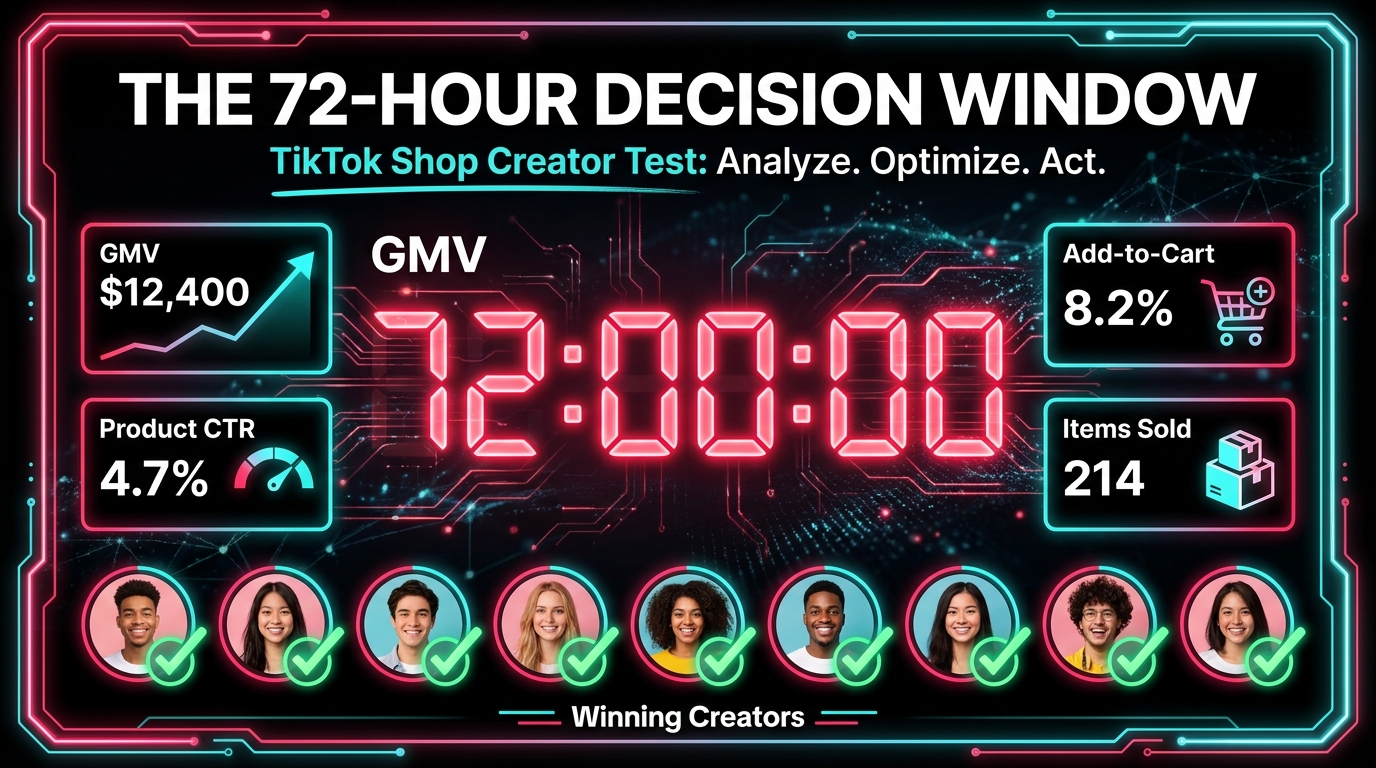

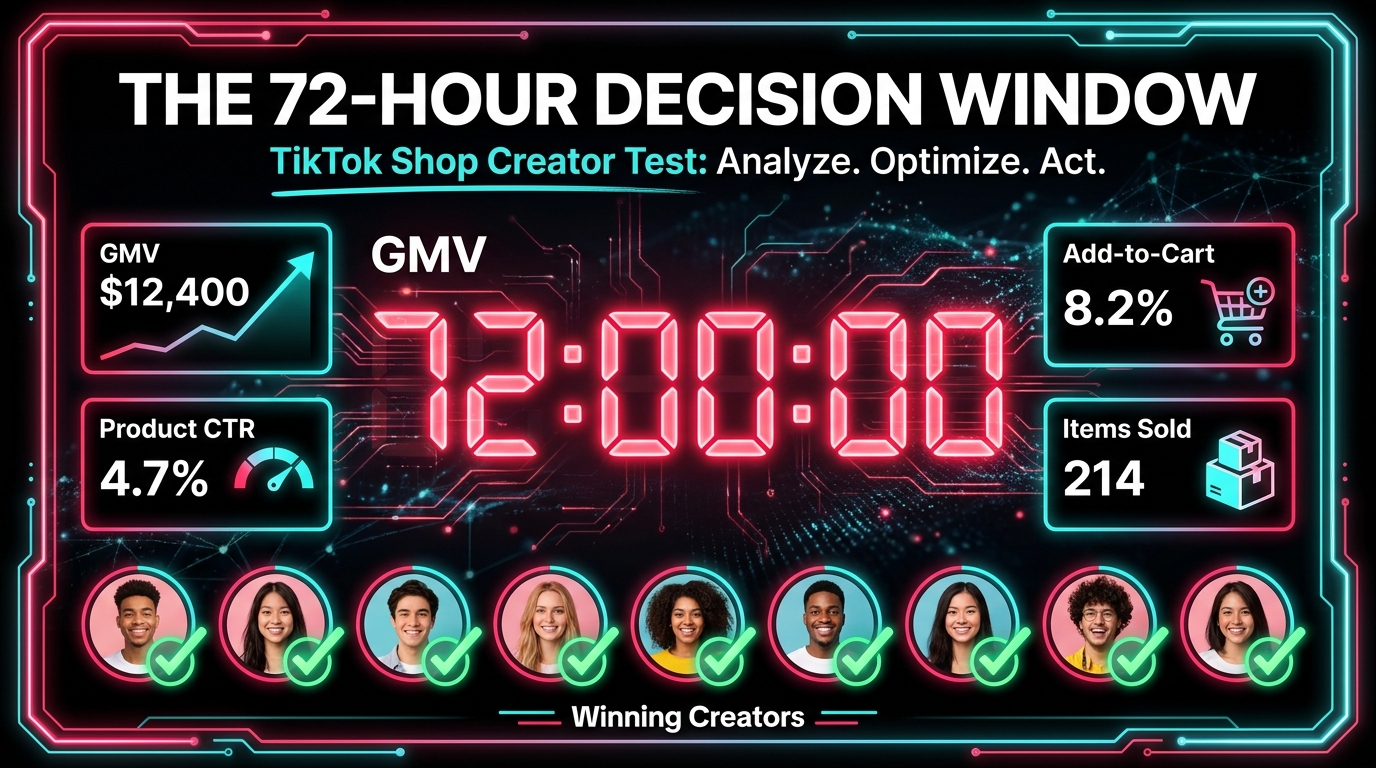
There is no official TikTok policy document called the “72-Hour Creator Test Window.” You will not find it in the TikTok Shop Seller University, and TikTok’s own help center will not serve you a clean definition if you search for it. Yet if you spend any time talking to the operators who are consistently scaling GMV on TikTok Shop in 2026, you hear about 72 hours constantly — as a decision deadline, a measurement checkpoint, a creative filter, and a budget trigger.
What these sellers have figured out, often through painful trial and error, is that TikTok Shop’s content distribution architecture compresses most of a video’s organic commercial potential into a window of roughly 48 to 72 hours. That is not a rule TikTok published. It is a behavioral pattern that emerges from how the algorithm distributes content, how attribution is measured, and how early commerce signals — product clicks, add-to-cart actions, and purchases — determine whether a video gets pushed to wider audiences or quietly deprioritized.
The sellers who understand this are not just watching passively. They have built structured testing frameworks around it: seed a small cohort of creators, let the posts run organically for up to 72 hours, track the right metrics, and then make a clear decision — kill the asset, iterate the angle, or amplify it immediately with Spark Ads and GMV Max. That framework, simple in concept but demanding in execution, is what this article is about.
This is not a primer on TikTok Shop basics. It assumes you already have a shop, some products live, and access to the affiliate creator program. What it covers is the specific operational logic behind the 72-hour test window: why the time boundary exists, how to set tests up correctly, what metrics actually matter, how to read the results, and how to build the whole thing into a repeatable system rather than a one-time experiment.
Why 72 Hours? The Distribution Logic Behind TikTok’s Content Cycle
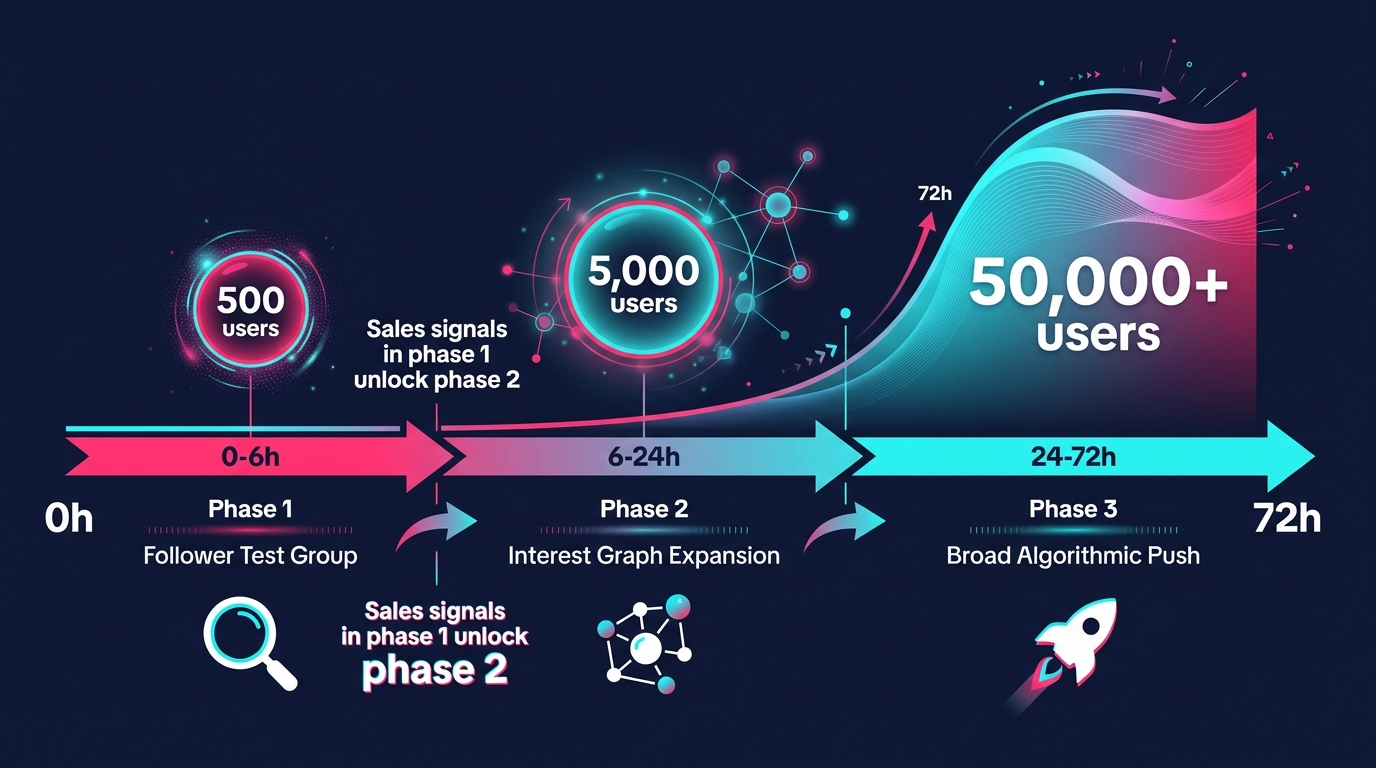
To understand why 72 hours matters, you need to understand how TikTok distributes content in the first place. Unlike Instagram’s chronological-leaning feed or YouTube’s subscription model, TikTok operates on a progressive disclosure system. Every new video — whether it comes from a creator with 1,000 followers or 1 million — gets introduced to a small, controlled audience first. What happens in that early window determines everything that follows.
Phase One: The Follower Test Group (Hours 0–6)
When a creator posts a TikTok, the algorithm’s first move is to show it to a sample of that creator’s existing followers. This is the lowest-stakes test — a small seed group that helps the algorithm gather initial signals without significant distribution cost. Critically, for TikTok Shop content, it is not just engagement signals that matter here. The algorithm is reading commerce-specific behavior: are viewers tapping the product card? Are they clicking through to the product detail page? Are any of them adding to cart?
These commerce signals carry far more weight in the Shop ecosystem than standard engagement metrics like likes or shares. A video that generates strong product link clicks in the first six hours sends a meaningful signal to TikTok’s distribution engine that this content has commercial intent that matches viewer behavior. That combination — reach plus purchase intent — is what unlocks Phase Two.
Phase Two: Interest Graph Expansion (Hours 6–24)
If Phase One signals are strong enough, the algorithm begins distributing the video beyond the creator’s follower base, pushing it toward users whose interest graph — browsing behavior, watch history, previous purchases, content interaction — aligns with the product category and content type. This is where TikTok Shop’s data advantage becomes visible. Because TikTok owns both the social platform and the commerce layer, it can match content to users who are not just interested in the topic but are actively in purchase mode for that product type.
For a skincare product video, Phase Two distribution targets people who have previously watched skincare content, clicked on skincare product cards, or purchased in adjacent categories. The audience expands meaningfully at this stage — from hundreds of test viewers to potentially tens of thousands — but still with guardrails. The algorithm continues monitoring whether commerce signals hold as the audience broadens.
Phase Three: Broad Algorithmic Push (Hours 24–72)
Phase Three is where a winning video breaks through to full distribution. If commercial signals have remained strong through Phase Two, TikTok’s algorithm begins pushing the content at scale — to users outside the creator’s niche, to users who have never interacted with the brand, and potentially to the For You page at volume. This is the phase most sellers associate with “going viral,” but in TikTok Shop terms, its commercial significance is more important than its entertainment value.
The reason 72 hours functions as a natural endpoint is that most content’s organic commercial momentum peaks and then decelerates within this window. TikTok’s attribution system uses a one-day view-through window and a seven-day click window for Shop purchases, which means that most organic GMV generated by a video tends to concentrate in the first three days. After that, the content may still receive impressions, but the marginal return on each view falls significantly.
This is why the 72-hour mark functions as a practical decision gate. Not because TikTok flips a switch at hour 72, but because the data you have accumulated by that point is representative enough to make a confident call. You know whether the content has commercial traction or not. Waiting longer rarely changes the verdict; it just delays the decision.
The Creator Pilot Program: What You Are Working With Before Tests Begin
Before getting into test mechanics, it is important to understand the access constraints your creator partners may be operating under. TikTok Shop’s affiliate ecosystem has a structured onboarding layer that directly affects how new or smaller creators can participate in your tests.
The 30-Day Pilot for New Creators
Creators with fewer than 5,000 followers who are new to TikTok Shop’s affiliate program are automatically enrolled in a 30-day Creator Pilot Program. During this period, they face meaningful restrictions: up to three shoppable product videos per day, up to three shoppable LIVE sessions per week, and access limited to products from shops with a performance score of 95% or higher. Pilot creators are also ineligible to join promotional campaigns.
For sellers running structured tests, this has a few practical implications. First, if you are recruiting new micro-creators, check their affiliate status before sending samples. A creator who has not yet completed their pilot period cannot generate the posting volume or campaign participation your test may require. Second, the 95%+ performance score requirement means your shop itself needs to maintain high fulfillment and review standards to remain accessible to pilot creators — not just graduated ones.
The Follower Threshold Reality
Creators need a minimum of 1,000 followers to self-apply for TikTok Shop’s affiliate program, and certain marketplace features require 5,000 followers. The practical effect of this is that the micro-creator tier you can effectively test with sits between roughly 5,000 and 50,000 followers — large enough to have cleared pilot restrictions, small enough to still have the engaged, niche audiences that tend to produce strong commercial conversion.
TikTok also introduced broader daily posting caps across the U.S. market effective May 2026, setting platform-wide limits of 30 shoppable short videos per day and 60 shoppable photo posts per day for any single creator or merchant. These caps are high enough that they should not constrain most structured tests, but they are worth knowing if you are running high-volume seeding campaigns across dozens of creators simultaneously.
Sample Program Mechanics
The free sample program — which is the primary tool for seeding creators before a test window opens — has its own structure. Creators who have generated sales in the last 120 days qualify for free samples. Those without recent sales can access refundable samples instead, which are available to a broader set of creators. The catch is that creators must publish qualifying shoppable content within 14 days of receiving a sample.
That 14-day content deadline and your 72-hour performance measurement window are two different clocks. The 72 hours you care about starts when the creator posts, not when you ship the sample. Build enough lead time into your seeding logistics so that creator content is live in a coordinated burst rather than trickling in over three weeks.
Product Selection: The Test You Have to Run Before the Test
The single most common reason TikTok Shop creator tests fail is not bad content, weak creators, or poor targeting. It is wrong product selection. Sellers consistently choose products they believe will go viral — items with strong visual appeal, trend adjacency, or personal conviction — rather than products with validated commercial signals on the platform. These are genuinely different criteria, and conflating them is expensive.
What Makes a Product TikTok Shop-Ready
A product that performs well in creator tests shares a specific set of characteristics. It solves a visible, demonstrable problem — one that a creator can show working in under 10 seconds. It has a price point that supports impulse purchase behavior, typically under $50 for first-time buyers. It has enough review volume and a high enough average rating that product page conversion is strong once you drive traffic there. And critically, it has a commission structure high enough to attract creators who will genuinely push it.
Products that look visually interesting but require complex explanation, that have high return rates, or that sit in saturated categories where dozens of other creators are already posting similar content face structural headwinds in tests. No amount of creator talent compensates for a product that does not fit TikTok Shop’s discovery-to-purchase mechanics.
Using TikTok’s Own Data for Pre-Test Validation
Before seeding a single creator, use TikTok’s Product Marketplace and Creative Center to check whether the product category is experiencing active creator adoption. Look at how many creator videos have been posted in the last 30 days for similar products. Check whether the category shows rising search volume or whether it is already oversaturated. The Creative Center’s trend data can surface whether a hook style or product angle is gaining or losing momentum — information that should inform your test setup, not just your creative direction.
The VoC Index — TikTok Shop’s Voice of Customer scoring system — is also worth monitoring before you begin. Products flagged with poor VoC scores for quality or accuracy issues will face algorithmic suppression regardless of how good your creator content is. Launching a test against a product with quality signal problems is burning samples and creator relationships on a setup that is already compromised.
Your Portfolio Split During Testing
Experienced TikTok Shop operators tend to maintain a deliberate portfolio structure: roughly 70 to 80 percent of creator resources go toward proven hero products with established sales velocity, 10 to 20 percent toward active test items in the current 72-hour window, and 10 to 20 percent toward traffic-driving loss leaders that pull new buyers into the shop. Tests compete for budget and samples against active revenue generators, so being deliberate about what proportion of your capacity you are committing to experiments matters.
Creator Matching for Conversion, Not Reach
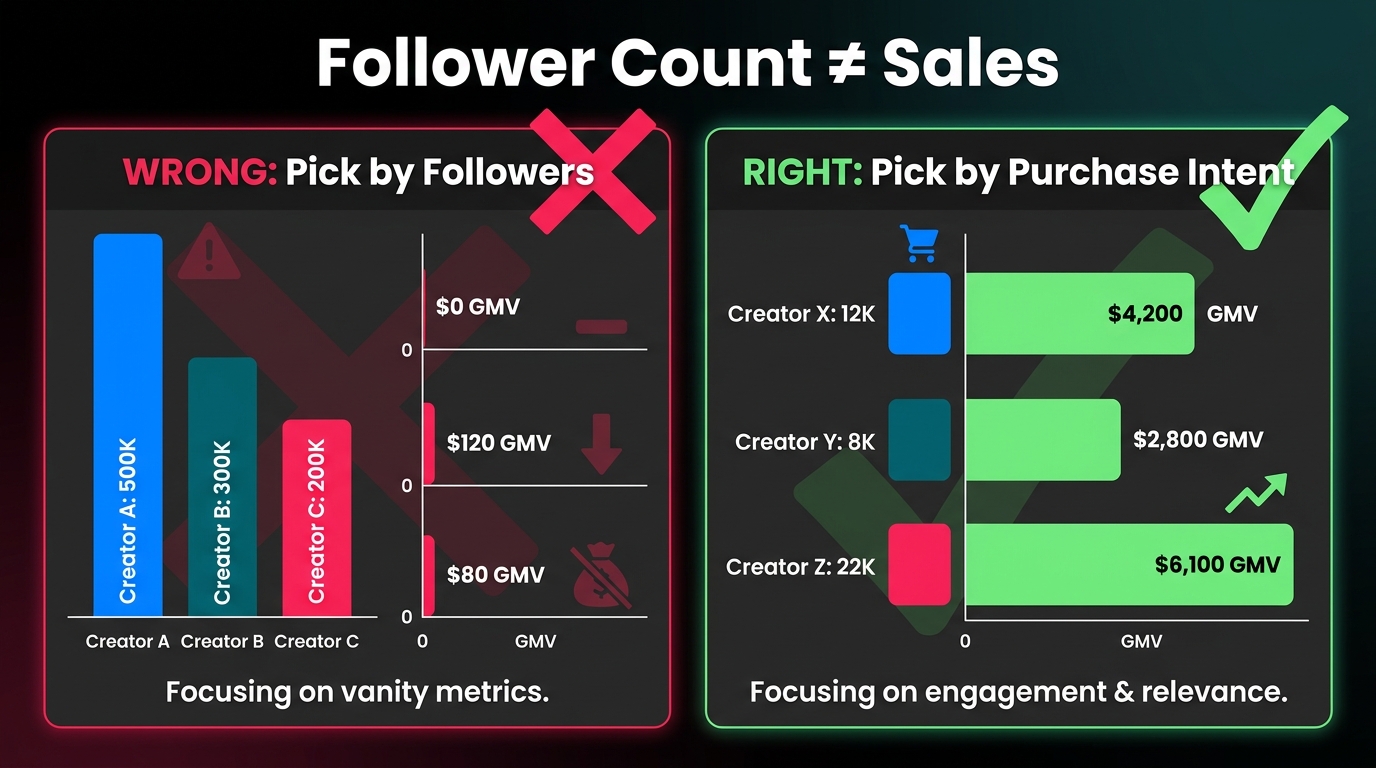
If you are selecting creators by follower count, you are optimizing for the wrong variable. Follower count correlates loosely with reach, but it correlates very weakly with TikTok Shop purchase behavior. The mechanics of why this is true matter: a creator with 500,000 followers who built their audience around entertainment content may have a very low percentage of followers who are in active buying mode. A creator with 15,000 followers who built their audience specifically around product reviews, haul content, or category-specific discovery content may have a dramatically higher proportion of followers who click, add to cart, and buy.
The Signals That Actually Predict Commercial Performance
When evaluating creators for a test window, look at their existing TikTok Shop content history first. Have they driven verified sales before? What product categories have they converted in? What does their affiliate performance dashboard show in terms of items sold and GMV per post? A creator with a track record of modest but consistent sales in your category is far more valuable than a high-follower creator with no commerce history.
Engagement quality also matters more than engagement quantity. A creator whose comment section is full of genuine purchase questions — “where can I buy this?” “does it come in blue?” “how long does delivery take?” — is signaling a commercially primed audience. A creator with identical engagement rates but generic complimentary comments has a very different audience behavior profile.
Category Fit Is Non-Negotiable
A creator who successfully drove sales for kitchen gadgets has audience affinity with buyers in that category. Pivoting that same creator to promote supplements or fashion items will almost certainly underperform, not because the creator is less talented but because their audience’s purchase behavior does not transfer cleanly across categories. Keep your creator-product matching tight. The test window is 72 hours. You do not have time to teach a creator’s audience to care about a new product category from scratch.
Testing Multiple Creator Archetypes
Within a single product test, run at least three to five creators simultaneously and ensure they represent different archetypes: a niche expert in the category, a lifestyle creator with category adjacency, and a deal-focused or haul-style creator. These archetypes perform differently for different product types. A problem-solving tech product often converts best with demonstrators who show the product in use. A beauty product often converts best with a lifestyle creator whose audience trusts their aesthetic judgment. A competitively-priced household item often converts best with a deal-focused creator whose audience skews deal-hunters.
Running multiple archetypes in the same test window gives you signal not just about whether the product converts but about which angle and audience type produces the strongest commercial response — intelligence that shapes your paid amplification decisions after hour 72.
The 72-Hour Countdown: What to Do at Each Stage
The framework only delivers value if you are actively managing it. A 72-hour test window is not a passive observation period — it is an active monitoring and decision-making process with specific actions at each stage.
Before Launch: Coordinated Posting, Not Staggered Drift
One of the most consistent mistakes sellers make with creator tests is allowing posts to go live on a creator’s own schedule, which typically means a spread of two to three weeks as creators find time to film, edit, and post. By the time the last creator posts, the first creator’s content is already out of its organic distribution window. You cannot compare performance across assets that were posted at different times, in different competitive contexts, potentially at different price points if a promotion was running.
Coordinate your creator cohort to post within a 24 to 48-hour window. This is harder to organize than it sounds — it requires strong briefing, advance sample delivery, and clear communication about posting timelines. But it is essential for generating comparable data within the test window and for creating the burst of content volume that tends to amplify algorithmic attention.
Hours 0–6: Establish Your Baseline
In the first six hours, you are establishing baseline signals. Open TikTok Shop’s Creator Analytics for each participating creator (if they grant access) or rely on your affiliate dashboard’s GMV and click attribution data. Note the initial product click rate and any early orders. Do not draw conclusions yet — this is too early to judge. What you are doing is confirming that the posts are live, that product links are functioning, and that you have a baseline read for each asset going into the next phase.
Hours 6–24: Watch the Commerce Signals
The six-to-24-hour window is where the first meaningful signals emerge. Pay attention to product CTR — the percentage of viewers who tap the product card. A strong early CTR suggests the content is generating genuine purchase intent. Watch for add-to-cart activity and any first purchases. A video that generates five to ten orders in its first 24 hours with a small initial reach is significantly more promising than a video generating 50,000 views and zero orders.
This is also the window in which you should check whether any content is unexpectedly outperforming. A creator you thought was a middle-of-the-pack pick might show remarkably strong early commerce signals. Note it. You will want to be ready to amplify that asset faster than originally planned.
Hours 24–48: The Acceleration Phase
If a video has strong Phase Two signals, you should be seeing organic reach begin to expand meaningfully. Watch whether the algorithm is distributing the content beyond the creator’s immediate follower base. The For You page distribution signal is visible in the reach breakdown within TikTok analytics — a video where more than 50 percent of views are coming from the For You page versus followers is getting meaningful algorithmic distribution.
This is also the window where an early winner can be amplified with Spark Ads to accelerate its momentum. The standard playbook is to avoid spending on Spark Ads until you have at least 24 hours of organic signal — you want to be boosting proven content, not gambling on an unproven one. But if you have a clear winner at hour 24, there is a strong case for beginning low-budget Spark Ads ($50 to $150 per day) to keep the content visible as organic distribution builds.
Hours 48–72: The Final Read
By hour 48, most videos have generated enough data to form a directional verdict. The window from 48 to 72 hours is where you confirm that verdict, accumulate enough orders for statistical confidence, and prepare your scaling or cutting decisions. A product that has generated over 15 orders and shows consistent commerce signals at hour 48 is almost certainly a winner worth scaling. A product with strong views but zero or minimal purchase activity at hour 48 is displaying a clear signal that the content-product fit is not generating buying behavior — regardless of how aesthetically strong the video is.
The Five Metrics That Actually Predict a Winner
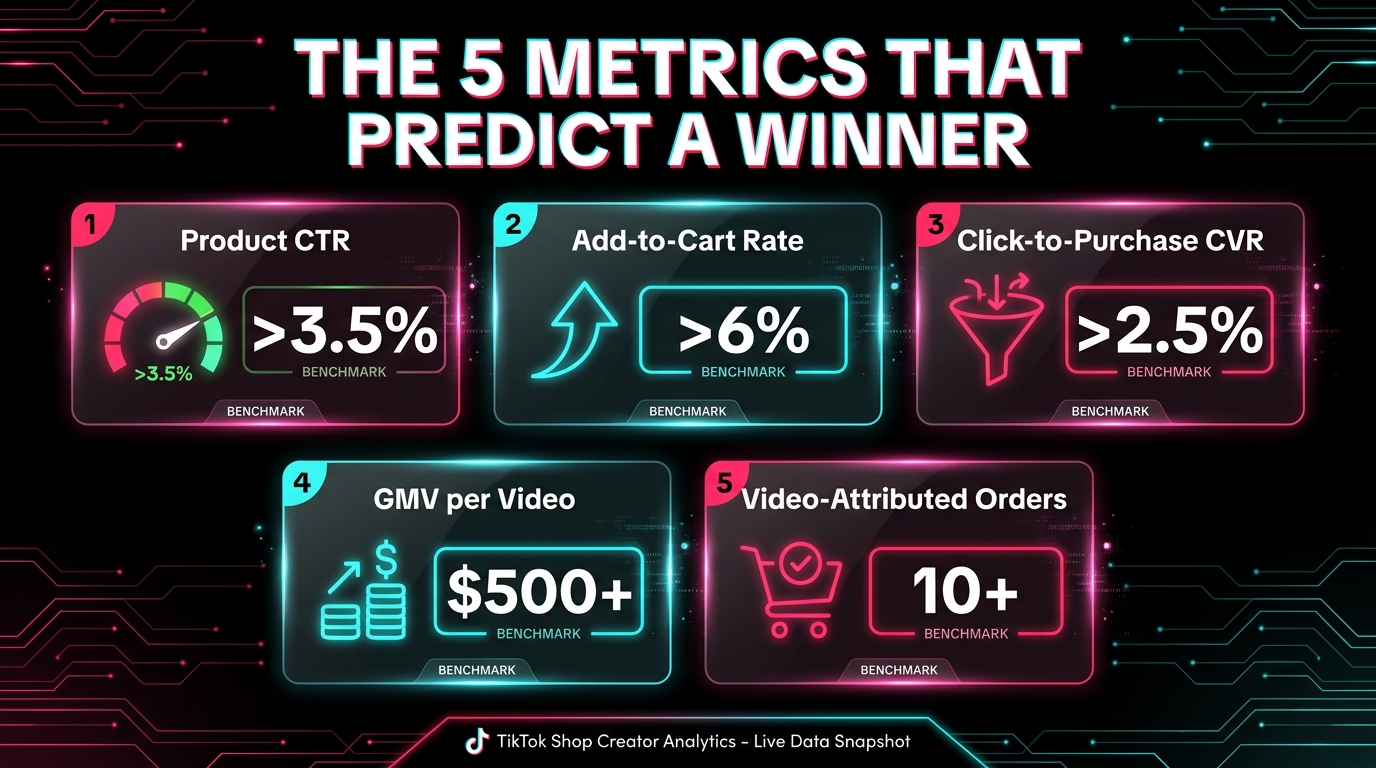
Views are not a metric. Follower growth from a video is not a metric. Brand awareness lift is not something you can reliably measure in 72 hours. What matters in a creator test window is a specific set of commerce-intent signals that indicate whether a video is capable of driving purchase behavior at scale. Here are the five that operators consistently track.
1. Product Click-Through Rate (CTR)
Product CTR measures the percentage of people who watched the video and then tapped the product card. It is the most direct signal of whether the content is connecting the viewer to a purchase consideration. Industry benchmarks for affiliate creator content sit around 3 to 5 percent for videos that convert well. A product CTR below 1.5 percent suggests either the product card placement is weak, the hook is not creating enough purchase intent, or the creator’s audience lacks commercial intent for this product category. A CTR above 4 percent is a strong signal that the content is generating real interest.
2. Add-to-Cart Rate
Add-to-cart rate measures the percentage of product page visitors who add the item to their cart. This metric tells you about product page performance once the creator has successfully delivered traffic. If your CTR is high but your ATC rate is low, the problem may not be the creator’s content at all — it may be your product listing, price point, or review quality. Conversely, a high ATC rate validates that the product page is working and that the traffic quality is good. Benchmark targets typically sit above 6 percent for strong-performing products in competitive categories.
3. Click-to-Purchase Conversion Rate (CVR)
CVR measures the percentage of product page visitors who complete a purchase. This is the most comprehensive signal of total funnel health — from creator content through product page through checkout. Affiliate creator content on TikTok Shop currently benchmarks at approximately 3.2 percent CVR across categories, versus roughly 1.8 percent for seller-owned organic content and 7.8 percent for LIVE shopping sessions. A creator test that produces a CVR above 3 percent is performing above average and merits scaling consideration.
4. GMV Per Video
Gross Merchandise Value per video is the single most decision-relevant metric in a creator test. It collapses the entire funnel — reach, CTR, ATC, CVR — into one number that tells you the commercial output of each asset. A video generating $500 or more in GMV within 72 hours from an organic posting with limited reach is a strong candidate for paid amplification. A video generating $50 from the same reach is not. Most experienced operators set a GMV-per-video threshold as their primary scaling trigger and treat all other metrics as diagnostic signals that explain why a video did or did not hit that threshold.
5. Video-Attributed Orders
Raw order count, though less nuanced than GMV, is important for volume validation. A video driving 10 or more orders within 72 hours from organic distribution has demonstrated enough purchase events to be statistically meaningful. It also gives you enough transaction data to assess whether there are fulfillment anomalies, refund spikes, or product quality issues that might look fine at the GMV level but represent problems at the unit level. Watch for unusually high cancellation or return rates in your first 72-hour cohort — they are a leading indicator of product quality issues that will compound at scale.
Kill, Iterate, or Scale: The Decision at Hour 72
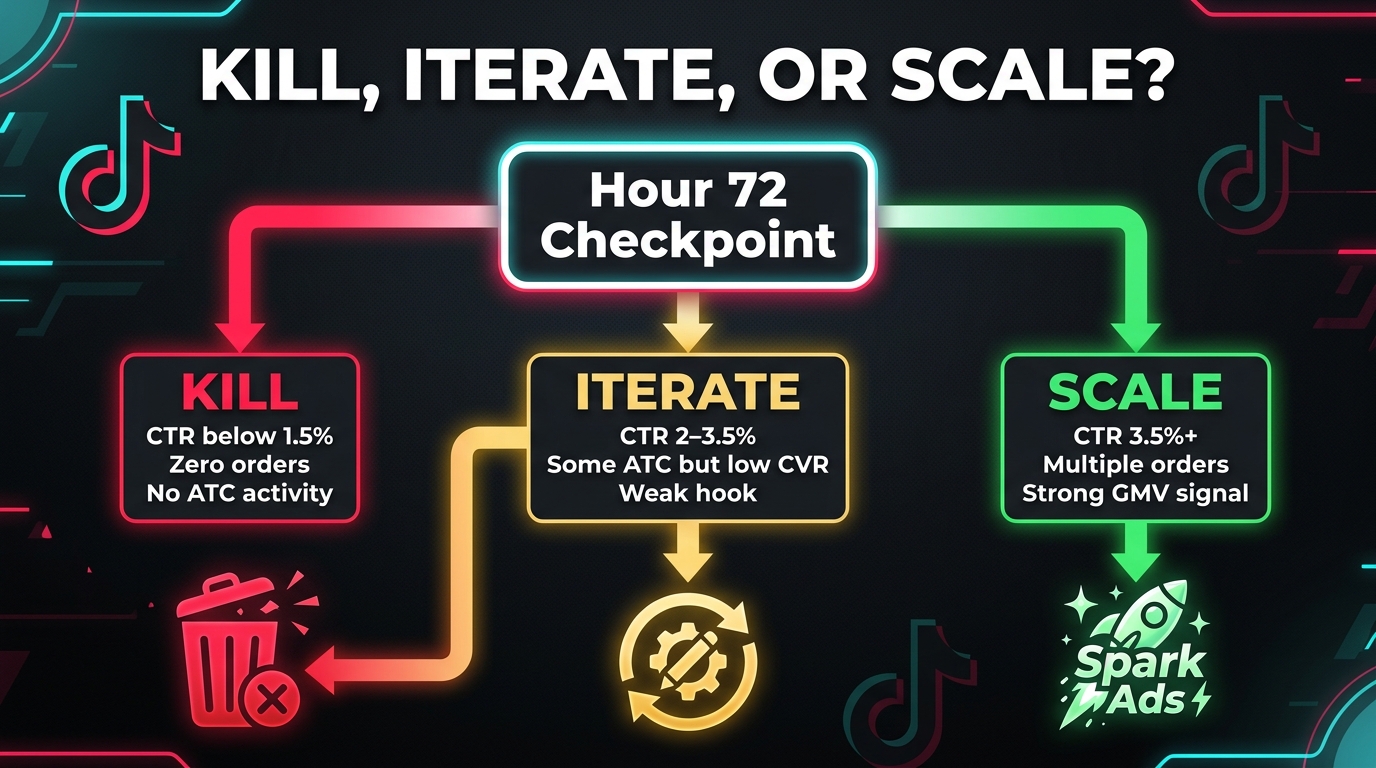
The point of the 72-hour window is to force a decision. Not a hypothesis, not a hope, not a “let’s give it a bit more time.” A clear, data-backed verdict on what to do with each asset. There are exactly three options: kill, iterate, or scale.
Kill: When to Cut Cleanly
Kill the asset when product CTR is below 1.5 percent, orders are fewer than three after 72 hours with reasonable reach, and there is no evidence of meaningful add-to-cart activity. This combination tells you that the content failed at the top of the funnel — viewers were not compelled to engage with the product link. Importantly, this is usually a content-product fit problem, not necessarily a permanent product rejection. The same product might perform differently with a different creator archetype, a different hook, or different creative framing.
Do not let sunk-cost thinking trap you into extending a dead test. The sample cost, the creator relationship investment, the 72 hours of monitoring — none of that compounds into future value if you continue spending on a non-performing asset. Kill it cleanly, log the specific failure mode, and use that insight in your next test iteration.
Iterate: When the Signal Is Mixed
Iterate when you see CTR in the 2 to 3.5 percent range with some add-to-cart activity but low CVR, or when one creator’s content in the test cohort significantly outperformed the others without a clear reason. Mixed signals usually indicate that the product has commercial viability but the content angle, hook, or creator-audience fit is partially miscalibrated. The right response is not to scale the asset as-is but to extract the insight: what did the better-performing creator do differently? What hook structure or product angle drove more CTR? Use that intelligence to brief the next iteration.
An iterate verdict is genuinely valuable. It means you have not validated the product yet, but you have not invalidated it either. A product that shows 2.5 percent CTR and five orders in 72 hours from a mid-tier creator might show 5 percent CTR and 40 orders if you take those learnings and reseed with a tighter creator brief and a refined hook. The test window served its purpose — it told you what needs to change.
Scale: When to Move Immediately
Scale when CTR exceeds 3.5 percent, multiple orders have come through organically, GMV per video has cleared your minimum threshold ($500 is a reasonable baseline for products under $50), and the product page conversion rate is above 2.5 percent. This combination means the entire funnel is working: the content is compelling, the product page is converting, and purchase behavior is real. Move fast.
The window between identifying a winner and amplifying it matters. Early organic momentum compounds with paid amplification in ways that do not hold if you wait a week. The audience signals TikTok’s algorithm has already gathered about who engages with this content are most actionable in the first few days. Sitting on a winner for 72 more hours before triggering Spark Ads means you are paying for distribution that could have benefited from the organic momentum you let decay.
From Organic Winner to Spark Ads and GMV Max
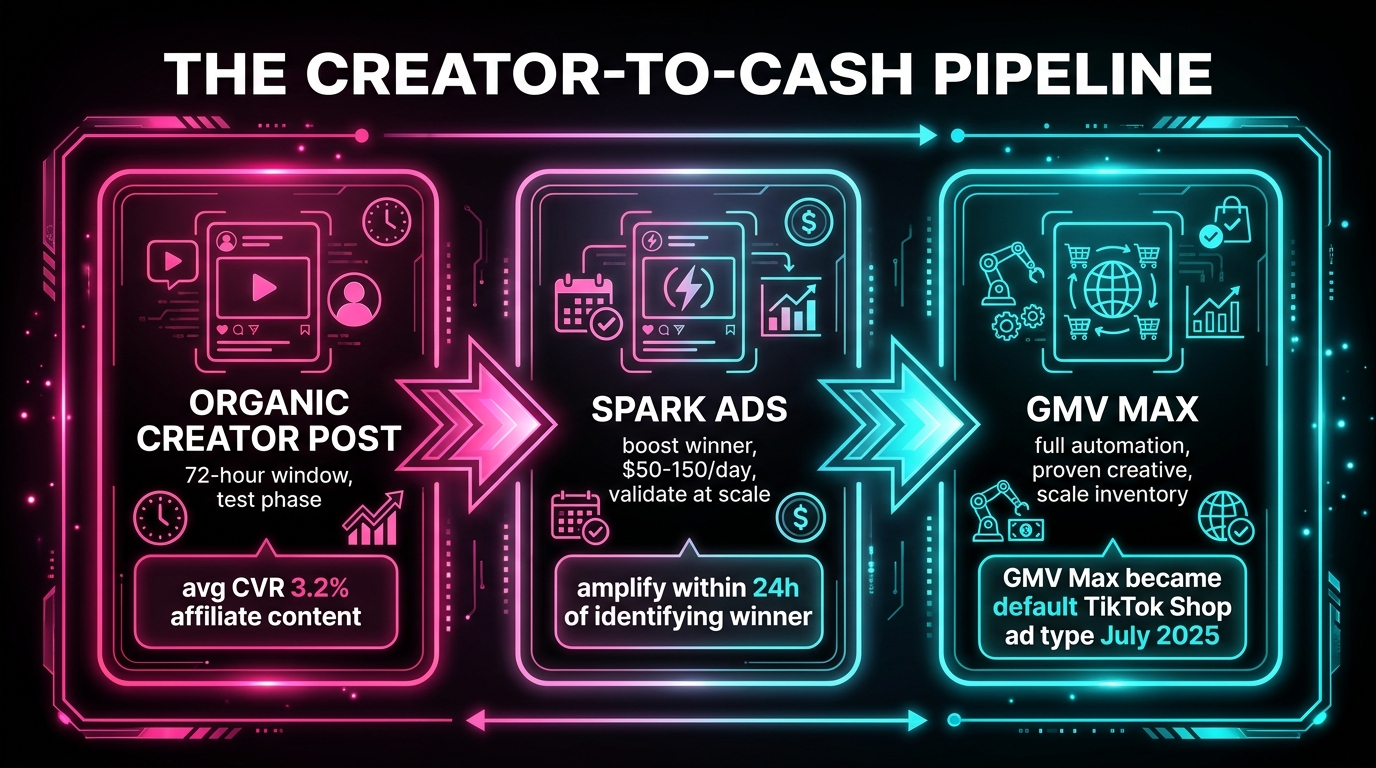
The paid amplification sequence after a 72-hour win is not complicated, but it has a specific order that matters. Collapsing this sequence or skipping steps produces predictably worse results than following it.
Step One: Spark Ads as the Creative Validation Layer
Spark Ads allow you to run paid distribution on an existing organic creator post, with the creator’s handle and organic engagement intact. This is important for two reasons. First, it preserves the social proof that has accumulated on the post — the likes, comments, and shares that signal authenticity to new viewers. Running a Spark Ad on a post with 200 comments and 1,200 likes performs differently than running a white-label ad creative with zero organic history. Second, Spark Ads funnel engagement back to the original post, so organic and paid performance compound in the same place rather than fragmenting.
Start Spark Ads on a winning creator post at $50 to $150 per day, targeting audiences similar to the post’s organic viewers. Run this for three to five days. During this period, you are not yet scaling aggressively — you are confirming that the commercial performance you saw in organic distribution holds under paid conditions. Most of the time it does, because you have already filtered for genuine purchase intent. Occasionally it does not, usually because the organic audience was unusually niche and does not generalize well. Either way, the Spark Ad phase tells you before you commit significant budget.
Step Two: GMV Max as the Scaling Layer
GMV Max became TikTok Shop’s default and effectively only supported campaign type for Shop Ads starting in mid-2025. It is a fully automated campaign format that allocates budget across all available inventory — in-feed ads, product detail page placements, LIVE shopping ads — using TikTok’s machine learning to maximize GMV output. It is powerful, but it requires clean creative inputs to function well.
The operational logic for feeding a proven creator asset into GMV Max is straightforward: you are giving TikTok’s automation system a high-quality, already-validated piece of creative and asking it to find more buyers who look like the people who already purchased. Because GMV Max has seen the organic and Spark Ads performance history on this asset, it enters the learning phase with better signal than it would have from a cold creative. This is why the sequence matters — you are not guessing which creative GMV Max should optimize; you are telling it with evidence.
Inventory: The Bottleneck That Kills Winners
The most underappreciated failure mode in the amplification sequence is running out of stock. A creator test that performs well, transitions into successful Spark Ads, and then enters GMV Max at scale can generate orders faster than a poorly prepared seller can fulfill them. Stock-outs in the middle of algorithmic momentum are not just a missed revenue opportunity — they can trigger negative reviews, fulfillment score degradation, and product eligibility issues that damage your shop’s standing in the affiliate program.
Before you commit to amplifying a winner, confirm your inventory position can sustain at least two to three weeks of demand at the projected volume. If your test generated 30 orders organically and you are about to add paid budget on top of continued organic distribution, you need stock for hundreds of orders, not dozens. Build this check into your scaling decision process explicitly, not as an afterthought.
The Mistakes That Keep Sellers Stuck
The 72-hour framework is not complicated, but there are recurring patterns of execution failure that prevent sellers from extracting its full value. Most of them come down to the same root cause: treating the test window as a formality rather than an operational discipline.
Judging Creators by Views Instead of Orders
The most pervasive error is continuing to evaluate creator performance by view counts rather than commerce signals. A video with 500,000 views and no orders is a worse commercial result than a video with 8,000 views and 25 orders. The second video found the right audience and converted them. The first found a large audience and did not. On TikTok Shop, size of reach and quality of purchase behavior are only loosely correlated, and optimizing for the wrong signal produces consistently poor resource allocation.
Staggered Posting Timelines
As discussed earlier, letting creator posts trickle out over two to three weeks destroys the comparability of your test data and eliminates the burst effect that concentrated posting creates. This is a logistics problem masquerading as a strategy problem. The fix is earlier sample delivery, clearer briefing deadlines, and direct communication with creators about posting windows. Build a one-week lead time from sample delivery to posting expectation, and build two days of posting window into your coordination brief.
Seeding Without a Performance Threshold
Many sellers seed creators with no explicit metric threshold that would trigger amplification or termination. They observe the data, feel generally positive or negative about it, and make intuitive calls. This is not a system — it is ad hoc decision-making dressed up as a test. Define your kill, iterate, and scale thresholds before the first sample ships. If you do not set the threshold in advance, you will rationalize low-performing assets and hesitate on clear winners. The thresholds force discipline.
Testing Saturated Products
Launching a creator test on a product that already has hundreds of creators posting about it in your category is not product testing — it is joining a crowded pool and hoping to stand out. In heavily saturated categories, content fatigue is real: the same product, the same hook, the same “you have to try this” format has already appeared thousands of times in that audience’s For You page. The creative bar is higher, the differentiation requirement is steeper, and the marginal cost of winning a test is much greater. Use the Creative Center to check saturation levels before you build a test around a product.
Ignoring Post Rate as a Leading Indicator
Post rate — the percentage of seeded creators who actually post content — is a leading indicator of campaign health that many sellers overlook until it is too late. Industry benchmarks suggest a 20 to 30 percent post rate is typical for cold outreach, while well-run programs with strong product-creator fit reach 40 to 60 percent. If only two of your ten seeded creators post within the agreed window, you do not have a 72-hour test — you have a very small sample that cannot produce reliable signal. Monitor post rate aggressively in the first 48 hours after samples are delivered, and follow up proactively with creators who have not confirmed their posting timeline.
Real Numbers: What Structured Testing Actually Delivers
Abstract frameworks are useful. Concrete numbers are more useful. The data below reflects documented outcomes from structured TikTok Shop creator seeding and testing programs, and it illustrates the delta between ad hoc seeding and systematic, test-window-driven approaches.
The MomentIQ Seeding Case
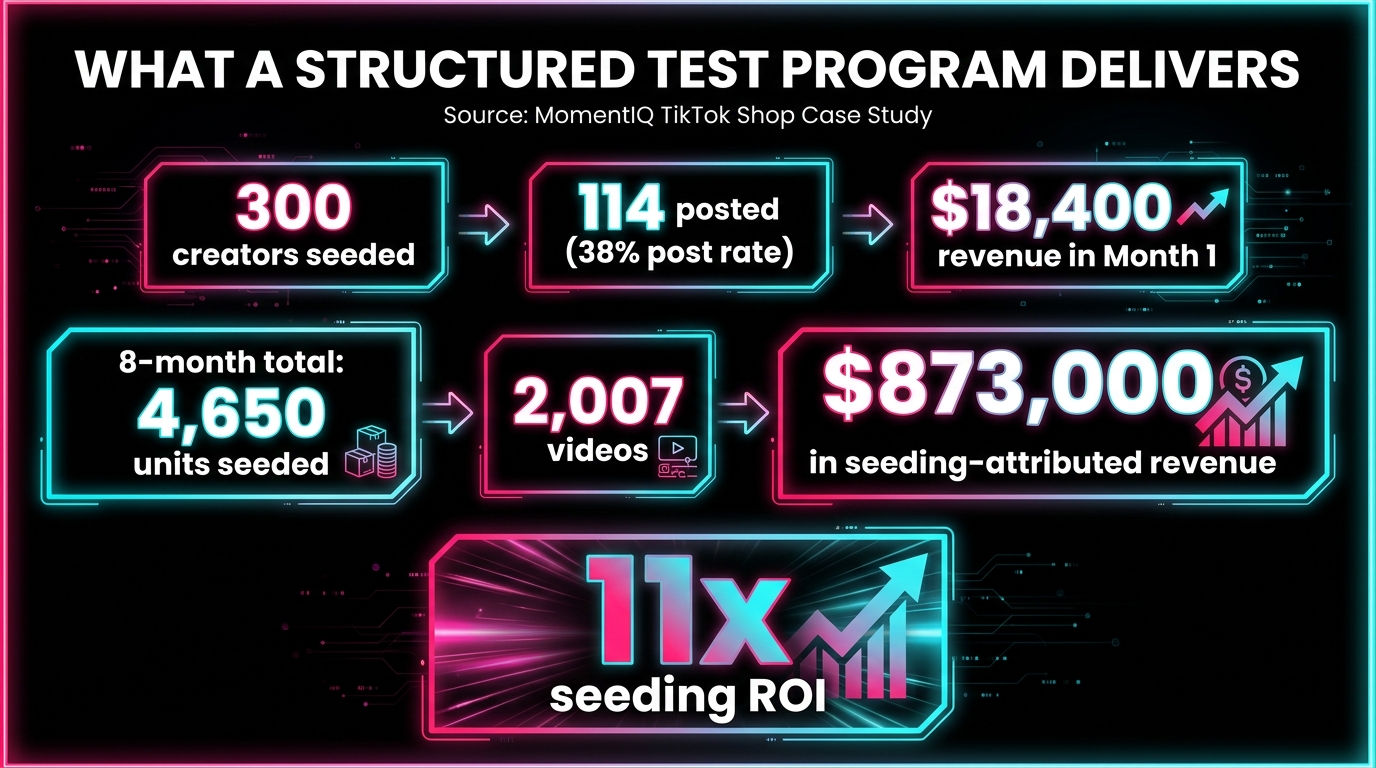
Creator commerce agency MomentIQ documented a TikTok Shop seeding program in which 300 creators were seeded in month one. Of those, 114 creators — a 38 percent post rate — published content, generating 147 videos, $18,400 in revenue, and a total seeding investment of $2,760. Across eight months, the program seeded 4,650 units, produced 2,007 creator videos, and generated $873,000 in seeding-attributed revenue at an 11x return on the seeding investment.
The critical factor that produced these results was not scale alone — it was the systematic filtering applied at each test cycle. Poor-performing creators were not re-seeded. Products that generated weak post rates or low GMV per video were rotated out. Creator archetypes and content angles that performed above average were identified and over-indexed in subsequent waves. The 72-hour decision framework is what enabled this continuous improvement loop.
The 60-Day High-Velocity Launch Case
A separate case study from TikTok Shop operator guidance documented a 60-day launch program that seeded 50 to 100 creators, tested multiple content angles across a 14-day window, and then scaled winning hooks into paid and affiliate channels. Results: $112,000 in TikTok Shop revenue, a blended ROAS above 3x, and more than 280 creator videos live. The key enabler was the 14-day multi-creator posting window that compressed testing enough to generate comparative data — and the decision discipline to scale only the winning angles into paid media, not the full cohort.
Conversion Rate Benchmarks in Context
Across the TikTok Shop ecosystem, affiliate creator content currently benchmarks at approximately 3.2 percent CVR, compared with about 1.8 percent for seller-owned organic content and 7.8 percent for LIVE shopping sessions. These benchmarks exist at the category level; individual products in high-intent categories like health, beauty, and home can consistently exceed them. The important insight from these numbers is that properly selected creator content significantly outperforms seller content alone, and that LIVE shopping — which operates on a different set of dynamics — occupies a separate tier that is most effectively fed by validated products and creator relationships that the test window framework helps you identify.
Building the Test Window Into a Repeatable System
Running one 72-hour creator test and treating it as a complete strategy is like running one A/B test and calling your product optimized. The value of the framework multiplies with repetition. Each test cycle generates intelligence that improves the next one: better product selection criteria, refined creator archetypes, sharper hook briefs, tighter metric thresholds, and growing lists of proven creator partners who have demonstrated commercial conversion in your category.
The Cadence That Creates Compounding Returns
Most sellers who have operationalized the 72-hour window run one to two structured test cohorts per month. This cadence is manageable from a logistics standpoint — sample sourcing, creator outreach, briefing, and result analysis can all be done within a monthly operational cycle without overwhelming the team. It also creates a portfolio of tested creator-product combinations that grows over time. By month six, you are not running a single test; you are running a mature program with a bench of proven creators, validated product angles, and a library of high-converting assets ready for paid amplification.
Creator Relationship Management as Infrastructure
Creators who perform well in your test window should be treated as long-term commercial partners, not one-time campaign participants. Provide clear performance feedback after each test. Re-engage top performers with early access to new products before they hit the general affiliate marketplace. Offer increased commission rates for creators whose content consistently clears your performance thresholds. This preferential treatment builds a creator bench that is genuinely invested in your product’s success — and in subsequent tests, they post faster, more authentically, and to better commercial effect.
Analytics Infrastructure: What to Build
The 72-hour framework requires a tracking infrastructure that most sellers have not fully built. At minimum, you need a shared tracking sheet that captures, for each creator in each test cohort: post date and time, product CTR at 24 hours, product CTR at 72 hours, add-to-cart count, orders placed, GMV attributed, and the decision made (kill, iterate, scale). Over time, this dataset reveals patterns — which product categories produce the highest GMV-per-video, which creator follower tiers convert best in your niche, which hook formats consistently drive CTR above your threshold.
Some larger operators build this into formal reporting dashboards connected to TikTok Shop’s API. For most sellers, a well-maintained spreadsheet is sufficient. The discipline of tracking is more important than the sophistication of the tool.
Connecting Test Results to Product Development
A mature test window program generates product insight as a byproduct of performance data. If a product consistently drives strong CTR but poor CVR, the problem is almost certainly product page quality — review count, image quality, price positioning, or listing copy. If a product drives strong CVR but low CTR across multiple creator types and content angles, the product itself may be right but the visual storytelling is the bottleneck. If a product consistently generates strong performance in the test window but produces high return rates within 30 days, there is a quality or expectation-gap problem that affects the product’s long-term eligibility in the affiliate program.
These insights, gathered systematically across multiple test cycles, become input into product selection, listing optimization, and sourcing decisions — not just marketing decisions. That cross-functional feedback loop is what separates sellers who treat the test window as a marketing tactic from those who treat it as a commercial intelligence system.
Conclusion: The Framework Behind the Framework
The 72-hour creator test window is not magic, and it is not complicated. It is an operational framework built on a simple insight: TikTok Shop’s distribution mechanics concentrate most of a video’s commercial potential into the first three days, which means that window is the right unit of analysis for deciding which creator-product combinations merit scale investment and which do not.
What makes the framework valuable is not the number 72. It is the discipline of making a decision at the end of it. Most TikTok Shop sellers do not lack data — TikTok provides substantial analytics. They lack the decision rules and the operational cadence to turn that data into action on a consistent basis. The test window framework provides both.
The sellers who are consistently scaling on TikTok Shop in 2026 are not necessarily the ones with the best creative instincts or the largest creator budgets. They are the ones who run more tests per month than their competitors, filter results by the right metrics rather than vanity signals, amplify winners faster, and kill losing assets without hesitation. That operating discipline, applied systematically across product selection, creator matching, performance measurement, and paid amplification, is what the 72-hour framework exists to support.
Start with the basics: define your kill, iterate, and scale thresholds before the first sample ships. Coordinate your posting window so your test cohort goes live within 24 to 48 hours of each other. Track GMV per video as your primary decision metric. And at hour 72, make the call.
Key Takeaways
- TikTok Shop’s content distribution cycles through three phases in the first 72 hours — follower testing, interest graph expansion, and broad push — and early commerce signals determine whether Phase 3 happens at all.
- The Creator Pilot Program restricts new creators (under 5,000 followers) to 3 shoppable videos per day and access only to shops with 95%+ performance scores. Vet creator eligibility before sending samples.
- Product selection is the most consequential pre-test decision. Validate demand, check VoC Index scores, and confirm category saturation before building a creator test around a product.
- Match creators by purchase intent and category fit, not follower count. A 15,000-follower creator with a proven commerce history in your niche will almost always outperform a 500,000-follower creator with no TikTok Shop track record.
- Track five metrics in the test window: product CTR, add-to-cart rate, CVR, GMV per video, and video-attributed orders. Views are not a metric.
- Make a kill, iterate, or scale decision at hour 72 using predefined thresholds. CTR above 3.5%, CVR above 2.5%, and GMV per video above $500 are reasonable scale triggers for sub-$50 products.
- The amplification sequence is: organic winner → Spark Ads validation ($50–$150/day) → GMV Max scaling. Respect the order. Do not feed unproven creative into GMV Max cold.
- Build the test window into a monthly cadence. The compounding value comes from learning across cycles, not from any single test result.