
There’s a moment every ambitious business owner hits — revenue is climbing, orders are flowing, and the instinct screams: scale it. Hire more people. Spend more on ads. Open another channel. Push inventory harder. The logic feels airtight: if we’re doing well at this size, we’ll do even better at twice the size.
That logic has ended more businesses than bad products ever did.
The brutal truth is that most companies that scale prematurely don’t fail because their product is wrong or their market is too small. They fail because they never actually knew what their profit looked like at the unit level. They were running on revenue signals, not profit signals. And when you pour capital into a machine you don’t fully understand, you don’t grow faster — you just lose money faster.
Profit visibility isn’t a finance department concept. It’s a survival skill. It’s the difference between scaling a genuinely profitable operation and scaling a leaky bucket — where every new dollar in only adds pressure to the drain at the bottom.
This article isn’t about basic bookkeeping. It’s about the specific financial diagnostics that tell you, with clarity, whether you’re actually ready to grow — and what to fix if you’re not. The frameworks here apply whether you’re running a product business, a service operation, an e-commerce brand, or a SaaS model. The numbers change. The principles don’t.
Let’s start with the metric almost every business owner tracks — and why it’s not the one that matters.
Revenue Is Not Profit: Why the Number You Watch Is the Wrong One
Revenue is seductive. It’s big. It’s clean. It shows up prominently in dashboards, in pitch decks, and in casual conversations when someone asks how the business is doing. “We did $2 million last year” lands differently than “We did $2 million and kept about $80,000 of it.”
But that second framing is often closer to the truth — and it’s the truth that matters.
The Revenue-Profit Confusion in Practice
The confusion between revenue and profit isn’t just a conceptual error. It drives real operational decisions that compound damage over time. A business owner who believes their $500K monthly revenue signals health will logically spend to protect and grow that number. They’ll run promotions to hit a revenue target. They’ll accept low-margin orders to fill capacity. They’ll hire sales staff to drive volume. All of those decisions make sense if revenue equals health — and all of them can be actively destructive if the underlying margins don’t support the cost structure.
Consider a straightforward example: a direct-to-consumer brand selling a $60 skincare product. Revenue at 1,000 units per month is $60,000 — a number that sounds like traction. But subtract cost of goods ($18), shipping ($7), platform fees ($3), return-related costs ($4), and a blended ad spend-per-order of $22, and the contribution per unit is $6. The business is generating $6,000 per month in actual contribution to fixed costs. If fixed costs (rent, software, salaries, insurance) run $9,000 per month, this business is losing money on every month it operates — while showing $60,000 in revenue.
Scaling that operation means spending more money to lose more money at speed. The revenue number actively obscures the problem.
The Vanity Metric Trap
Business research consistently identifies revenue fixation as one of the most common scaling mistakes founders make. A 2014 recruitment platform case became something of a cautionary legend in startup circles: the company grew to 33 million daily active users and raised $49 million in funding by optimizing for a single growth metric. Leadership was praised. Investors were enthusiastic. The business collapsed. Behind the headline number, user churn was catastrophic, unit economics were negative, and the product had no sustainable path to profitability.
The lesson isn’t just about startups. Any business that uses revenue as its primary health indicator is operating with incomplete information — and incomplete information becomes dangerous when you start deploying capital for growth.
What to Track Instead
Revenue belongs in your dashboard. It’s not irrelevant. But it needs to sit alongside gross profit, contribution margin, and net operating income — with the relationships between those numbers visible and understood. When revenue grows and margin percentage drops, that’s a warning. When revenue grows and contribution per unit compresses, you’re scaling a problem, not an advantage.
The shift from revenue-first thinking to profit-first thinking is the foundational change required before any scaling conversation becomes responsible.
The Five Layers of a Real Cost Structure
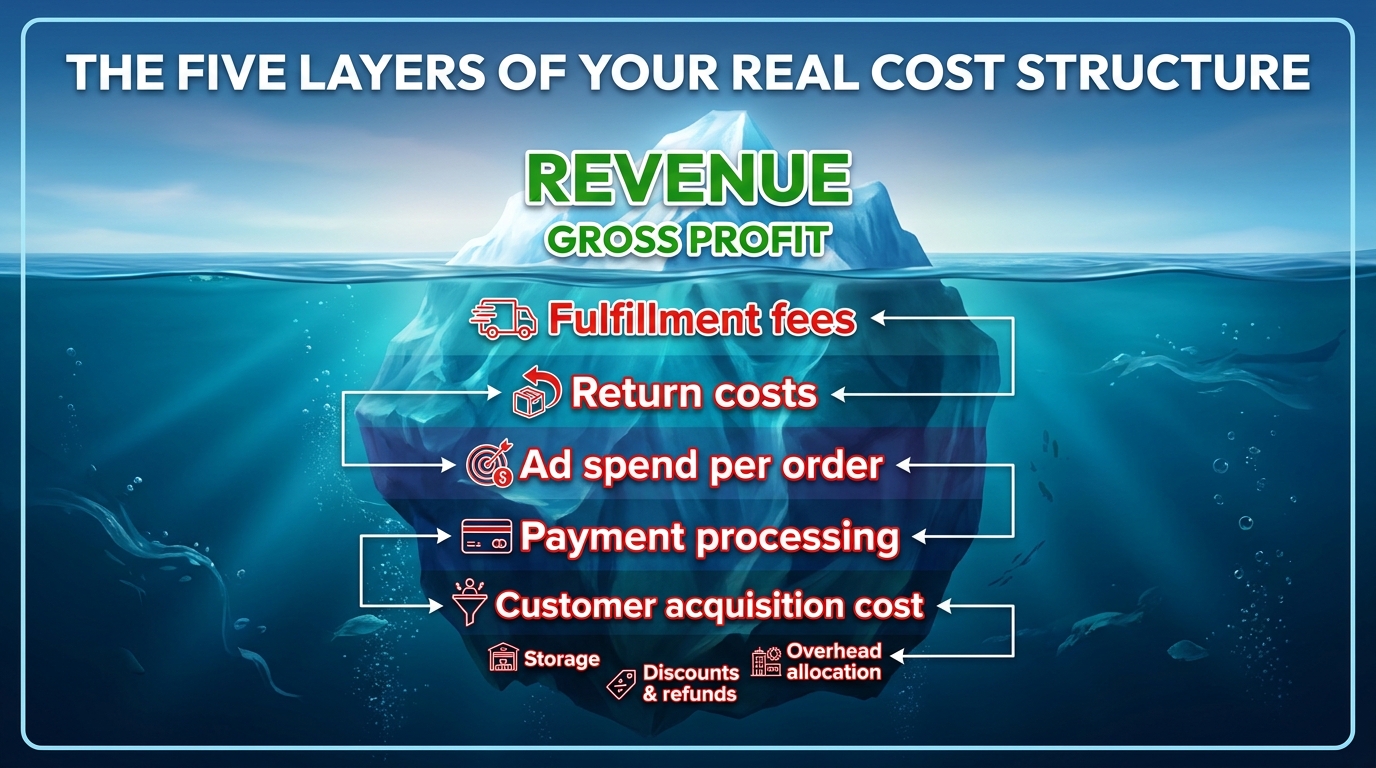
Most businesses have a reasonable handle on their top-line costs — the obvious ones that appear on invoices and show up in the cost of goods sold line. What creates blind spots is the layer of costs that exist below gross profit but above net profit — the variable expenses that scale directly with revenue growth and quietly consume margin as you grow.
Think of your cost structure as an iceberg. Gross profit shows you what’s above the waterline. The real danger is what’s beneath.
Layer 1: Cost of Goods Sold (COGS)
This is the starting point — raw materials, manufacturing, or wholesale purchase price. Most business owners track COGS reasonably well because it appears directly on the profit and loss statement. What gets missed here is landed cost accuracy: the true cost of a product delivered to your facility, including inbound shipping, customs duties, inspection fees, and supplier minimum order premiums. A product that costs $12 to manufacture might have a landed cost of $16.50 once you account for freight, tariffs, and quality control. That $4.50 delta across 10,000 units annually is $45,000 in untracked cost.
Layer 2: Fulfillment and Logistics
Pick, pack, and ship costs are frequently underestimated, particularly in e-commerce. Third-party logistics (3PL) fees range from $3 to $12 per unit depending on product size, weight, and service level. Storage fees compound with slow-moving inventory. Carrier surcharges — residential delivery, fuel adjustments, dimensional weight pricing — add costs that don’t appear in the base shipping rate. These costs scale with volume, which means they don’t get better as you grow unless you proactively renegotiate at each new tier.
Layer 3: Returns, Refunds, and Chargebacks
E-commerce return rates average 16.9% of gross revenue across categories. Each returned unit carries a double cost: the refund itself, plus the cost to receive, inspect, restock, or dispose of the item. A business with a 20% return rate and a $5 per-unit return processing cost is bleeding margin invisibly. Payment chargebacks add another layer — typically between 0.5% and 1.5% of revenue — and include dispute management overhead that rarely shows up in cost tracking.
Layer 4: Customer Acquisition Cost (CAC)
Marketing spend per customer is one of the most misrepresented figures in business finance. Blended CAC — total marketing spend divided by total new customers — sounds clean but hides channel-level variance that matters enormously for scaling decisions. A Facebook campaign might deliver customers at $12 CAC while a Google Shopping campaign delivers them at $47. Scaling ad spend without knowing channel-level CAC means you may be scaling the expensive channel at the expense of the efficient one.
Additionally, many businesses undercount marketing costs by excluding agency fees, creative production, and software tools. True all-in CAC is almost always higher than the number most businesses report internally.
Layer 5: Overhead Allocation
Fixed costs — salaries, rent, software subscriptions, insurance, professional services — are rarely allocated to individual products, channels, or customer segments. This makes them invisible in unit-level analysis. A business might have excellent product-level contribution margins but an overhead structure that consumes all of that contribution before a dollar of net profit is generated. Understanding the relationship between your total fixed cost base and your total contribution is essential before scaling, because hiring even one additional team member shifts the breakeven calculation in ways that need to be anticipated.
Contribution Margin: The Metric That Actually Tells You If You’re Ready
Gross margin gets most of the attention in financial discussions. It’s the metric investors look at first, the number benchmarked against industry peers, and the figure most prominently featured in financial analyses. But for the purpose of scaling decisions, gross margin is the wrong metric. Contribution margin is the right one.
What Contribution Margin Actually Measures
Gross margin tells you what’s left after subtracting the direct cost of producing or purchasing what you sell. Contribution margin tells you what’s left after subtracting all variable costs — including the shipping, the commissions, the returns, the credit card fees, and the marketing spend that drove the sale in the first place.
The formula is simple: Contribution Margin = Revenue − All Variable Costs
Expressed as a percentage: Contribution Margin Ratio = (Revenue − All Variable Costs) / Revenue × 100
The critical insight is that contribution margin tells you exactly how much each unit of sale contributes to covering your fixed cost base. Once total contribution equals total fixed costs, you’ve hit breakeven. Every dollar of contribution above that point is net profit.
Why Gross Margin Misleads Scaling Decisions
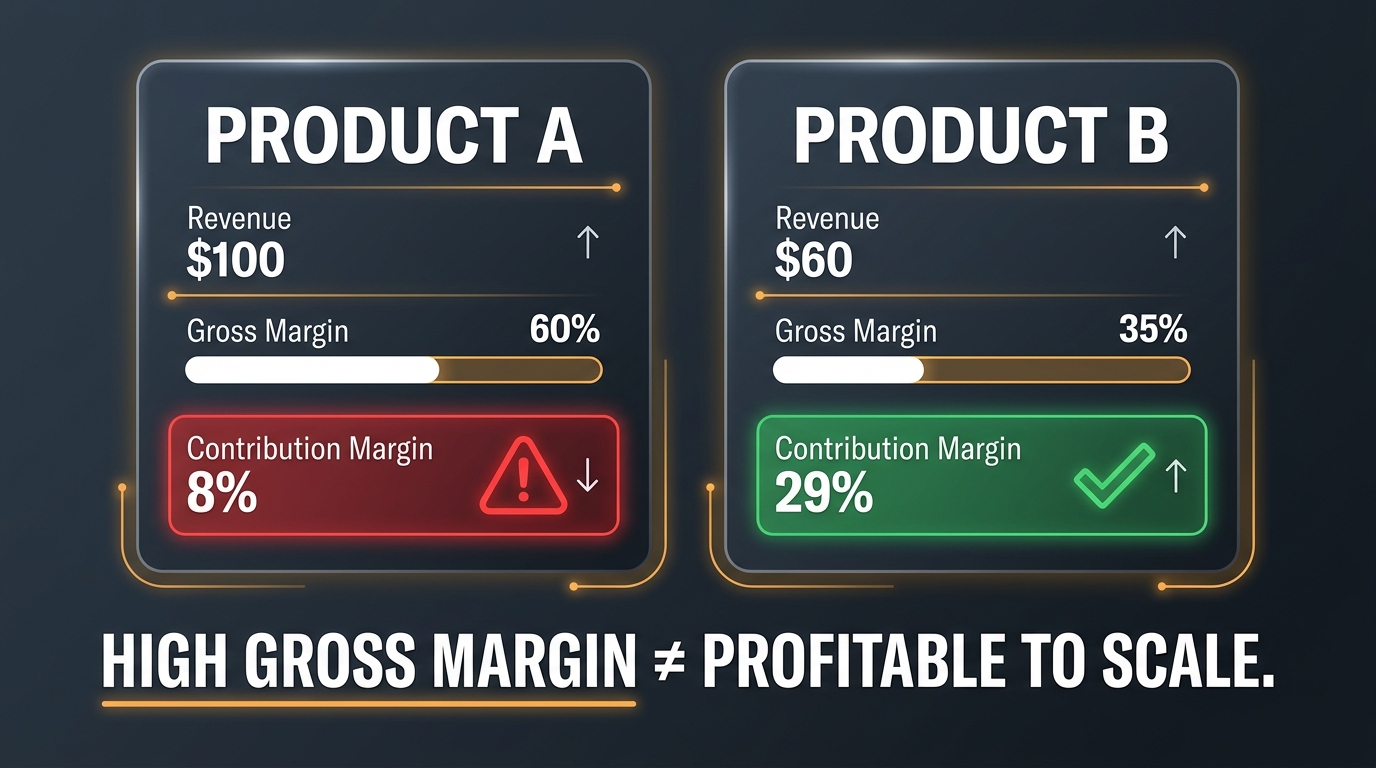
Here’s a concrete illustration. Imagine two products:
- Product A: Sells for $100. COGS is $40. Gross margin = 60%. But after accounting for shipping ($8), platform fees ($4), returns ($6), and CAC ($34), the contribution margin is just $8 — or 8%.
- Product B: Sells for $60. COGS is $39. Gross margin = 35%. But after shipping ($3), minimal platform fees ($2), low return rate ($1), and efficient CAC ($12), the contribution margin is $17.40 — or 29%.
Which product do you scale? If you’re reading gross margin, Product A looks dramatically better. If you’re reading contribution margin — the number that actually tells you what each sale generates toward covering your business — Product B is more than three times more profitable per sale.
Businesses that scale without contribution margin visibility routinely make the Product A mistake. They double down on products that look good on a P&L summary but quietly drain resources at the unit level.
Contribution Margin Benchmarks Worth Knowing
There’s no universal “good” contribution margin — it varies by business model. But useful reference points exist:
- Physical product / e-commerce: Healthy contribution margins typically fall between 25% and 45%. Below 20% is a warning sign for most product categories.
- Service businesses: Contribution margins of 50–70% are achievable given lower variable costs, but must be evaluated against the time cost of delivery.
- SaaS and software: After accounting for support and onboarding costs, contribution margins of 60–80% are expected and necessary to support the cost of acquisition.
- Marketplaces and platforms: Contribution margins vary widely based on take rate and variable infrastructure costs.
If your contribution margin doesn’t meet the threshold for your business model, scaling will not fix it. Scaling will compound it.
SKU-Level and Product-Mix Profitability: What’s Actually Making Money?
One of the most dangerous assumptions in business is that because the company as a whole appears profitable, every part of the business contributes to that profitability. Aggregate financial statements are, almost by design, averaging tools. They blend winners and losers into a single number that obscures individual performance entirely.
The Pareto principle is relentless in product businesses: research consistently shows that roughly 20% of SKUs generate approximately 80% of profit. The other 80% of the catalog either breaks even, marginally contributes, or actively loses money when all variable costs are properly allocated.
Running a SKU-Level Profit Analysis
The mechanics of SKU-level profitability analysis require assigning all relevant variable costs to each individual product. This means going beyond COGS to allocate fulfillment costs (which vary by size and weight), return rates (which differ dramatically by product category and quality), channel-specific CAC where acquisition can be attributed, and any product-specific storage or handling expenses.
The output is a ranked list of SKUs by contribution margin — and the results routinely surprise business owners. “Hero” SKUs with 50–60% contribution margins often sit alongside “zombie” SKUs running at negative margins that get overlooked because they generate revenue volume. Those zombies aren’t just failing to contribute — they’re consuming warehouse space, operations bandwidth, supplier relationship capital, and customer service time that could be redirected to the profitable products.
The Product Mix Problem at Scale
Here’s where this becomes specifically critical before a scaling decision: as you grow, your product mix tends to shift. Higher marketing spend often drives volume in the most easily marketed products, which are not always the most profitable ones. Promotional activity disproportionately boosts lower-margin SKUs because price sensitivity is highest there. Seasonal demand creates inventory commitments for products that may not move at expected velocity.
Without SKU-level visibility, scaling can create a product mix that becomes progressively less profitable even as total revenue grows. You can find yourself six months into an expansion with higher revenue, higher costs, higher complexity — and lower net profit than you started with.
Practical Steps for Product Mix Optimization
- Classify each SKU into one of three categories: Heroes (strong contribution margin, healthy velocity), Contributors (positive but modest margin — candidates for optimization), and Zombies (negative or near-zero contribution — candidates for discontinuation or repricing).
- Establish a margin floor. Decide the minimum contribution margin per SKU that you’ll accept before a product is removed from the active catalog or reformulated.
- Before scaling marketing spend, verify that the SKUs driving the most advertising volume are also the SKUs with the strongest contribution margins. Misalignment here is where most ad-driven scaling goes wrong.
- Review the mix quarterly. Product profitability is not static — input costs change, carrier rates shift, and competitive pricing pressure varies over time.
Cash Flow vs. Profit: The Gap That Quietly Destroys Growing Businesses
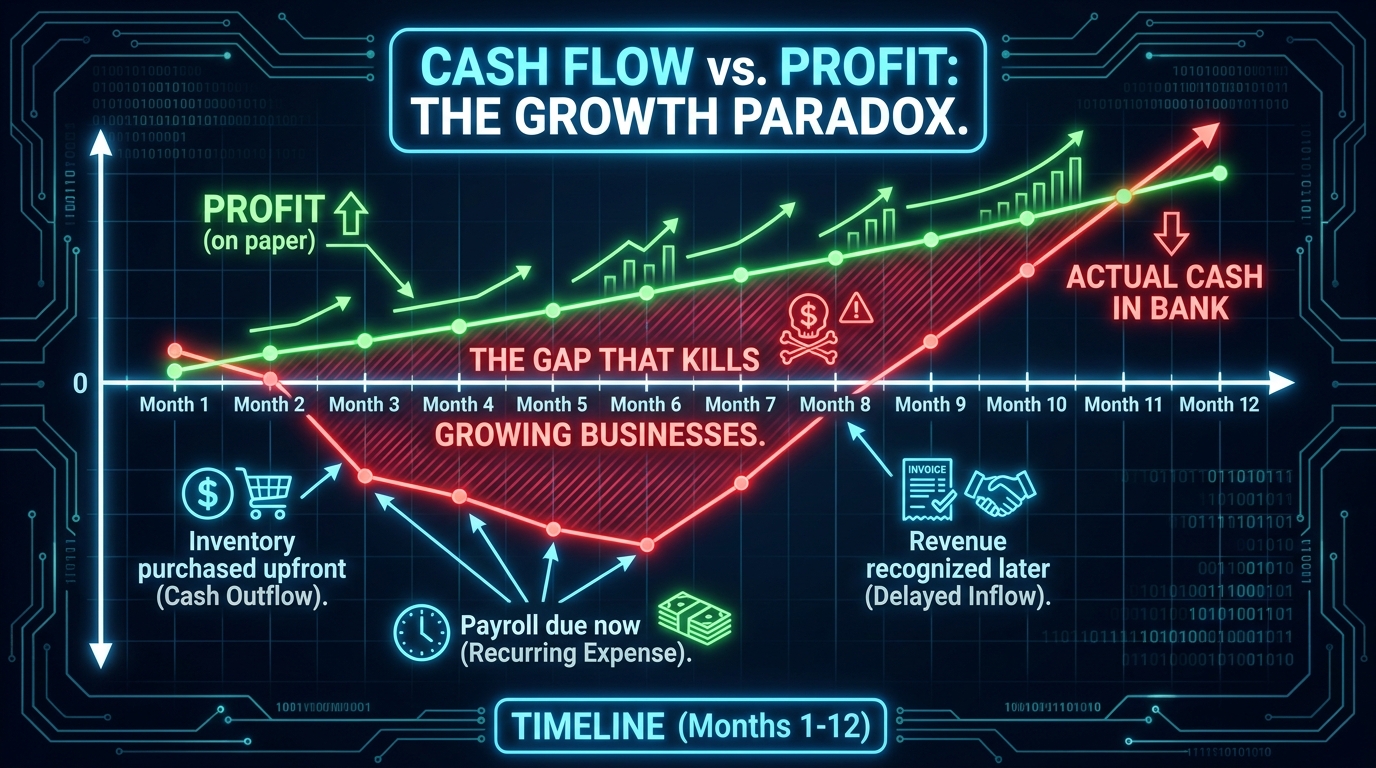
A business can be profitable on paper and bankrupt in practice. This isn’t a paradox — it’s an accounting reality that kills growing companies regularly.
Profit is an accrual accounting concept. It measures whether revenue exceeded expenses within a given period. Cash flow measures whether money was actually present in your account to pay your obligations. The difference between those two things is timing — and timing, during a growth phase, can be lethal.
How the Cash-Profit Gap Opens
The mechanics are straightforward. When you scale, you need to spend money before you make money. You purchase inventory 60–90 days before it sells. You pay staff before the revenue from their work arrives. You invest in advertising in the current month and receive the resulting revenue across the following 4–8 weeks. You extend credit terms to retail buyers who pay net-30 or net-60. Meanwhile, your suppliers, your landlord, your platform fees, and your payroll all demand payment on fixed schedules regardless of when your cash actually lands.
The gap between outflows (immediate) and inflows (delayed) is where growing businesses suffocate. A company can be reporting its best quarterly profit ever and simultaneously unable to make payroll, because the cash to cover current obligations hasn’t arrived yet.
The Inventory Trap
For product businesses, inventory is the most common source of cash-profit divergence. When you place a large purchase order, cash leaves your account immediately. That cash doesn’t appear as an expense on your P&L until the product sells — it sits on the balance sheet as an asset. So your profit and loss statement looks fine (no expense recorded yet) while your bank account is severely depleted. If sales velocity is lower than projected, you may be sitting on expensive inventory for months before that cash converts back to revenue.
Scaling means placing larger purchase orders — which means larger upfront cash commitments — which means larger potential gaps if the inventory doesn’t move at plan. Without cash flow visibility alongside profit visibility, scaling a product business is essentially a bet that your inventory projections are right. That’s a bet most businesses lose at some point.
Building a Cash Flow Forecast That’s Actually Useful
A useful cash flow forecast is not just a projection of monthly revenue and expenses. It maps the timing of cash movements with specificity:
- When do customer payments actually arrive (by channel and customer type)?
- When does each supplier invoice become due?
- What is the payment cycle for platform fees, ad platforms, and fulfillment partners?
- What is the expected disbursement timing for marketplace payouts (Amazon, for example, holds funds for 14 days before disbursement)?
- What are the cash implications of each planned inventory purchase over the next 90 days?
Rolling 13-week cash flow forecasts — updated weekly — are considered best practice for businesses in growth phases. The 13-week window provides enough visibility to take corrective action before a shortfall becomes a crisis, while remaining short enough to maintain accuracy.
Cash Runway as a Pre-Scaling Gate
Before committing to a scaling initiative, calculate your cash runway: the number of months your current cash balance can sustain operations at current burn rate without additional revenue. Most financial advisors recommend a minimum of three months of runway before launching a growth initiative. Six months is more comfortable. Fewer than two months means any scaling investment creates meaningful insolvency risk if results are slower than projected.
Unit Economics Deep Dive: The Math You Must Do Before Hiring
Unit economics is the discipline of understanding profitability at the level of a single transaction, customer, or product unit — not at the company aggregate level. It’s the financial microscope that reveals whether your business model actually works before you put more resources behind it.
The three unit economics numbers that matter most before any scaling decision are: Customer Acquisition Cost (CAC), Customer Lifetime Value (LTV), and CAC Payback Period.
Customer Acquisition Cost (CAC): The True All-In Number
True CAC = Total sales and marketing spend (including all staff, tools, agency fees, and ad spend) ÷ Number of new customers acquired in the same period.
Many businesses calculate a partial CAC by counting only direct ad spend. This understates the true cost of customer acquisition significantly. If you employ a marketing manager at $85,000 per year, subscribe to five marketing tools at $500/month combined, work with an agency at $3,000/month, and spend $15,000/month in direct ads — your all-in marketing cost is approximately $28,583/month. Divide that by new customers acquired and you have an honest CAC.
CAC needs to be tracked by channel, not just in aggregate. Blended CAC hides channel-level efficiency differences that become critical when you decide where to invest scaling capital.
Customer Lifetime Value (LTV): What a Customer Is Actually Worth
LTV = Average order value × Purchase frequency × Average customer lifespan × Gross margin percentage
LTV is where businesses routinely inflate their unit economics. Using revenue-based LTV rather than profit-based LTV creates optimistic math that doesn’t hold up. If a customer spends $200 twice per year for three years, their revenue LTV is $1,200. But if gross margin is 40%, their profit LTV is $480. Those are very different numbers when you’re evaluating how much you can afford to spend to acquire them.
LTV also needs segmentation. New customers acquired through a discount promotion often have lower repeat purchase rates and higher return rates than customers acquired through content or referral. Aggregated LTV averages mask this distinction and lead to spending decisions calibrated to your best customers when the acquisition channel is delivering your worst ones.
LTV:CAC Ratio — The Benchmark That Defines Scalability
The LTV:CAC ratio is the clearest single indicator of whether your business model can scale. The widely accepted benchmark is 3:1 or higher — meaning for every $1 spent to acquire a customer, you generate $3 in lifetime profit contribution.
- Below 1:1: You’re losing money on every customer. Full stop. Do not scale.
- 1:1 to 2:1: You’re recovering acquisition costs but not generating enough surplus to fund growth. This ratio needs improvement before scaling.
- 3:1 to 5:1: Healthy range. Your model can support scaling investment.
- Above 5:1: Strong unit economics — though very high ratios sometimes indicate under-investment in growth rather than exceptional efficiency.
CAC Payback Period: The Liquidity Dimension
Even with a strong LTV:CAC ratio, the payback period determines whether your cash flow can support growth. CAC payback period = CAC ÷ (Monthly contribution per customer).
If a customer costs $120 to acquire and contributes $20 per month in margin, the payback period is 6 months. If it’s 12 months, you need to carry the cost of acquisition for a year before you break even on that customer — which creates significant working capital pressure at scale. The benchmark for CAC payback is under 12 months for most business models, with under 6 months considered strong.
Building a Profit Visibility Dashboard
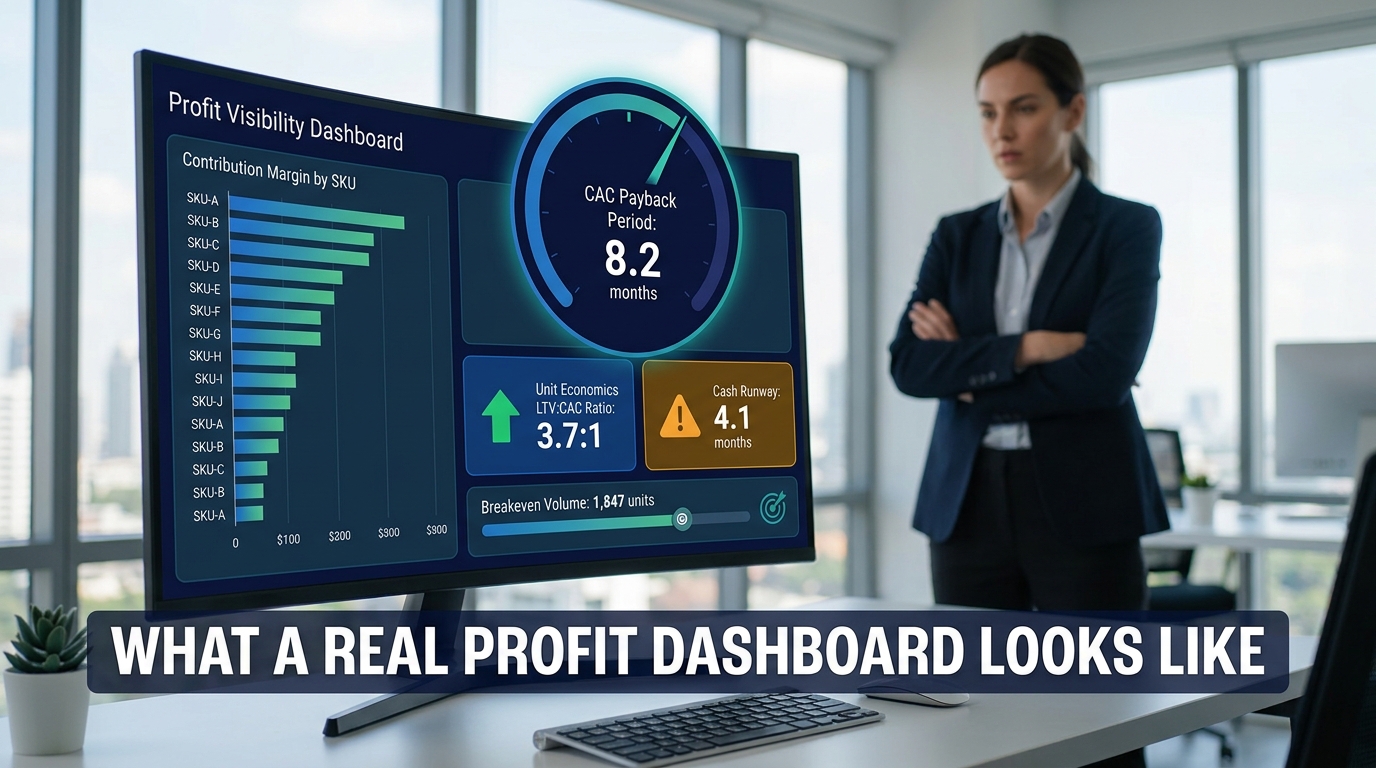
Having the right metrics identified is only half the challenge. The other half is building a system to track them consistently — one that puts the right numbers in front of decision-makers at the right frequency without requiring hours of manual assembly each week.
A profit visibility dashboard doesn’t need to be technically complex. What it needs to be is deliberately designed around the numbers that drive scaling decisions, not the numbers that are easiest to pull.
The Core Dashboard Components
Weekly metrics (operational layer):
- Revenue by channel
- Blended and channel-level CAC
- Return rate by product/SKU
- Cash position and 4-week cash flow projection
- Ad spend-to-revenue ratio by platform
Monthly metrics (strategic layer):
- Contribution margin by product and by channel
- Gross and net profit margin
- LTV:CAC ratio (by cohort and by acquisition channel)
- CAC payback period (rolling 3-month average)
- SKU-level profitability ranking
- Overhead as a percentage of contribution margin
- Inventory turnover rate
Quarterly metrics (structural layer):
- Breakeven volume vs. actual volume
- Fixed cost coverage ratio
- Rolling 12-month LTV by acquisition cohort
- Product mix profitability shift (are your margins improving or compressing?)
The Reporting Cadence That Actually Works
Many small and mid-size businesses rely on monthly financial statements reviewed several weeks after the period closes. That reporting lag is disqualifying for scaling decisions. By the time you receive March’s P&L in late April, you’ve already made April’s decisions based on incomplete information.
The operational layer metrics need to be visible weekly, ideally in a format that takes under 30 minutes to review. This requires some upfront investment in either accounting software capable of near-real-time reporting or a manual reporting process that pulls data from each channel and aggregates it consistently.
Tools like Xero, QuickBooks Online, or more specialized platforms like Profitwell, Mosaic, or Fathom can help automate this if your transaction volume justifies it. For businesses with fewer than $3M in annual revenue, a well-structured Google Sheets or Excel model populated from source data often provides the same visibility with lower overhead.
The “What Would This Cost to Scale?” Test
One of the most useful practices to build into your dashboard is a simple scenario model that answers a specific question: if revenue doubles, what happens to each cost line?
Walk through each cost category and classify it as: fixed (doesn’t change with volume), variable (scales directly with volume), or semi-fixed (steps up at certain volume thresholds). Then model the impact of 2x revenue on each. The result often reveals that some costs that look variable are actually semi-fixed (a fulfillment center doesn’t double staff at exactly the same rate revenue doubles), and some costs that look fixed have volume-dependent triggers (software that’s tiered by transaction count, or warehouse space that needs to expand at a certain inventory level).
This exercise frequently changes scaling decisions. It makes visible the cost step-ups that will occur before new revenue arrives — the moments of maximum cash pressure during growth.
The Breakeven Litmus Test: Three Questions Before You Scale Anything
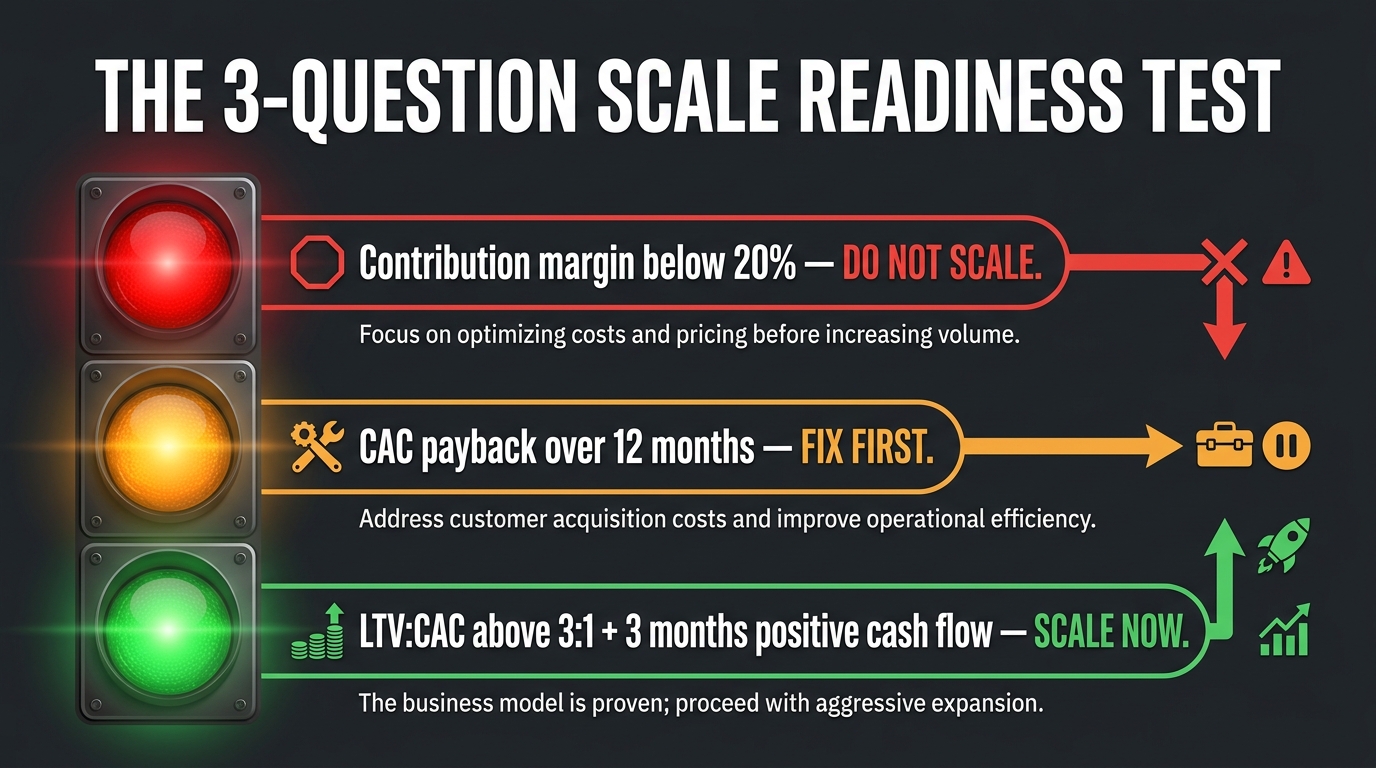
Before any scaling decision — hiring, ad spend increase, new channel launch, inventory expansion, geographic growth — these three questions function as a go/no-go gate.
Question 1: Do I know my contribution margin with confidence — and is it above 20%?
This is the foundational question. If you cannot state your contribution margin — not gross margin, not revenue, not net profit — with a specific number derived from a complete accounting of all variable costs, you do not have sufficient financial visibility to scale.
If you know your contribution margin and it falls below 20% for a product business (below 40% for SaaS, below 35% for services), scaling is a risk amplification exercise, not a growth strategy. The correct response is to improve the margin first — through pricing, cost reduction, returns management, or product mix adjustment — before deploying scaling capital.
Question 2: Is my CAC payback period under 12 months?
The payback period question is fundamentally a cash flow sustainability test. If you spend $100 to acquire a customer and it takes 14 months to recoup that spend through the contribution that customer generates, then scaling your customer acquisition means carrying increasingly large deferred costs on an increasingly long time horizon. Your cash requirement grows faster than your cash inflows, creating compounding liquidity pressure.
A payback period under 12 months means that within one year — a planning horizon most businesses can manage — the capital deployed to acquire customers is returned. Above 12 months, scaling becomes a function of how much external capital or operating cash flow you can sustain, rather than how efficiently your model works.
Question 3: Do I have at least 3 months of cash runway after accounting for the scaling investment?
Scaling initiatives consume cash before they generate it. Ad spend goes out in week one; revenue from those campaigns may arrive across weeks three through eight. New hire costs start on day one; their productivity contribution ramps over months. Inventory for a new product line depletes your cash account before a single unit sells.
If the scaling investment you’re considering would reduce your cash runway below three months, you’re operating without a meaningful buffer. Any underperformance — a campaign that doesn’t convert as expected, a product that moves slower than projected, a delay in a key customer payment — becomes an existential threat rather than a recoverable setback.
Three months of post-investment runway is the minimum responsible threshold. Six months is the standard that experienced operators use as a practical benchmark.
When Scaling IS the Right Move: Reading the Green Lights
Profit visibility is not an argument against growth. It’s an argument for growth done right — at the right time, in the right direction, with clear eyes about what’s actually driving results.
When the financial diagnostics align, scaling is not just appropriate — it’s overdue. The opportunity cost of not scaling when conditions are right is real and meaningful. Understanding what “ready” looks like is just as important as understanding what “not ready” looks like.
The Financial Signals That Indicate Readiness
Your contribution margin is consistent and understood. You’ve tracked it across multiple months and product categories. You understand what drives it and what threatens it. It’s not an occasional calculation — it’s a number your team knows and monitors.
Your LTV:CAC ratio is 3:1 or better at the channel level. Not just blended. By specific acquisition channel. This means you know which channels generate customers who are actually profitable to acquire, and you’re ready to invest more capital into those specific channels.
Your CAC payback is under 12 months and your cash runway exceeds the payback period. This means you can fund customer acquisition cycles without creating cash shortfalls before those customers repay their acquisition cost.
Your product mix is improving, not degrading. As volume increases, your higher-margin SKUs are driving proportional or greater growth than your lower-margin ones. You’re not dependent on discounting or promotional activity to sustain revenue velocity.
You understand which costs are fixed, which are variable, and where the step-ups occur. You’ve run the “what would this cost to double?” analysis and you know where the pressure points are before they hit.
What Scaling Should Actually Do to Your Numbers
When you scale a business with strong unit economics, you should observe predictable improvements: fixed cost absorption improves as revenue grows against a static overhead base; bulk purchasing reduces COGS; operational efficiencies emerge as processes mature. Gross and net margins expand — not just in absolute terms but as percentages.
If scaling is producing flat or declining margins alongside revenue growth, that’s a signal that the unit economics were not as strong as believed, or that the cost structure is scaling faster than the efficiency gains. Both conditions warrant a pause and a diagnostic review before continuing to invest in growth.
The Right Sequence for Scaling Capital Deployment
Not all scaling investments carry equal risk or return. A useful sequence for capital deployment prioritizes certainty of return:
- Efficiency investments first — tools, processes, or operational changes that improve margin without requiring revenue growth.
- Proven channel expansion second — increasing spend in acquisition channels with demonstrated positive unit economics.
- Capacity expansion third — adding team, space, or infrastructure to support higher volume in areas where demand evidence is clear.
- New channel or market entry last — the highest uncertainty category, best funded after the more certain investments have been made and measured.
This sequence isn’t a rigid rule, but it reflects a risk-weighted approach to deploying growth capital that protects the business if any individual initiative underperforms.
From Financial Clarity to Scaling Confidence: Putting It All Together
There’s a version of this article that ends with a checklist and calls it done. But the checklist is only useful if the deeper principle has landed: profit visibility is not a finance function. It’s a leadership function.
The business owners and operators who build durable, scalable companies share a common habit: they’re specific about money. They don’t accept “we’re doing well” as an answer. They know their contribution margin. They can recite their LTV:CAC ratio. They’ve done the breakeven math. They’ve stress-tested their cash flow. They’ve run the SKU-level analysis and made hard decisions about which products to kill and which to invest in.
That specificity isn’t pedantry — it’s protection. It’s what allows them to move fast when conditions are right, because they’ve already done the diagnostic work that tells them the timing is right. And it’s what causes them to hold back when the signals aren’t there, because they know the difference between growth that builds equity and growth that just generates activity.
The Diagnostic Process in Summary
Before any scaling decision, work through this sequence:
- Calculate true contribution margin at the product, channel, and company level — including all variable costs, not just COGS.
- Run a SKU-level profitability analysis and identify Heroes, Contributors, and Zombies. Make decisions about the Zombies before scaling.
- Build a 13-week cash flow forecast that maps the timing of inflows and outflows, not just the aggregate monthly projections.
- Calculate all-in CAC by channel and derive LTV:CAC ratios using profit-based LTV, not revenue-based LTV.
- Determine your CAC payback period and confirm it falls within your cash runway after the planned scaling investment.
- Model the cost step-ups that will occur at your target volume and confirm your contribution margin will absorb them.
- Set your scaling triggers: specific, measurable thresholds that define when a growth investment is greenlit versus when it needs to wait for conditions to improve.
The businesses that scale well aren’t the ones that moved fastest. They’re the ones that moved with clarity — and built the financial understanding to know the difference.
Final Thought: Slow Down to Speed Up
Counterintuitively, the businesses that invest time in profit visibility before scaling typically scale faster than those that don’t. They avoid the costly detours — the expensive campaigns that erode margin, the inventory commitments that freeze cash, the hires that outpace revenue. Their growth is cleaner, more capital-efficient, and more durable.
Scaling without profit visibility is the financial equivalent of accelerating on an unfamiliar road in the dark. You might make it through. But the risks you’re running are invisible — and invisible risks are the ones that cause the worst outcomes.
Take the time to turn on the lights first. Know your numbers, not just your revenue. And scale the thing you actually understand — the profitable engine underneath the business, not just the volume it can produce.
“Revenue is vanity, profit is sanity, cash is reality.” — A principle that has saved more businesses than any growth tactic ever will.