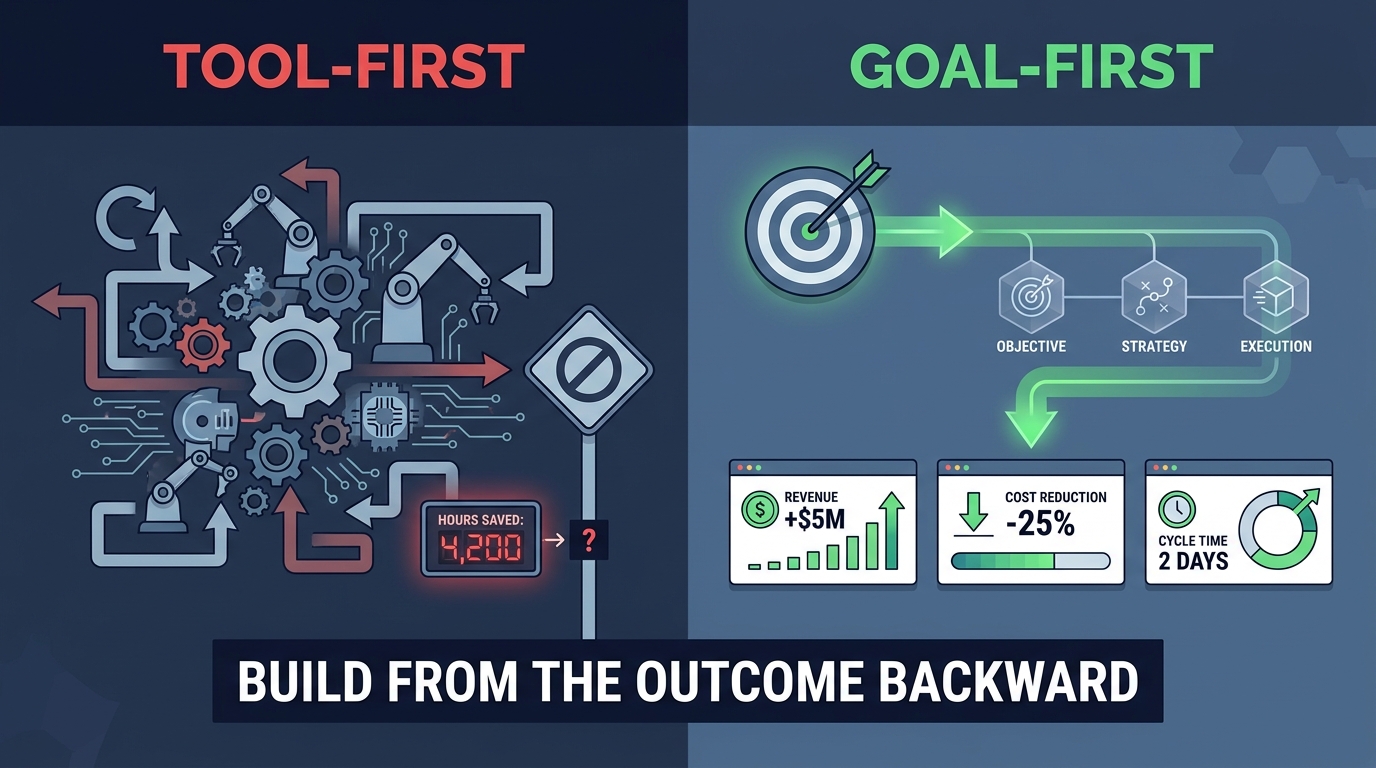

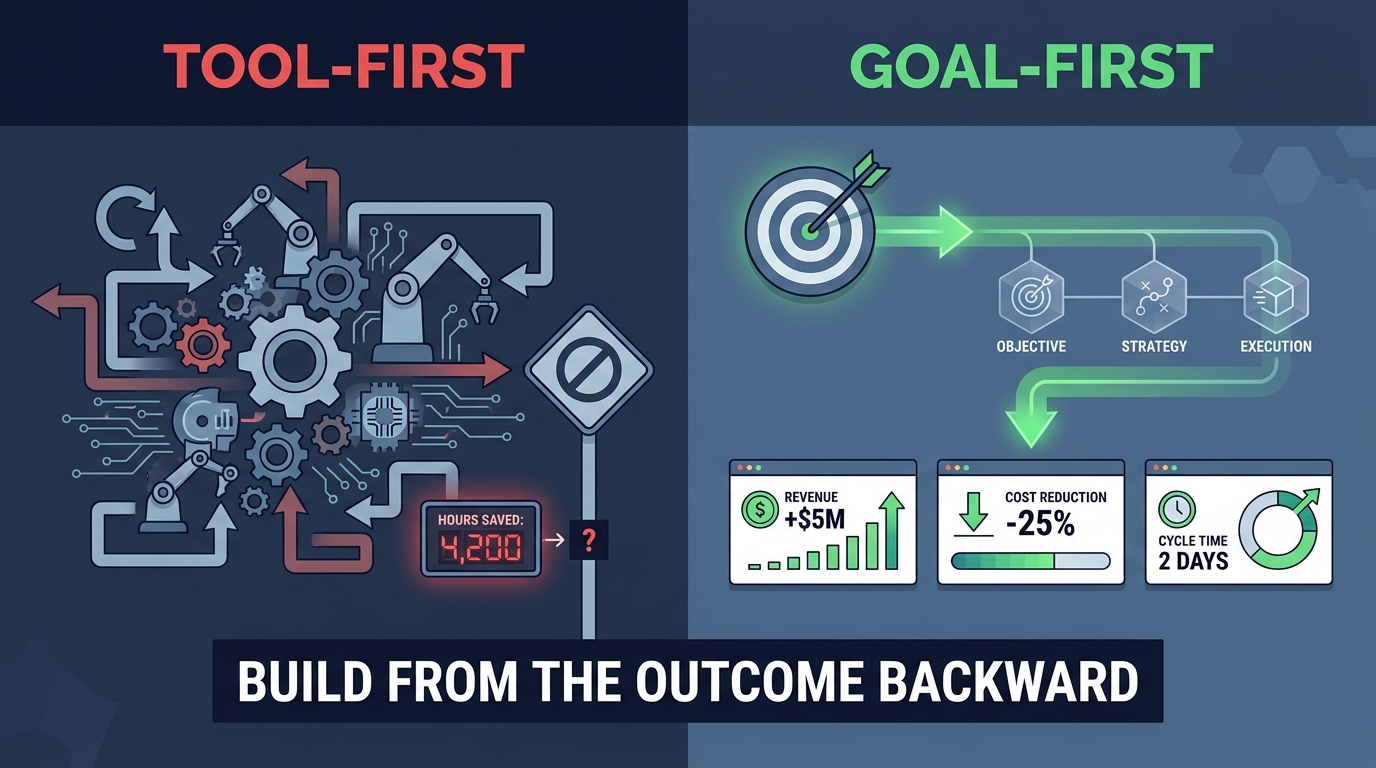
There is a particular kind of automation success story that organisations love to tell. A team spent three months building a workflow that now processes 12,000 documents a month automatically. Developers are proud of it. IT loves the elegance of the logic. The operations team saved what the slide deck calls “4,200 person-hours” over the past year. Leaders applaud politely in the quarterly review.
Then someone in the back of the room asks a quiet question: “So what did that actually do for the business?”
And no one has a clean answer.
This is the central problem with how most organisations design automations in 2026. The technology gets built. The workflow runs. The activity metrics look great. But the chain of logic that connects that workflow to a specific business outcome — reduced cost, faster revenue, lower risk, better customer experience — was never established in the first place. You cannot prove what you never measured. And you cannot measure what you never defined as the goal before you started building.
This piece is not about automation technology, tooling choices, or whether RPA is better than AI agents for a given task. It is about the design logic that comes before any of that — the discipline of starting from a business goal, tracing backwards to the metric that proves it, and only then deciding what to automate and how. When that discipline is in place, automation programs earn credibility, secure continued investment, and compound value over time. When it is absent, even technically impressive programs quietly lose their mandate.
Here is what goal-based automation design actually looks like — and why so few organisations are genuinely doing it yet.
The Activity Trap: Why Counting Bots and Hours Saved Kills Automation Programs
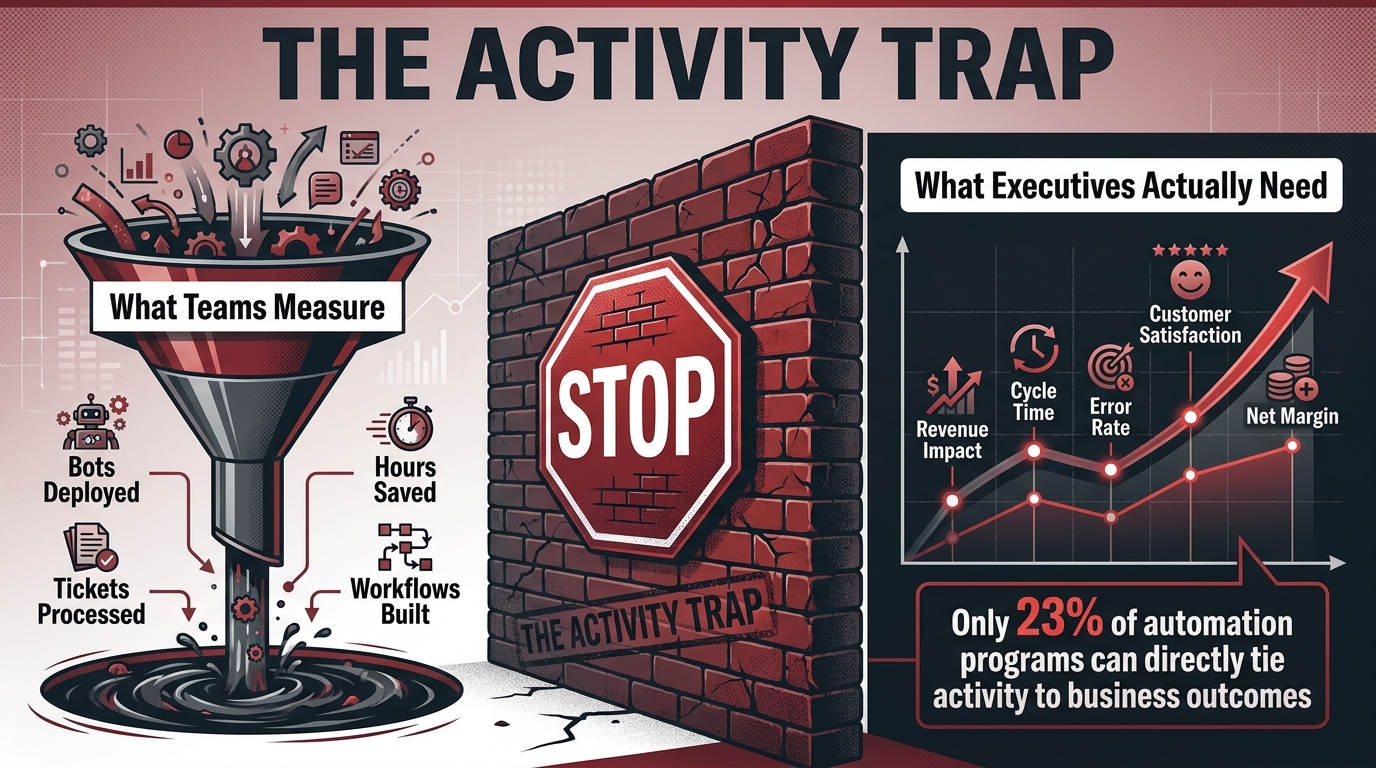
Activity metrics feel satisfying because they are easy to generate and hard to argue with. Twelve thousand documents processed is a real number. Four thousand hours “saved” sounds like a real saving. The problem is that none of those numbers answer the question that matters to a CFO, a COO, or a board: did this make the business more valuable?
Hours saved, bots deployed, tasks automated, and messages sent are all inputs — measurements of what the system is doing, not what it is achieving. They tell you that the machine is running. They say nothing about whether the machine is running in the right direction.
The Measurement Disconnect in Practice
Consider a common scenario. A financial operations team automates invoice matching across three ERP systems. They log 6,800 hours saved per year in their reporting dashboard. Impressive on a slide. But the actual business problem was a 47-day average accounts payable cycle that was damaging supplier relationships and costing early-payment discount opportunities. Two years after the automation went live, AP cycle time has dropped to 41 days — better, but still well outside the target of 30 days. And nobody measured the discount capture rate at all.
The activity metric said success. The business goal said incomplete. And because the goal was never the starting point, no one had the data to have an honest conversation about it.
Research from 2026 suggests this disconnect is more common than organisations admit. Studies of enterprise automation programs consistently find that the majority of teams track output metrics — tasks completed, workflows built, capacity generated — but fewer than a quarter can directly map those outputs to a change in a business-level KPI. The gap is not a technology problem. It is a design problem that starts the moment a team picks a process to automate before they pick a business outcome to move.
Why Activity Metrics Eventually Doom a Program
Activity metrics do not just fail to prove value — they actively undermine automation programs over time. They create a false sense of progress that delays the harder work of measuring actual outcomes. They give critics easy ammunition when budget cycles tighten: “We’ve built 40 workflows and we still can’t show what changed in the P&L.” And they make it extremely difficult to prioritise the next wave of automation investments, because there’s no evidence base for what worked and what didn’t.
Organisations that build their automation story on activity metrics tend to hit a ceiling somewhere around the second or third year of a program. The early wins were real but unmeasured in terms that executives care about. Budget requests for expansion face skepticism. The program becomes dependent on champions rather than evidence, which makes it fragile.
The antidote is not more dashboards. It is a fundamentally different starting point — one that treats business goals as the architecture, not the afterthought.
What Goal-Based Automation Actually Means (And What Most Teams Are Actually Doing)
The phrase “goal-based automation” gets used loosely, but it has a specific meaning worth pinning down. Goal-based automation design means that every automation initiative begins with a named business goal, has a defined outcome metric with a baseline and a target, and is evaluated — at regular intervals — against whether that metric has moved. The automation is a means to an end. The end is explicitly stated before any build begins.
What most teams are actually doing is almost the opposite. They begin with a tool — a new RPA platform, a workflow engine, an AI agent framework. Then they look for processes that the tool can handle. They build automations for those processes. They measure the activity of those automations. And somewhere, in a separate conversation that may never connect to the first one, leadership is trying to improve cost margins, cycle times, or customer retention.
The Tool-First Trap
The tool-first approach is not irrational. Automation tools are often acquired at the enterprise level before specific use cases are fully defined. IT teams legitimately need to learn platforms by building things. Pilots and proofs of concept have real educational value. The problem is when the pilot mindset becomes the operating model — when “let’s see what we can automate with this tool” becomes the permanent answer to the question of where automation energy should go.
Tool-first automation tends to cluster around processes that are easy to automate rather than processes that are high-value to automate. These are not the same thing. High-volume, low-complexity tasks are easy targets for automation tools. They are also often low-stakes in terms of business impact. The processes that genuinely move the needle on financial outcomes, customer experience, or risk — invoice disputes, complex customer onboarding, regulatory reporting exceptions — are frequently messier, require more nuanced design, and don’t get touched because the low-hanging fruit already filled the roadmap.
The Goal-First Difference
Goal-first automation design starts with a business problem statement, not a process inventory. It asks: which outcomes are the organisation most trying to move in the next 12 months? Where are the metrics that matter to leadership currently underperforming? Then — and only then — it asks what role automation can play in moving those metrics.
This distinction changes everything downstream. It changes which processes get prioritised. It changes how success is defined. It changes how conversations with senior stakeholders go — because those conversations are anchored in language they already use (revenue, cost, risk, satisfaction) rather than language that requires translation (bots, workflows, API calls). And it changes whether an automation program can demonstrate compounding value over time or stalls after the first year of pilots.
The Reverse Design Framework: Starting From the Metric, Not the Workflow
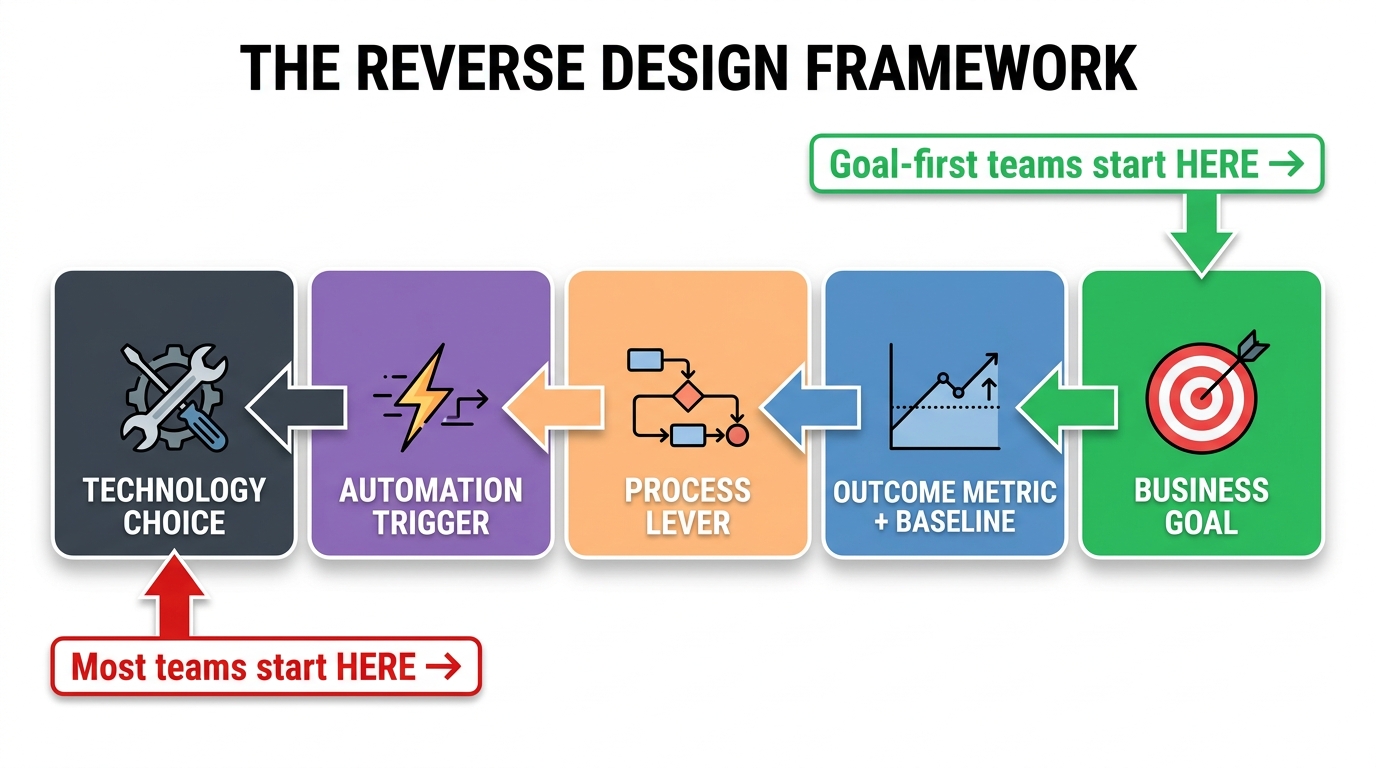
The most practical shift an automation team can make is to reverse the conventional design sequence. Instead of starting with a tool or a process, start with the business goal and design backwards. This is not a complicated idea. But it requires discipline to apply consistently, especially under pressure to show activity and prove the team is “doing things.”
Step 1: Name the Business Goal
The starting point is the company or department scorecard — the KPIs that leadership is already tracking and already cares about. These typically fall into a handful of categories: reducing cost, growing or accelerating revenue, reducing risk, improving customer or employee experience, or increasing speed and capacity.
The goal needs to be specific enough to be measurable. “Improve customer experience” is not a goal in this context — it is a category. “Reduce customer onboarding time from 14 days to 7 days” is a goal. “Cut cost-per-transaction in the loan servicing unit by 18%” is a goal. Specificity at this stage is not bureaucratic — it is what makes everything downstream possible.
Step 2: Define the Metric That Proves Movement
Once the goal is named, identify the metric or metrics that would confirm it is moving. For each goal, the ideal metric has three characteristics: it is already being collected or can be, it is directly influenced by the process being considered for automation, and it is a metric that a business sponsor recognises as meaningful.
This step often surfaces problems immediately. Teams discover that the metric they need is not being collected cleanly. Data is in multiple systems. Definitions are inconsistent across teams. The baseline is unknown. These discoveries are uncomfortable but essential — they surface data infrastructure gaps that would have silently undermined any automation effort built without this step.
Step 3: Establish the Baseline
A baseline is not optional. It is the only honest way to claim that anything changed as a result of the automation. The baseline should be taken from real historical data — not estimates, not survey responses, not anecdotes. It should cover a meaningful time window (typically 90 days minimum) and should account for seasonal variation where relevant.
This is also the moment to set a realistic target. What does a successful outcome look like after six months? After twelve? The target should be ambitious but grounded in what process redesign and automation can plausibly deliver, not what would sound impressive in a slide deck.
Step 4: Map the Process Levers
Only now does the team examine the processes that influence the target metric. Which steps in the current workflow create the most friction, delay, or error? Which handoffs cause the longest wait times? Where does human judgement add genuine value versus where is it just reviewing something a machine could verify? This process analysis is standard practice in automation design — the difference here is that it is anchored to a specific metric, not performed speculatively.
Step 5: Choose the Automation Approach
With a clear picture of which process levers matter most for moving the target metric, technology selection becomes a practical decision rather than a strategic one. The right automation approach is simply the one that most efficiently addresses the specific friction points identified — whether that is a simple rule-based trigger, a more complex AI classification layer, an API integration, or an agentic workflow. The goal drives the choice, not the other way around.
How to Identify Which Business Goals Automation Can Actually Move
Not every business goal is a good candidate for automation. Part of goal-based design is developing clear criteria for what makes a goal “automatable” — and being honest when a goal requires human judgement, cultural change, or strategic decisions that no automation workflow can substitute for.
Criteria for Automation-Eligible Goals
A business goal is a strong candidate for automation when the process that drives it is rules-based, repeatable, and high-volume; when the bottleneck is execution speed or consistency rather than insight or judgment; when the relevant data is digital and accessible; and when there is a clear, measurable before/after comparison possible.
Examples that typically qualify well: reducing error rates in data-intensive processes like payroll, invoicing, or compliance reporting; compressing cycle times in structured workflows like loan processing or order fulfilment; improving consistency in customer communications; reducing time-to-action in exception-handling queues; and accelerating revenue by speeding up lead qualification, quote generation, or contract preparation.
Goals Where Automation Is a Supporting Tool, Not the Driver
Some goals are partially addressable through automation but ultimately require broader changes. Improving customer satisfaction, for example, may have components where automation helps — faster response times, more consistent communications, fewer errors — but it also depends on empathy, product quality, and service design that automation does not control. In these cases, automation can be one lever among several, and its contribution should be credited proportionally rather than treated as the entire solution.
The honest answer to “can automation move this goal?” is sometimes “partially.” That partial contribution is still worth designing for — but it changes how you frame the business case, what baseline you measure, and what credit you can fairly claim in reporting.
Prioritisation: Where to Start When Everything Looks Important
When a team has more potential automation opportunities than capacity to build them, prioritisation should be based on a combination of business impact (how large is the goal?), feasibility (how tractable is the process?), and speed-to-baseline measurement (how quickly can you prove movement?). A simple scoring matrix using these three dimensions is more useful than either a pure impact ranking (which ignores buildability) or a pure feasibility ranking (which ignores strategic value).
The goal is to identify initiatives where high impact and reasonable feasibility overlap — and where you can establish a clear baseline and measure outcomes within three to six months. These are the programs that build the evidence base for continued investment.
Building a Baseline: The Missing Step That Makes or Breaks Your Value Proof
If there is a single step that separates automation programs that can prove their value from those that cannot, it is baselining. The baseline is the factual foundation on which every claim of improvement rests. Without it, any assertion that the automation delivered value is essentially an opinion.
What Counts as a Legitimate Baseline
A legitimate baseline comes from system data — transactional records, timestamps, log files, process mining data — not from interviews or estimations. When people estimate how long a task takes, they tend to report the time they think they are supposed to spend, not the actual time including the waiting, the rework, and the exceptions. System data does not have that bias.
The baseline period should be long enough to capture normal variation. For a process with seasonal peaks, 90 days may not be enough — a full year’s data may be needed to avoid comparing an automated peak period against a non-automated quiet one. For more stable processes, a 60-to-90-day baseline is typically sufficient.
The baseline should also include more than just the primary metric. Capture adjacent metrics that might be affected — employee overtime hours, error correction rates, exception volumes, downstream process times. These provide both a richer picture of actual impact and a safeguard against optimising one metric while inadvertently degrading another.
When You Cannot Get Clean Data
Frequently, the baselining process reveals that the data needed to measure the target goal does not exist or is not accessible in a clean form. Invoice processing times are locked in PDF logs. Customer response times are mixed across three different systems with inconsistent timestamps. Compliance check durations are recorded in narrative notes, not structured fields.
When this happens, the right response is not to skip the baseline and proceed anyway. That approach guarantees an unprovable business case. Instead, treat the data gap as a discovery that the baselining process is doing exactly what it should — surfacing infrastructure problems that would have silently undermined the automation’s value proof. Address the data capture gap as part of the automation build, so that the system generates clean measurement data from day one of operation.
Controlling for External Factors
One of the most common challenges in automation ROI measurement is attribution — how do you know that the metric moved because of the automation, rather than because of a market change, a seasonal effect, or another initiative running simultaneously? Perfect attribution is rarely possible outside a controlled experiment, and most business contexts do not allow for clean A/B testing of automation.
The practical solution is staggered rollout where possible: automate one region, one team, or one product line first, and compare outcomes to a control group that has not yet been automated. Where staggered rollout is not possible, document all other material changes happening in parallel and be transparent about them in reporting. Stakeholders who see honest attribution caveats generally trust the analysis more, not less.
The Four Value Dimensions Leaders Actually Care About
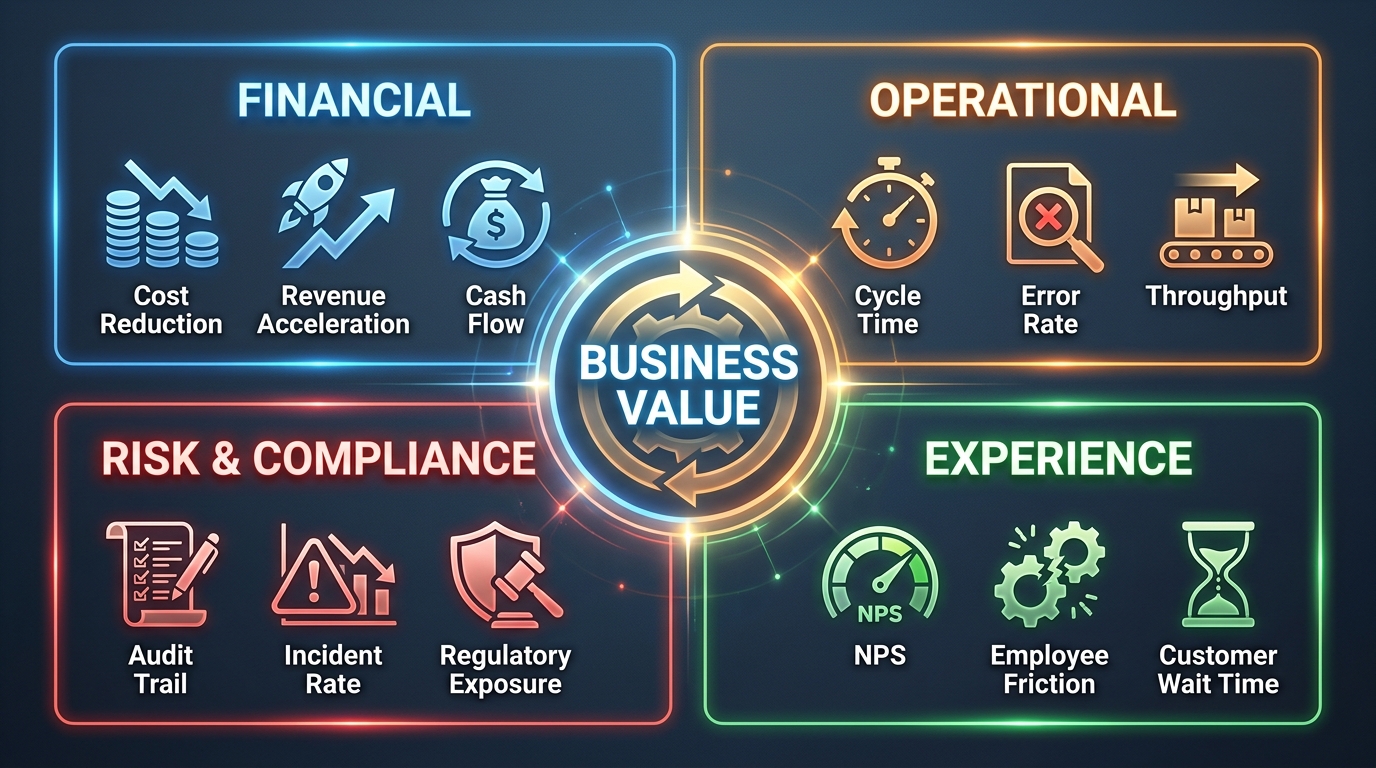
Business value is not a single number. When automation programs try to reduce their entire output to a single ROI figure — “we saved $2.4M” — they often miss the full picture, and they also miss the opportunity to speak to what different types of stakeholders actually care about. A multi-dimensional value framework is both more accurate and more persuasive.
Dimension 1: Financial Value
Financial value is the most familiar dimension and the one most directly tied to budget conversations. It includes direct cost reduction (labour, materials, overhead), cost avoidance (regulatory fines prevented, errors not incurred), and revenue impact (faster quote-to-cash, higher conversion rates through faster response, reduced churn through better service). Financial value is the dimension CFOs and boards want to see first, and it should be measured in actual monetary terms wherever possible — not in “hours saved” as a proxy for money, but in the actual cost impact on the P&L.
Converting hours saved to financial value requires discipline. Saved hours only generate financial value if they result in headcount reduction, redeployment to higher-value work, or avoidance of hiring to cover growth. An hour saved and then spent on low-value make-work is not a financial benefit. The honest conversion accounts for what actually happened to the capacity created.
Dimension 2: Operational Value
Operational value captures changes in how the business performs at the process level — metrics that flow through to financial and experience outcomes but are meaningful in their own right. Cycle time is the most common: how long does a process take from start to finish? Throughput matters too: how many units can the process handle per unit of time? Error rate — what percentage of outputs require rework or correction — is often particularly impactful because errors are expensive to fix and damage downstream quality.
Operational metrics tend to be the most immediately measurable post-automation, and they are often the most compelling for functional leaders (heads of operations, supply chain, finance) who feel the friction of those numbers every day. They also make excellent leading indicators — improvements in cycle time and error rate tend to predict financial improvements that show up a quarter or two later.
Dimension 3: Risk and Compliance Value
Risk value is frequently under-reported because it is harder to make visible — it is measured in things that did not happen. Regulatory breaches avoided. Audit findings reduced. SLA penalties not incurred. Data quality exceptions caught before they became liability events. This dimension matters enormously to legal, compliance, and governance stakeholders, and it often represents the most compelling business case in regulated industries.
To make risk value tangible, quantify the cost of the risk events the automation prevents. If a compliance exception historically costs on average $45,000 to remediate and the automation catches 12 exceptions per quarter that would otherwise have been missed, that is $540,000 of annual risk value — a real number that belongs in the business case.
Dimension 4: Experience Value
Experience value covers both customer and employee experience. On the customer side: faster response times, fewer errors that reach the customer, more consistent communications, and reduced wait times. These drive NPS, retention, and ultimately revenue, but the connection is more lagged and requires separate tracking. On the employee side: reduction in repetitive, low-value work creates capacity for more complex and engaging tasks, which affects retention, satisfaction, and the quality of work that now gets more human attention.
Experience value is the hardest to isolate but often the most visible to stakeholders across the organisation. Including it in automation value reporting — even with appropriate caveats about attribution — creates allies in parts of the business that might otherwise be indifferent to an automation program.
Governance That Keeps Value From Leaking Over Time
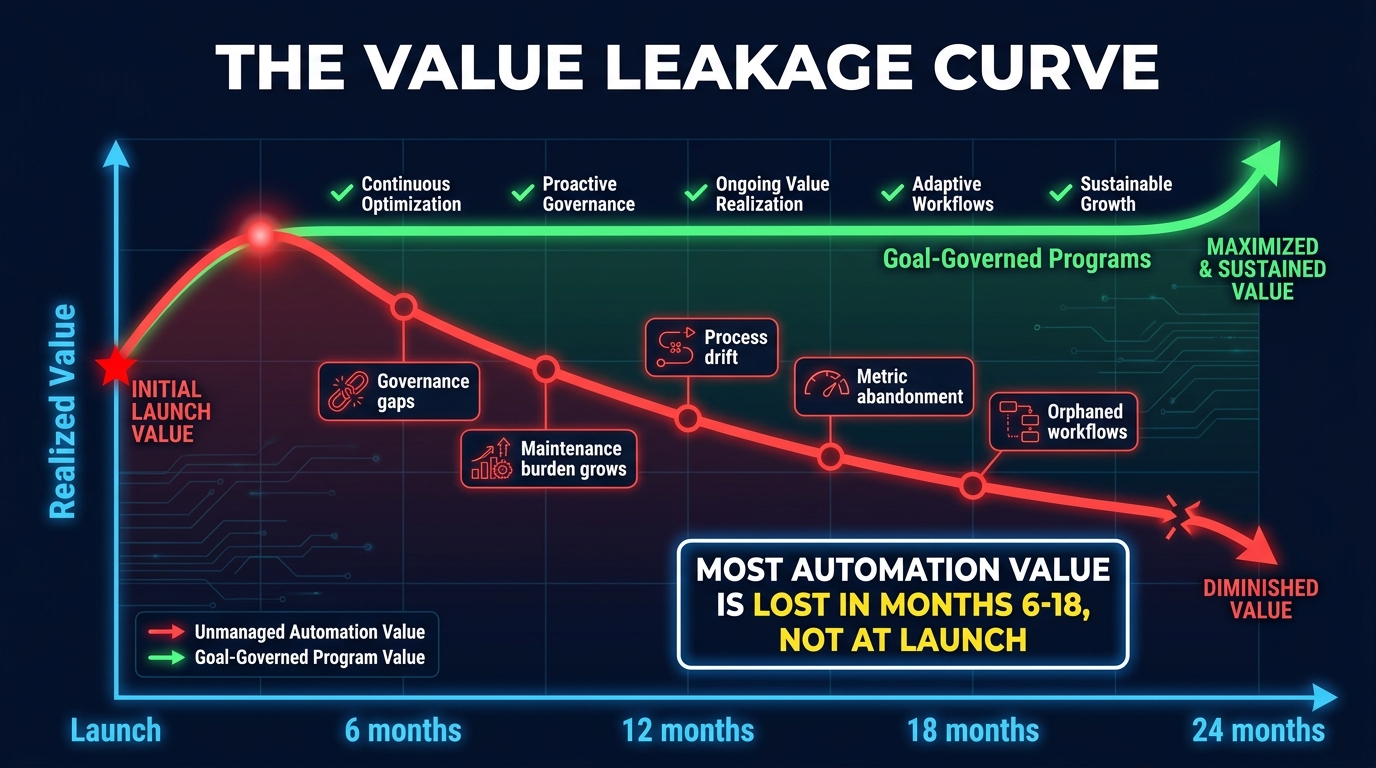
One of the most consistent findings in 2025-2026 research on automation programs is that value is not lost at launch — it leaks away gradually in the months and years after an automation goes live. The initial build works as intended. The metrics look good in the first post-launch review. Then, quietly, the value starts to erode.
This happens for predictable reasons. Underlying processes change, but the automation does not. Business rules evolve, but no one updates the workflow logic. Data quality in source systems degrades, but the automation keeps running on stale inputs. The original business sponsor moves on, and no one picks up ownership of monitoring the outcome metrics. Maintenance costs quietly grow, absorbing an increasing share of the theoretical savings. By month 18, what looked like a strong ROI has become a much more complicated story.
The Business Sponsor Model
The most effective governance structure for goal-based automation is one where every automation initiative has a named business sponsor — not an IT owner, but a business leader who is accountable for the outcome metric the automation was designed to move. The business sponsor role is distinct from the technical owner. The technical owner maintains the automation. The business sponsor owns the goal.
When single ownership of an objective is established — one named person who is accountable for whether the metric moves — research on OKR governance consistently finds higher completion rates and better outcomes. The same dynamic applies to automation: diffuse accountability produces diffuse results. Clear accountability produces clear results.
The business sponsor should receive regular outcome reports (not activity reports), should flag when the underlying process is changing in ways that might affect automation logic, and should approve any scope changes that would redirect the automation away from its original goal. This is a lightweight governance responsibility, but its absence is one of the most common reasons automation value erodes.
Formal Value Assurance Reviews
In addition to business sponsor accountability, leading automation programs in 2026 are instituting formal value assurance reviews at six-month and twelve-month intervals. These reviews are not technical health checks — they are business value conversations. The question is not “is the automation running?” but “is the metric moving, and is it moving because of the automation?”
Value assurance reviews should include the business sponsor, a representative from finance (to validate cost and revenue impacts), and the technical owner. They should be brief (45-60 minutes) but rigorous: based on actual metric data, not narrative updates. And they should have a formal output: a documented conclusion about whether the initiative is delivering as expected, should be adjusted, or should be retired.
Portfolio-Level Governance
At the portfolio level, organisations with mature automation programs are moving toward a practice of treating their automation estate as a managed portfolio — one with explicit performance tracking, rebalancing logic, and investment criteria. Automations that are no longer delivering against their original goals should be retired or rebuilt, not maintained indefinitely out of inertia. Investment in new automations should be informed by the evidence base of what has worked, not just by what is technically feasible.
Portfolio governance also allows for the identification of “value leakage” patterns across the estate. If multiple automations are showing value erosion at the same point in their lifecycle, that is a signal worth investigating — it may indicate a systemic issue with data quality, process change management, or governance gap that affects many initiatives simultaneously.
Turning Measurement Into Momentum: The Cadence and Communication Model
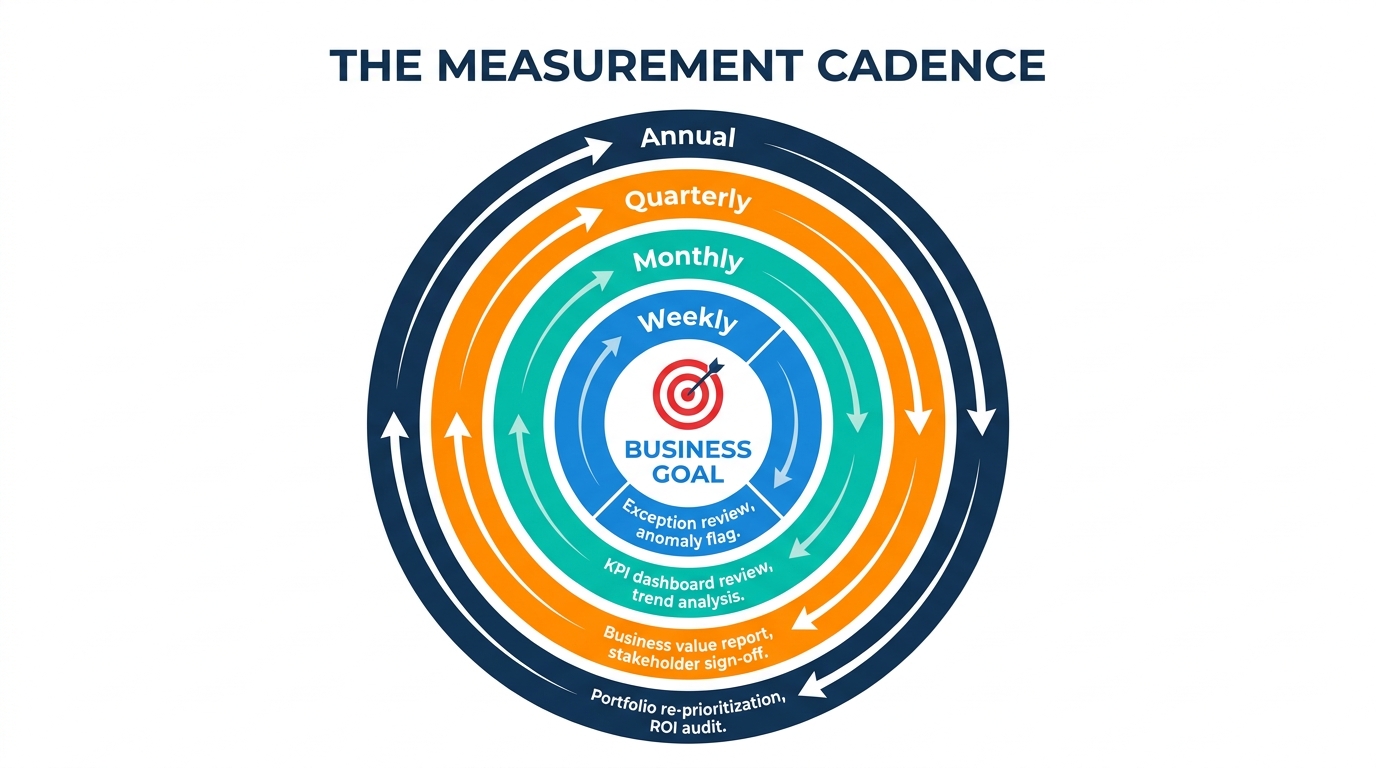
Having the right metrics and governance structure is necessary but not sufficient. The third ingredient is a communication cadence that keeps the evidence of automation value visible to the right people at the right times. Without this, even excellent measurement data sits in dashboards that no one reviews, and the program loses the organisational oxygen it needs to continue.
The Four-Frequency Model
Effective automation value communication operates on four different frequencies, each serving a different purpose and reaching a different audience:
Weekly exception review: The automation team reviews anomaly flags and performance exceptions. This is an operational check, not a business-value conversation. Its purpose is to catch technical drift or data quality issues before they become business problems. Audience: technical team and automation managers.
Monthly KPI dashboard review: Business sponsors review the outcome metrics for their initiatives. Are the target metrics moving? Is movement tracking toward the 6-month goal? Are there adjacent metrics showing unexpected changes? This is a 20-minute review of a single-page dashboard, not a meeting. Audience: business sponsors and functional leaders.
Quarterly business value report: A structured summary of outcomes across the automation portfolio, prepared for senior leadership. Each initiative gets a clear status: on-track, needs adjustment, or below expectations. Financial impact is expressed in P&L terms where possible. This is the moment to tell the program’s business story, and it is the most important communication artefact for securing continued investment. Audience: C-suite and senior operations leadership.
Annual portfolio audit: A comprehensive review of the entire automation estate — what is delivering, what has degraded, what should be retired, and what new goals should drive the next wave of investment. This resets the portfolio’s strategic alignment and should explicitly connect the automation roadmap to the organisation’s annual planning cycle. Audience: executive team and board (where relevant).
Making the Quarterly Report the Centrepiece
The quarterly business value report deserves particular attention because it is the primary mechanism for converting measurement into momentum. A good quarterly report has three components: backward-looking evidence (what metrics moved and by how much), a forward-looking narrative (what the trajectory suggests about the next quarter), and a decision prompt (what investment or action would accelerate progress or address underperformance).
The report should be designed for a senior audience with limited time — a one-page executive summary with supporting data available on request. It should use language that mirrors the organisation’s own KPI vocabulary, not automation-specific terminology. And it should be honest about underperformance as well as success. Programs that only report wins lose credibility quickly; programs that show a disciplined, data-honest approach earn trust over time.
Building the Business Case for More
One of the most powerful effects of a consistent measurement and communication cadence is that it builds an evidence-based pipeline for future investment. When an organisation can point to a quarterly report showing that three automation initiatives reduced accounts receivable cycle time by 11 days (translating to $1.2M in early-payment discounts captured), the conversation about funding the next four initiatives is categorically different from the one based on “we’ve saved 4,200 hours and deployed 16 bots.”
Evidence compounds. Each quarter of rigorous outcome reporting adds to a body of proof that makes the next budget conversation easier, the next initiative faster to approve, and the automation program’s position in the organisation more secure.
Case Patterns: How Goal-First Automation Is Playing Out in the Real World
Abstract frameworks are only as valuable as the real-world patterns they reflect. Across financial services, operations, and healthcare administration, a consistent set of patterns is emerging among organisations that have shifted to goal-first automation design.
Financial Services: From Processing Volume to Portfolio Yield
In financial services, one of the most significant shifts is moving the primary automation goal from “process more transactions” to “improve portfolio or operational outcomes.” The World Economic Forum’s 2026 AI playbook documents multiple banking examples where automation is explicitly tied to credit portfolio yield, non-performing loan ratios, and documentation accuracy — not just transaction volume. One case cites AI-enabled automation producing a 21% average portfolio yield with an NPL ratio held below 4%, compared to a pre-automation baseline where both metrics were tracked manually and inconsistently.
The pattern common to these cases is that financial services organisations started by identifying a risk or yield goal — something that mattered directly to credit officers and risk committees — and then built automation backwards from that goal to the data capture, classification, and exception-handling workflows that would influence it. They did not start by automating the most obvious data entry tasks and hope it would eventually affect portfolio quality.
Healthcare Operations: Cycle Time as the Strategic Goal
In healthcare administration, the goal-based pattern is most visible in prior authorisation and claims processing workflows. Organisations that have moved from general “automation of administrative tasks” to specific goals around authorisation turnaround time — expressed in days, not efficiency percentages — are reporting much more credible outcomes. When the goal is “reduce prior auth decision time from 8 days to 2 days,” the automation design that follows is naturally focused on the specific bottlenecks that create delay: document gathering, eligibility verification, clinical criteria matching. The activity metrics (documents processed, checks run) become footnotes to the outcome metric (days-to-decision), rather than the headline.
The WEF’s 2026 reporting also highlights productivity improvements of 20–59% in healthcare administrative and documentation tasks when automation is designed around specific time-reduction goals — with the important caveat that the range is wide precisely because goal specificity varies significantly across organisations.
Operations and Supply Chain: Error Rate as the Value Driver
In supply chain and logistics operations, several organisations have found that error rate — not speed — is the most strategically valuable goal to automate toward. A picking error in a distribution centre is not just a per-unit cost; it is a downstream cascade of customer complaints, returns processing, replacement orders, and supplier chargebacks. Organisations that set error-rate reduction as the explicit goal for warehouse and order management automation consistently report higher realised ROI than those that optimise for throughput speed, because the cascade cost of errors is far larger than most organisations have previously measured.
This is a case where baselining made the goal visible: teams that bothered to measure the full cost of a picking error — including downstream handling, customer service time, and return processing — found numbers significantly higher than expected, which changed the prioritisation calculus entirely.
Common Design Mistakes That Silently Erode Your Business Case
Even teams that understand goal-based design principles in theory make consistent mistakes in execution. These mistakes are worth naming explicitly because they tend to occur quietly, without obvious signals, until the value erosion they cause becomes hard to ignore.
Mistake 1: Automating a Broken Process
The most frequently cited failure pattern in 2026 automation research is automating a broken or inefficient process rather than redesigning it first. If a manual process has a 12% error rate because the underlying data is inconsistent, automating it will produce a faster 12% error rate. Automation amplifies existing process logic — it does not fix it. A goal-based approach catches this earlier because tracing the process back to a business goal surfaces the structural problems that are causing the metric to underperform, not just the steps that are slow.
Mistake 2: Confusing Capacity Created With Value Delivered
When automation creates capacity — hours, headcount, processing bandwidth — that capacity is potential value, not actual value. Actual financial value is only realised when the capacity is redeployed to something more productive, or when the need for additional hiring to cover growth is avoided. Reporting “we freed up 6,000 hours” without documenting what happened to those hours is not a business case — it is an estimate of an opportunity that may or may not have been captured. Goal-based design addresses this by setting explicit redeployment targets as part of the automation initiative, not as an afterthought.
Mistake 3: Orphaning Metrics After Launch
Many automation programs collect excellent baseline data, launch the automation, do a post-launch check at 30 or 60 days, declare success, and then stop measuring. The outcome metrics that were used to justify the initiative are abandoned once the build is complete. This is a governance failure that makes value erosion invisible until it is significant. The cadence model described earlier is the direct response to this pattern: measurement does not stop at launch; it becomes a regular discipline that continues for the life of the automation.
Mistake 4: Optimising at the Wrong Level
It is possible to improve a local metric while degrading a more important downstream one. Speeding up the invoice approval workflow might reduce AP cycle time — but if it creates a spike in incorrect approvals that requires manual rectification downstream, the net effect on cost and cycle time may be negative. Goal-based design guards against this by defining both the primary target metric and the adjacent metrics that should not be degraded, and by tracking both throughout the measurement period.
Mistake 5: Missing the Change Management Piece
Automation delivers value through people adopting and using the new workflows — routing work to the automated system, acting on its outputs, trusting its decisions. If the change management around an automation is weak, the technical system may be fully operational while the human process around it remains largely unchanged. Goal-based design includes adoption and utilisation as part of the measurement framework, not as an IT concern. If the metric is not moving, one of the first diagnostic questions should be: is the automation actually being used as designed?
Building an Automation Program That Earns Its Own Budget
The end state that goal-based automation design is aiming for is not a better slide deck or a more convincing ROI model. It is an automation program that earns its own budget renewal — one where the evidence of value delivered is so clear and consistent that the conversation shifts from “can we justify this investment?” to “how do we scale what is working?”
That end state is achievable, but it requires a different approach to design than most organisations are currently using. It starts with naming the business goal before touching any workflow. It requires building a real baseline from system data before any automation goes live. It demands a multi-dimensional view of value that speaks to different stakeholders in their own language. It needs governance that maintains accountability for outcomes — not just activity — over the full lifecycle of each initiative. And it depends on a communication cadence that converts measurement data into organisational momentum at the right intervals.
The Compounding Advantage
Organisations that make this shift do not just see better outcomes from individual automations. They build a compounding evidence base that changes how the organisation relates to automation as a discipline. Early evidence of goal-linked value creates the credibility to pursue higher-stakes, higher-value automation targets. Higher-value automations produce more compelling evidence. That evidence secures investment for more ambitious initiatives. The program becomes self-sustaining.
This is the meaningful difference between automation programs that require constant advocacy to survive budget cycles and those that are actively pulled forward by business leaders who have seen the evidence and want more. The path to the latter runs directly through goal-first design — not through bigger bots, more workflows, or better dashboards, but through the discipline of starting with the outcome and building backward from there.
Where to Start on Monday
If your automation program is currently built on activity metrics, the path forward does not require scrapping what exists. It requires adding the business goal layer that was missing from the original design. For each live automation, retroactively identify which business metric it was theoretically designed to move, find the nearest available baseline data, and begin tracking that metric going forward. You will not have a clean pre-automation baseline — that opportunity has passed — but you will begin accumulating the outcome data that makes the next conversation with leadership substantially more credible.
For automations still in design or planning, apply the reverse framework from the first step: name the goal, define the metric, establish the baseline, then design the workflow. The discipline is not complicated. The commitment to it, in the face of pressure to just build something and show activity, is where the real work lies.
The organisations pulling the most value from automation in 2026 are not the ones with the largest bot estates or the most sophisticated AI agents. They are the ones that started with the right question — what business outcome are we trying to move? — and had the patience to design everything else around the answer.