Most sellers who use TikTok Creative Center treat it like a trend magazine. They scroll through the Top Products tab, spot a few items with high impressions, and call it market research. Then they launch a product, scramble to find creators, and wonder why sales don’t materialise the way the numbers suggested they would.
The problem isn’t the data. The problem is the interpretation.
TikTok Creative Center is not a trend magazine. It’s a real-time signals intelligence platform — one that, if you know how to read it, will tell you not just what is trending, but where in the trend cycle a product sits, why a particular creative is converting, and which keywords are pulling buyers through to purchase rather than just views. That distinction matters enormously when you’re deciding whether to source inventory, brief a creator, or pass on a category entirely.
This post is not a walkthrough of the Creative Center’s interface. There are plenty of those. Instead, it’s a framework for thinking about the data differently — reading it the way a product strategist would, not just a content marketer. That means understanding heat momentum versus absolute popularity, distinguishing CTR signals from CVR signals, mapping trend data to sourcing timelines, and building a repeatable weekly system that keeps you ahead of the saturation curve rather than perpetually chasing it.
By the end, you’ll have a clear methodology for turning free, publicly available platform data into a genuine competitive edge — whether you’re launching your first TikTok Shop product or managing a portfolio of active SKUs.
What TikTok Creative Center Actually Is (And What It Isn’t)
Before diving into strategy, it’s worth being precise about what you’re actually working with when you log into Creative Center at ads.tiktok.com/business/creativecenter. Misunderstanding the data source leads to bad decisions, so clarity here matters.
The Data Source Is Paid Ads — Not Organic Content
This is the most important and most frequently misunderstood fact about Creative Center. Every metric in the Keyword Insights tool, every product ranking in the Top Products tab, and every ad you see in the Top Ads Dashboard is drawn from TikTok’s paid advertising ecosystem — not from organic videos.
This means when you see that “perfume” has 16,000 keyword searches and a 3.22% conversion rate, you’re not seeing how many organic TikTok users searched for perfume. You’re seeing how many paid ad creatives used that keyword, and how that keyword performed in paid contexts. It’s a fundamentally different signal — and in many ways, a more commercially useful one, because it reflects where brands and sellers are spending real money.
The practical implication: Creative Center data tells you what advertisers believe is working right now. When a product category is rising in the paid data, it means sellers are profiting enough from it to increase spend. That’s a stronger commercial signal than raw organic virality.
What Creative Center Is Made Of
The platform is divided into several distinct modules, each serving a different strategic purpose:
- Top Ads Dashboard — Searchable library of high-performing paid ads, filterable by region, industry, objective, ad format, and engagement metrics. Shows actual creatives you can study.
- Top Products — Rankings of product categories featured in TikTok ads, with metrics including popularity, popularity change (the “heat” indicator), CTR, CVR, average price, impressions, and estimated GMV. Filter by region, category, and time period.
- Keyword Insights — Trend data on keywords appearing in ad voice-overs, text overlays, and ad copy. Metrics include popularity, popularity change, CTR, CVR, CPA, impressions, and engagement rates (likes, shares, comments). Filterable by region, industry, objective, and keyword type.
- Trend Discovery — Real-time data on rising hashtags, songs, creators, and videos. Particularly useful for cultural timing and content briefing.
- Creative Tools — AI-assisted creative resources, best practices documentation, and inspiration templates. Less relevant for product strategy, more relevant for production.
You can access most of the platform without a login, though some features require a free TikTok for Business account. The full suite is desktop-only — mobile access is limited and not suitable for serious research.
The Strategic Frame: Use It as a Demand Signal Layer
The right mental model for Creative Center is as a demand signal layer that sits between raw cultural conversation (organic TikTok) and actual purchasing behavior (TikTok Shop sales data). It tells you where commercial attention is concentrating before that attention peaks — which is exactly the window you want to be operating in.
Treat it as one input, not a single source of truth. The sellers who misuse it tend to treat a high-impression product as a buy signal on its own. The sellers who profit from it cross-reference what they see in Creative Center with their own sales data, creator engagement metrics, and supplier availability. The platform gives you the direction; you have to supply the judgment.
The Top Products Tab — Reading Heat Before It Peaks
The Top Products tab is where most sellers spend most of their time in Creative Center. Used correctly, it’s genuinely powerful. Used incorrectly — which is the default — it leads sellers straight into saturated categories.
Popularity vs. Popularity Change: The Crucial Distinction
The tab shows two metrics that most sellers conflate: Popularity and Popularity Change. These are not the same signal, and confusing them is the single most common mistake in Creative Center research.
Popularity is an absolute measure — essentially the volume of ad activity and engagement a product category is generating right now. A high popularity number means lots of advertisers are spending on this product, lots of impressions are being served, and lots of users are engaging. It sounds like a buy signal. It often isn’t.
Popularity Change — the heat trend indicator — is the directional measure. It tells you whether popularity is rising, flat, or declining relative to the previous period. This is the signal that matters for entry timing.
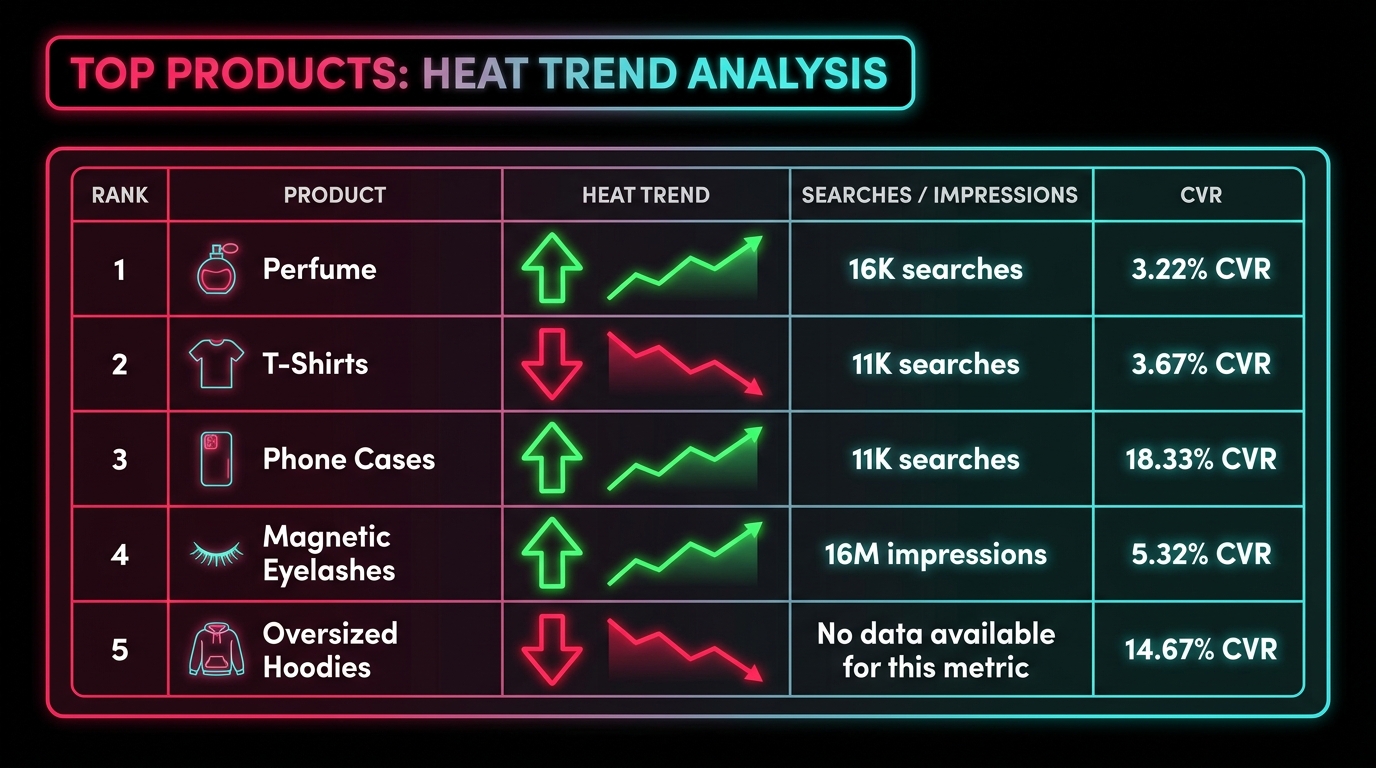
Consider the data from early 2026: Perfume showed 16,000 in popularity (the highest tracked), but a popularity change of -11%. That’s a declining trend in an already-crowded category. Meanwhile, a product with 4,000 in popularity but a +28% popularity change represents an accelerating opportunity — fewer competitors, more headroom, better timing for a new entrant.
The actionable rule: sort by Popularity Change, not Popularity, and prioritise rising trends over high-volume ones.
CVR vs. CTR: Two Different Problems
The Top Products tab also shows both click-through rate and conversion rate by category, and they measure completely different things.
CTR (Click-Through Rate) tells you how compelling the creative is — how good the hook is, how well the video stops the scroll. A high CTR means the content is getting attention.
CVR (Conversion Rate) tells you how well the product converts once someone clicks through. A high CVR means the product itself, the offer, and the landing experience are persuasive enough to trigger purchase.
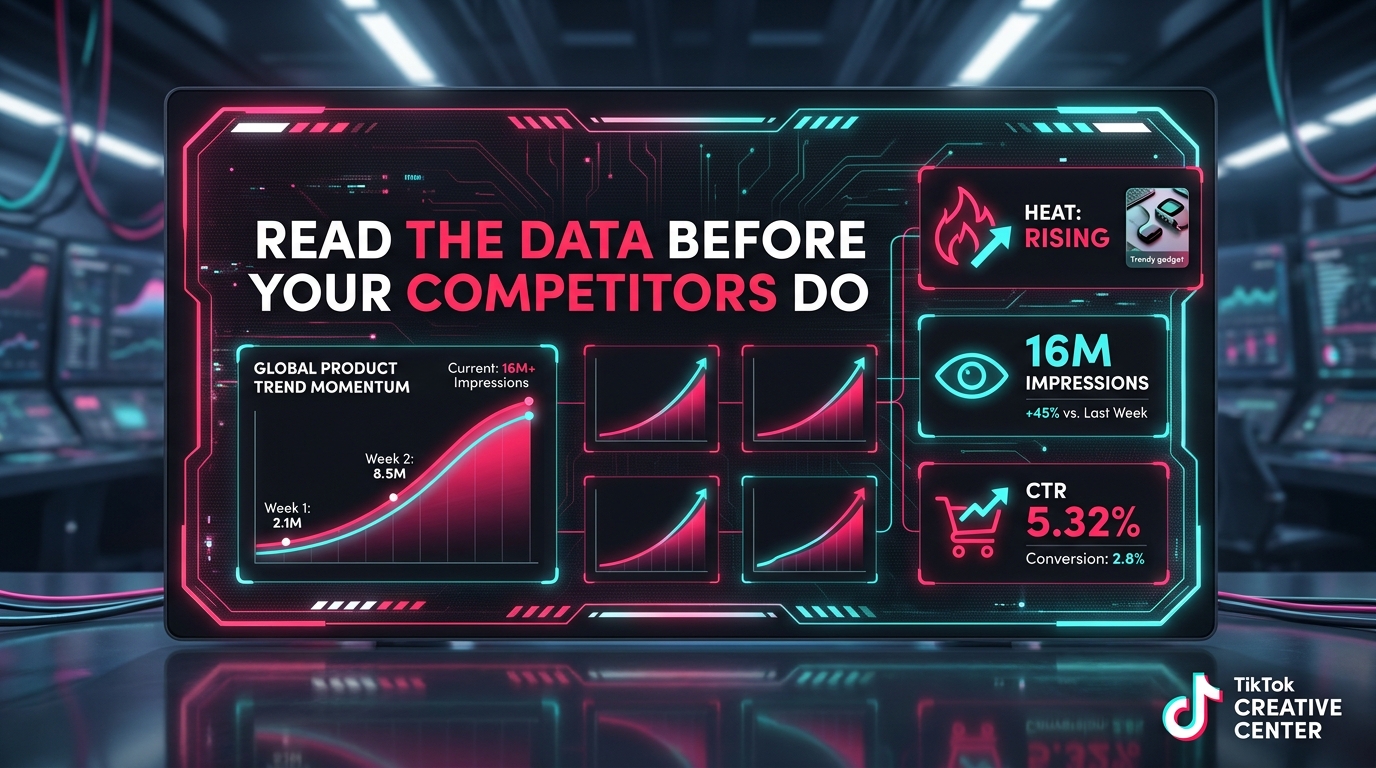
The most valuable products in the Top Products data are those with strong CVR — because that signals genuine purchase intent, not just curiosity. Magnetic eyelashes, for example, showed a 5.32% CVR alongside 16 million impressions in Q1 2026. Oversized graphic t-shirts showed an even higher 14.67% CVR. Phone cases and stickers showed an 18.33% CVR in some datasets.
High CVR with modest impressions is an underrated signal — it means fewer sellers have discovered the category yet, but the ones who have are converting well. That’s the sweet spot for a new entrant.
How to Filter for Genuine Opportunity
The default view of Top Products is global, which is not useful for most sellers. Here’s the filter configuration that actually produces actionable data:
- Set region to your target market — US, UK, or whichever country you’re selling into. Global data averages out the signal and obscures regional demand patterns.
- Set time period to 7 days first, then cross-check against 30 days. Seven-day data shows what’s moving right now; 30-day data shows whether that movement is sustained or a one-day spike.
- Sort by Popularity Change (descending). You want to see what’s accelerating, not what’s already dominant.
- Filter by your category if you have a defined niche. If you’re open to multiple categories, scan the full list before narrowing.
- Cross-reference CVR. Any product category showing rising heat AND a CVR above 3% deserves serious attention.
This five-step filter takes roughly ten minutes to run. Done weekly, it produces a shortlist of 3–5 product categories that merit deeper investigation every single week.
Keyword Insights — The Hidden Layer Most Sellers Never Touch
The Keyword Insights tool is the least-used and most strategically valuable section of Creative Center. While most sellers are looking at what’s trending in products, the Keyword Insights tab shows you what language is driving that commercial activity — which is a significantly more granular and actionable signal.
What Keyword Insights Actually Measures
The tool analyzes keywords that appear across three locations in TikTok ads: voice-overs, text overlays, and ad copy text. Each keyword is scored across multiple dimensions:
- Popularity — The number of ad creatives using this keyword. A proxy for how widely adopted the language is among active advertisers.
- Popularity Change — Whether usage is accelerating or declining. The directional signal for emerging language patterns.
- CTR — How well ads using this keyword are stopping the scroll and driving clicks.
- CVR — How well ads using this keyword are converting those clicks into purchases.
- CPA (Cost Per Acquisition) — What it’s costing advertisers to acquire a customer using this keyword. Lower CPA with rising popularity is a strong signal of commercial efficiency.
- 6-Second View Rate — The percentage of users who watch at least six seconds of an ad featuring this keyword. Relevant for evaluating hook strength.
You can filter by region, industry, objective (traffic, conversion, app install, etc.), keyword type (voice, overlay, copy), and time period. The table view shows up to 500 keywords ranked by your chosen metric; a wordcloud view gives a faster visual scan.
The Two-Column Strategy: CTR Keywords vs. CVR Keywords
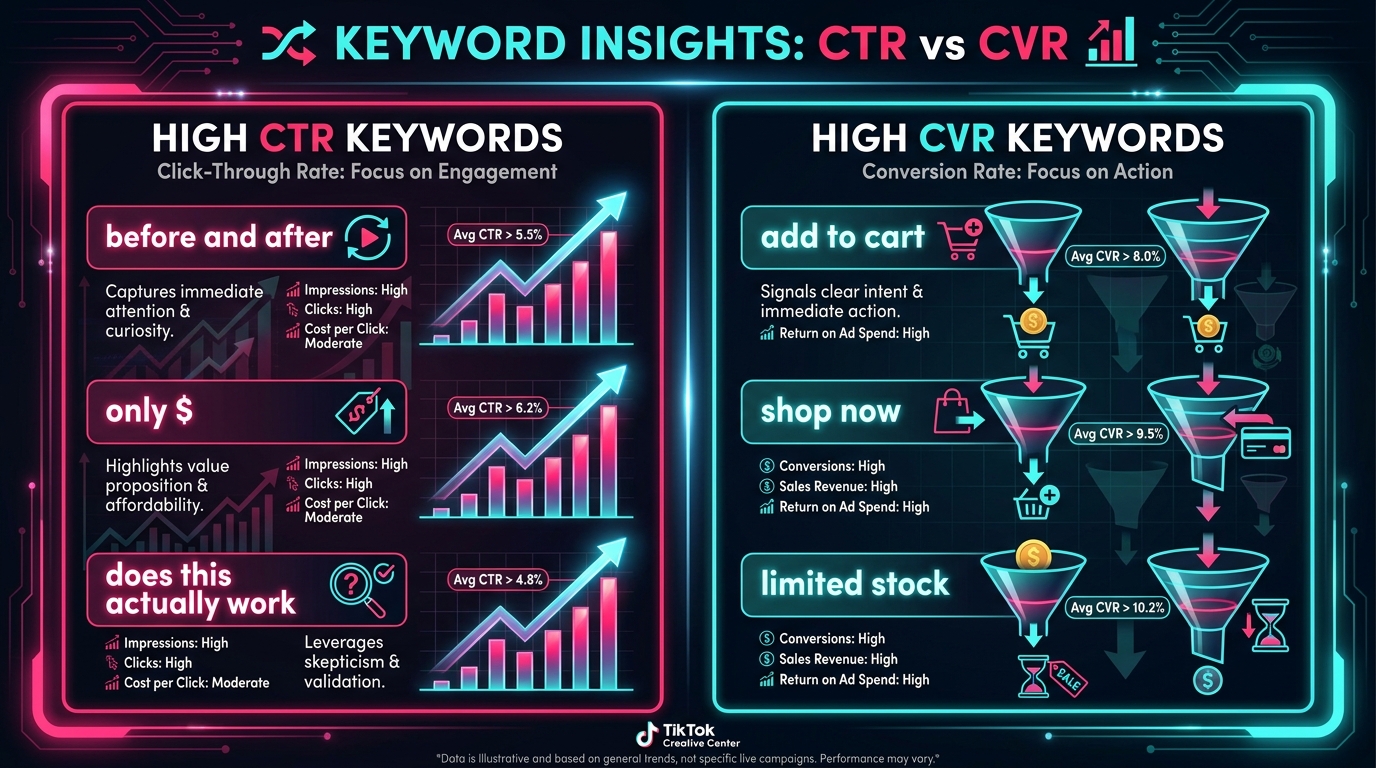
The single most valuable analytical move in Keyword Insights is separating your research into two distinct columns: keywords that drive high CTR and keywords that drive high CVR. These serve different purposes in your creative strategy.
High-CTR keywords are hook builders. They’re the phrases and language patterns that make someone stop scrolling and pay attention. Examples that consistently perform well include phrases built around curiosity gaps (“does this actually work?”), price reveals (“only $12”), transformation promises (“before and after”), and urgency triggers (“sold out last time”). These keywords tell you what to say in your opening 3 seconds.
High-CVR keywords are closer keywords. They appear later in the creative — in the CTA, the overlay text, the offer framing — and they’re what actually tips someone from interested to purchasing. Phrases involving social proof, scarcity, specificity of benefit, and direct action language tend to dominate here.
When you brief a creator or write ad copy, use this distinction deliberately. Your hook should be drawn from high-CTR keyword patterns. Your offer articulation and CTA should be drawn from high-CVR keyword patterns. Most sellers use keywords haphazardly without understanding this functional separation.
Using Popularity Change to Spot Emerging Language
The Popularity Change metric in Keyword Insights has a use case that most sellers completely miss: it can tell you when a new type of content is beginning to work before any specific product has gone viral.
If you’re scanning keywords sorted by popularity change and you notice a cluster of related phrases — say, several keywords related to “routine” content or “comparison” formats — all rising simultaneously, that’s a signal that a content format is gaining traction. That content format will soon power a wave of product launches. Sellers who spot this language shift before the products catch up can prepare their creative briefs in advance and launch into the wave rather than scrambling to catch it.
In practical terms: do a keyword scan not just within your product category, but across adjacent categories. Patterns in one niche often migrate to adjacent ones within 2–4 weeks.
Seasonal Keyword Spikes and Inventory Planning
Keyword Insights also shows seasonal demand patterns with enough lead time to be useful for inventory planning. Historical data shows that terms like “graduation gifts” spike consistently between April and June; terms like “back to school” accelerate from late July; Q4 gifting vocabulary begins picking up pace in late September.
By tracking these patterns annually and setting 30-day and 120-day lookback comparisons in the tool, you can build a keyword-based demand calendar that informs when to place inventory orders rather than reacting to demand after it’s already peaked.
The Top Ads Dashboard — Reverse-Engineering What’s Working Right Now
If the Top Products and Keyword Insights tabs tell you what is converting and which language is driving that conversion, the Top Ads Dashboard tells you how the winning creatives are actually structured. It’s the most direct competitive intelligence resource available to TikTok sellers, and it’s completely free.
What You Can Access
The Top Ads Dashboard is a searchable library of high-performing paid TikTok ads. You can filter by:
- Brand or keyword — Search a competitor’s brand name to see their top-performing ads directly
- Industry — Narrow to your niche (e.g., Beauty, Fashion, Consumer Electronics, Health)
- Region — Target the market you’re selling into
- Objective — Filter for conversion-focused ads (most relevant for product sellers) vs. awareness or traffic objectives
- Ad format — Spark Ads, TopView, In-Feed Ads, etc.
- Metrics — Sort by impressions, likes, CTR, or engagement rate
You can view the actual creative, play the video, and see its performance breakdown. For each ad, you can see the hook structure, the on-screen text, the offer, the CTA, and the overall pacing of the content.
A Framework for Competitive Ad Analysis
Don’t just watch the ads. Analyse them systematically. For each high-performing ad in your category, document:
- The hook (first 3 seconds) — What is the opening image or statement? Is it problem-first, curiosity-first, or result-first? Does it use text overlay in the first frame?
- The proof structure — How does the ad build credibility? User-generated content style, before/after, testimonial, demo, talking head?
- The offer framing — How is the price positioned? Is there urgency? Is the offer specific (“buy 2 get 1 free”) or generic (“shop now”)?
- The CTA — What exact language is used, where does it appear in the video, and is there a visual reinforcement (overlay text, button)?
- Video length and pacing — How long is the ad? Does it cut quickly or build slowly? Is there a narrative arc or a rapid-fire demo structure?
After analyzing 10–15 top ads in your category, patterns will emerge. You’ll see the same hook structures appearing repeatedly in high-performers, the same proof formats, the same offer framing. Those patterns are not coincidences — they’re what the TikTok audience has demonstrated it responds to in your niche. That’s your creative brief, grounded in actual platform performance data rather than guesswork.
The “Inspired By, Not Copied From” Principle
There’s a legitimate concern about using competitor ad data this way: you don’t want to copy. And you shouldn’t. The value of Top Ads analysis is not reproducing what’s already out there — it’s understanding the structural principles that make those ads work, and then applying those principles to your own product story.
If you see that every high-performing ad in your category opens with a problem statement followed by an immediate visual transformation, that’s the structural principle. Your creative should also open with a problem statement and show transformation — but your specific problem, your specific transformation, your specific product. The structure is the insight. The execution must be yours.
Brands like e.l.f. Cosmetics have demonstrated this principle at scale. When an organic video of a user mixing e.l.f.’s Camo Concealer with moisturizer went viral, e.l.f. didn’t just amplify the trend — they used the signal to create a new product (the Halo Glow Tinted Moisturizer), featured the original creator, and built a campaign around the exact creative structure the audience had already shown it loved. The result: repeated sellouts and over $20 million in sales. The structural insight came from watching what worked. The execution was entirely theirs.
Trend Discovery — Songs, Hashtags, and the Cultural Pulse
The Trend Discovery section of Creative Center is the most temporally sensitive part of the platform. Where Top Products and Keyword Insights operate on 7-to-120-day windows, Trend Discovery captures what’s happening right now — and in some cases, what’s about to happen in the next 24–72 hours.
The Four Signals in Trend Discovery
The tab surfaces four types of trending content signals simultaneously:
Trending Hashtags measure the velocity of content creation and consumption around specific topic tags. The key distinction here is between “Popular” hashtags (already widely used, high competition) and “Rising” hashtags (accelerating quickly from a lower base, more open entry). For product strategy, Rising hashtags are almost always more valuable than Popular ones because they represent the early-adoption phase of a content moment.
Trending Songs might seem irrelevant to a product seller, but they’re not. When a particular audio track starts accelerating in Trend Discovery, it signals a content format or emotional register that’s resonating right now. Products that get paired with trending audio in their organic or paid content benefit from algorithmic amplification — TikTok actively distributes content that uses rising audio because it keeps the platform culturally current. Briefing creators to use specific trending tracks is not a trivial creative decision; it’s an algorithmic one.
Trending Creators shows which content creators are growing most rapidly. For seller-creator partnerships, this is a more useful signal than a creator’s absolute follower count. A creator at 150,000 followers with 40% week-over-week growth in views is almost certainly a better bet for a product partnership than a creator at 2 million followers whose growth has plateaued. The rising creator’s content is getting algorithmic tailwind — yours will too if you partner with them at the right time.
Trending Videos shows the specific pieces of content getting the most traction right now. Use these not to understand what individual videos are succeeding, but to identify the format patterns they share. If multiple trending videos in a single week share the same thumbnail style, the same caption structure, or the same content format (e.g., “POV: you tried X”), that format is what the algorithm is currently rewarding.
Trend Perspectives: The Predictive Layer
Creative Center also includes a “Trend Perspectives” feature that aggregates behavioral signals to flag cultural moments before they’ve fully surfaced. This is less granular than the other tabs but valuable as a weekly temperature check. Sellers who check Trend Perspectives at the start of each week often get 3–5 day advance warning of the content moments that will dominate the following week’s organic feed — time enough to brief a creator, adjust a campaign, or align a product launch.
The Three Macro Trends Shaping TikTok Commerce in 2026
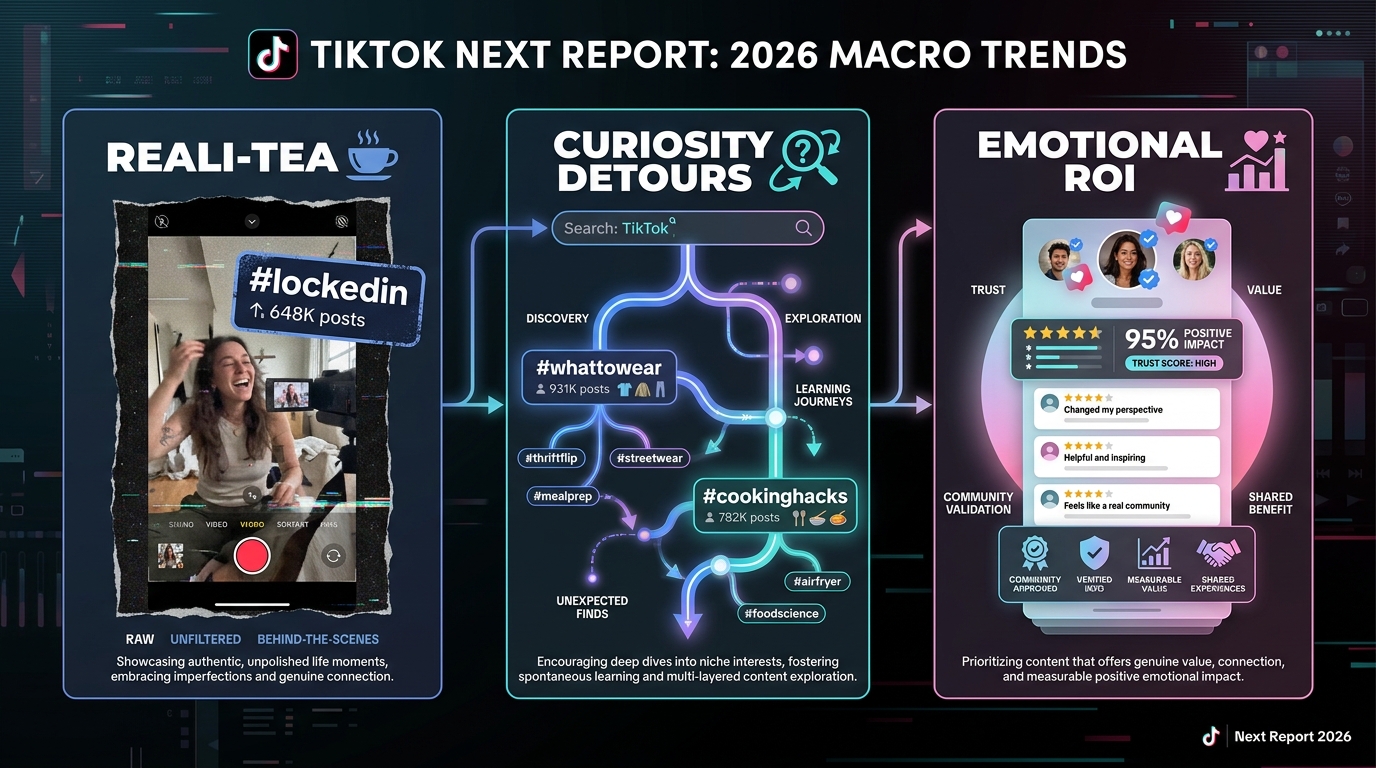
Reading individual product trends and keywords in Creative Center is a tactical exercise. But the sellers who build durable competitive advantages on TikTok are also operating at a strategic level — understanding the macro behavioral shifts that govern which content resonates, which products sell, and which creators build trust with audiences. TikTok’s official Next 2026 Trend Report, released in February 2026, identified three macro trends that are reshaping how TikTok users discover, evaluate, and buy products.
Macro Trend 1: Reali-TEA
The platform’s own research describes “Reali-TEA” as a shift toward unfiltered, behind-the-scenes, honest content — away from polished aspirational aesthetics and toward raw process documentation. The numbers bear this out: the hashtag #lockedin accumulated 648,000 posts; #hygiene reached 692,000 posts — both examples of content where users document real, unglamorous routines rather than highlight reels.
For product sellers, this has a direct creative implication. Content that shows the product working in a real, imperfect context — in a messy bathroom, on a tired face, during an actual workout — is outperforming studio-quality product videos. The audience has developed a sophisticated filter for authenticity, and overly polished creative is increasingly read as inauthentic rather than professional.
Practical translation: brief your creators to show the product being used in their actual life, including the friction. A skincare product that looks good being applied in a real bathroom mirror is more persuasive than the same product in a clinical, perfectly lit environment. This isn’t an aesthetic preference — it’s a conversion signal. The Reali-TEA audience buys things they see working in conditions they recognise.
Macro Trend 2: Curiosity Detours
“Curiosity Detours” describes the shift from passive consumption to active, search-driven discovery. TikTok users in 2026 are increasingly using the platform as a search engine — entering specific queries, following discovery rabbit holes, and making deliberate decisions about what information they want to find. The data supports this shift dramatically: #whattowear accumulated 931,800 posts; #cookinghacks reached 782,200 posts — both examples of intentional discovery content.
For product strategy, this means that search-optimised TikTok content is now a legitimate acquisition channel, not just an organic growth tactic. Products that have clear, specific use-case language in their video captions, creator voice-overs, and overlay text will surface in TikTok search results for users who are actively looking for solutions. This is a fundamentally different kind of intent than the impulse-buy audience. A user who found your product by searching “#whattowear for a work trip” is already in a decision-making mode — the bar for conversion is lower.
When you use Keyword Insights in Creative Center, the Curiosity Detours trend should influence which keyword types you prioritise. Question-format keywords and solution-specific phrases that mirror actual search queries will increasingly drive both organic reach and paid ad performance.
Macro Trend 3: Emotional ROI
“Emotional ROI” describes a shift toward intentional, value-conscious purchasing — buying things because they genuinely improve daily life, rather than impulse purchases driven by entertainment. This is partly a response to economic pressure and partly a maturation of the TikTok shopping audience. Hashtags like #cafeathome reflect purchases that replace a recurring expense with a product investment — a psychologically distinct kind of buying that’s less price-sensitive but more proof-dependent.
For sellers, this changes what kind of social proof is most effective. User reviews, community validation, and honest performance demonstrations are outperforming promotional language. The Emotional ROI buyer wants to see evidence that this purchase will deliver lasting value — not just a moment of excitement. Content that shows the product in the context of a real lifestyle routine, with an explicit comparison to the alternative cost or effort, tends to perform best with this audience segment.
All three macro trends point in the same direction: TikTok’s commerce audience is becoming more discerning, not less. The sellers who adapt their product selection and creative strategy to these shifts will compound their advantage. Those who continue optimising for impulse-buy mechanics alone will find diminishing returns as the platform’s purchasing behaviour matures.
Product Entry Timing: The Framework No One Talks About
Understanding which products are trending is only half of the strategic equation. The other half — and the half that directly determines your profit margin — is when you enter the trend relative to its lifecycle. Creative Center data, read correctly, gives you enough signal to make this timing decision with more precision than most sellers realise.
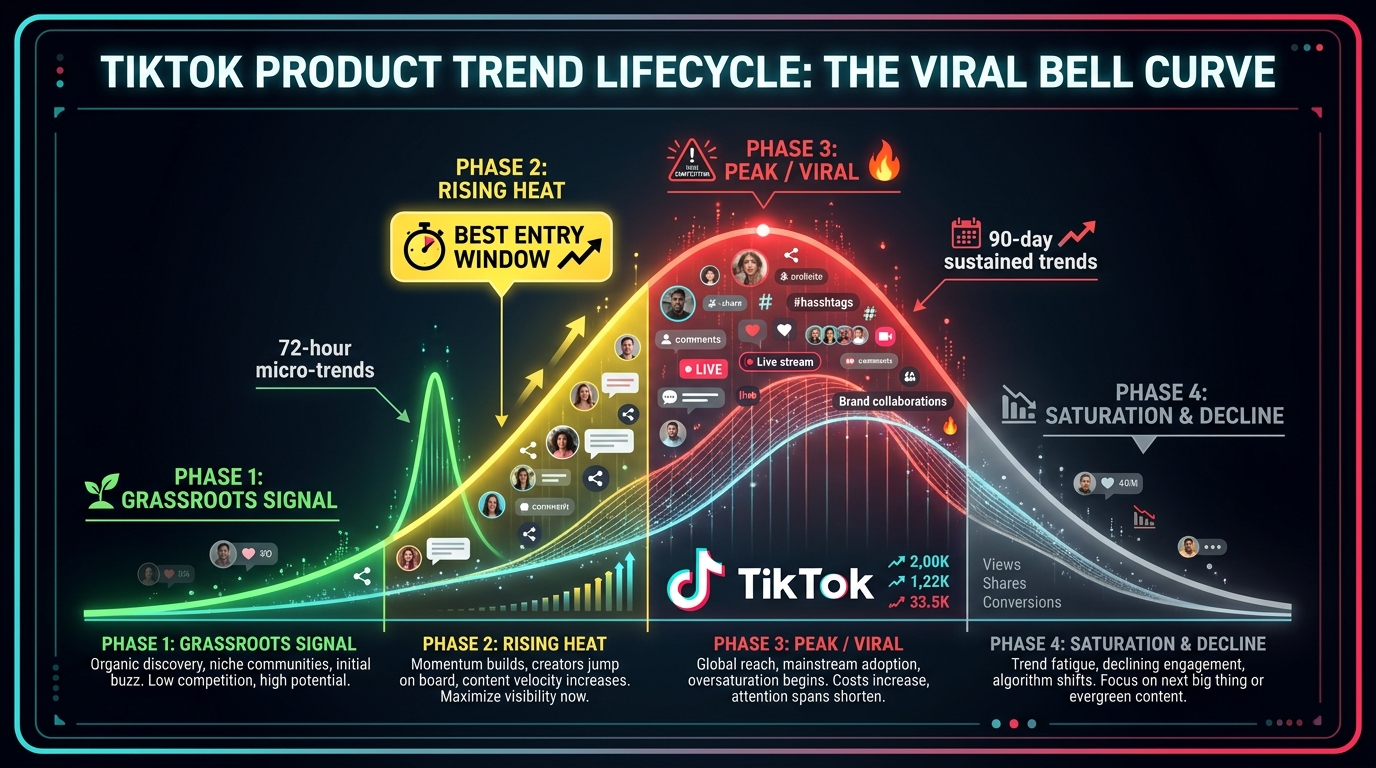
The Four Phases of a TikTok Product Trend
TikTok product trends typically follow a recognisable bell curve, but the timeline varies significantly by product type:
Phase 1 — Grassroots Signal (Days 1–3): A product starts appearing organically in user-created content. Engagement is disproportionately high relative to the creator’s follower count. At this stage, Creative Center won’t yet show significant data — the signal is too early. You’ll see it in organic search, comment sections, and early affiliate activity before it surfaces in paid metrics.
Phase 2 — Rising Heat (Days 4–14 for micro-trends; Weeks 2–6 for sustained trends): This is when Creative Center data starts showing meaningful signals. Popularity Change turns positive. The first wave of advertisers enters the category. CVR is often at its peak because supply is still limited relative to demand, and the creative is fresh enough to convert without oversaturation. This is the ideal entry window for most product sellers.
Phase 3 — Peak / Viral (Weeks 3–8): High absolute popularity, but Popularity Change is plateauing or beginning to decline. The category is now crowded with advertisers; CPA is rising; creative fatigue is setting in. New entrants at this phase face elevated ad costs and increased competition. Sellers who entered in Phase 2 are now harvesting the returns they built early.
Phase 4 — Saturation and Decline (Weeks 8+): Popularity Change is negative. Multiple low-cost competitors have flooded the category. Organic creator content around the product is repetitive and generating diminishing engagement. CPAs are high. This is when you see products like crochet accessories declining 23% in sell-through rates even as they’re still widely available. Entering Phase 4 is almost always a mistake unless you have a significant brand differentiation or cost advantage.
How Creative Center Maps to Each Phase
The practical mapping of Creative Center signals to these phases:
- Phase 2 signal in Creative Center: Popularity Change is strongly positive (e.g., +25% or more on 7-day view), CVR is above category average, CPA is below category average, and fewer than 5–10 competing ads are visible in the Top Ads Dashboard for this product specifically.
- Phase 3 signal: High absolute popularity, Popularity Change has slowed to single digits or gone flat. Top Ads Dashboard shows 20+ competing creatives for this exact product. CPA trending upward.
- Phase 4 signal: Popularity Change is negative. Category still shows in Top Products but with declining metrics across the board. Multiple price-competing ads visible.
The Inventory Timing Problem
The challenge for physical product sellers is that by the time Phase 2 signals appear clearly in Creative Center, there may be 3–6 weeks of sourcing lead time between you and actually having product to sell. This is where the data needs to interact with your supply chain reality.
Sellers who handle this well maintain a shortlist of 8–12 product categories they’re monitoring in Creative Center at any given time — not yet committed, but watching. When any of these moves from Phase 1 signals (appearing in organic content but not yet in paid data) into early Phase 2 signals (beginning to show in Creative Center), they already have supplier relationships and can compress sourcing timelines dramatically. The research work is done before the opportunity appears — which is the only way to actually enter at Phase 2 instead of Phase 3.
Building a Weekly Creative Center Research System
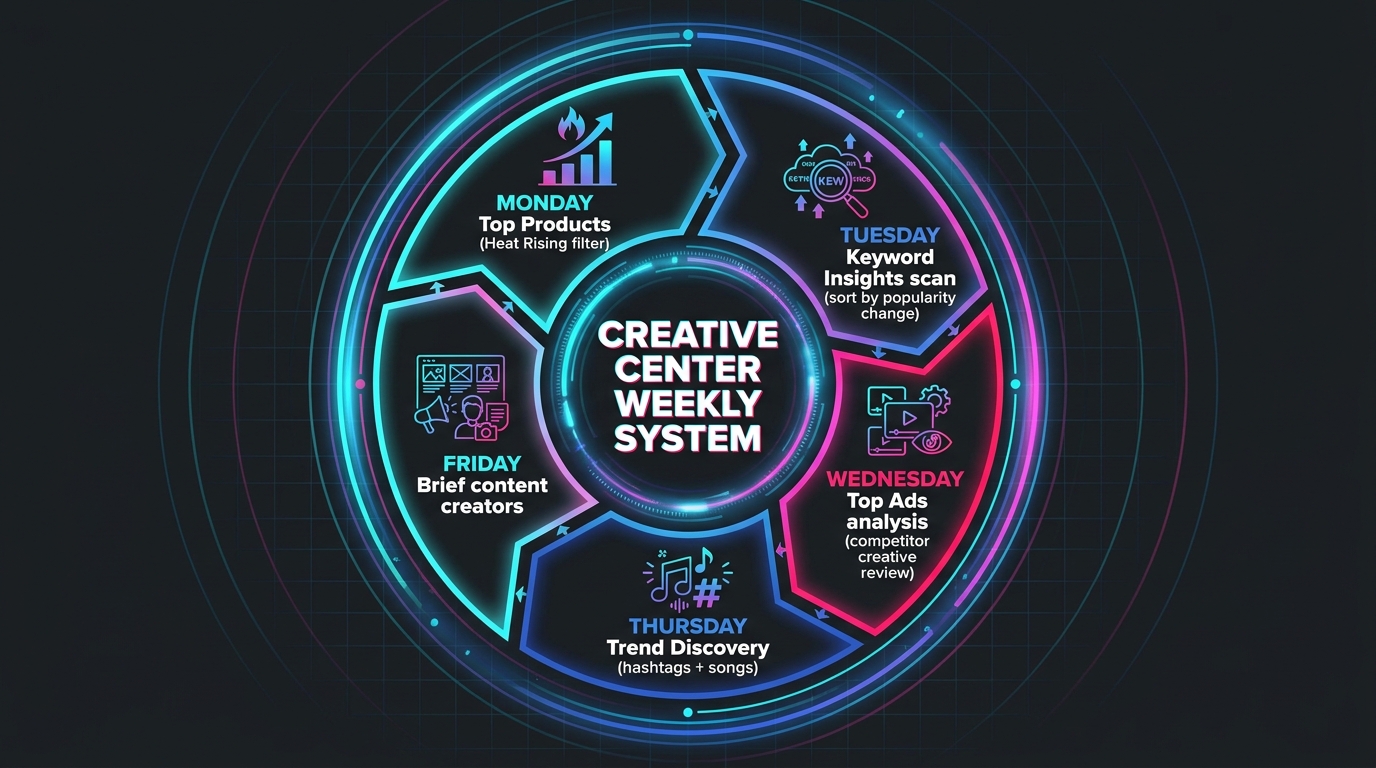
All of the above is only useful if it becomes a systematic, repeatable practice rather than an ad-hoc activity you do when you remember to. The sellers who extract consistent value from Creative Center run it as a structured weekly intelligence process, not a once-in-a-while exploration. Here’s a practical system you can implement starting this week.
Monday: Top Products Heat Scan (20 minutes)
Open Creative Center and navigate to Top Products. Set your region filter, switch to 7-day view, and sort by Popularity Change descending. Scan the top 20 results. Note any product categories showing:
- Popularity Change above +20%
- CVR above 3%
- Average price in the $12–$45 range (the TikTok Shop impulse-buy sweet spot)
Add any qualifying categories to your “watching” list. If any categories on your existing watching list have dropped below 0% in Popularity Change, remove them. This session should produce a concrete shortlist update, not just a list of observations.
Tuesday: Keyword Insights Deep Dive (25 minutes)
Navigate to Keyword Insights. Filter for your target region and set the time period to 30 days. Sort by Popularity Change descending. Your goal is to identify:
- Any keyword clusters (3 or more related phrases) rising simultaneously — these signal an emerging content format or product category
- Keywords with high CVR but lower popularity — underused language that converts well is worth incorporating into your next ad brief
- Seasonal keyword acceleration — compare 7-day vs. 30-day data to spot annual patterns repeating
Document any keyword findings in a running creative brief document. These will directly inform the language you use when briefing creators or writing ad copy.
Wednesday: Top Ads Competitive Review (30 minutes)
Navigate to Top Ads. Filter for your industry/category and region. Sort by Likes (a proxy for engagement and shareability). Watch the top 10 ads in your category. For each, document the five-point framework outlined earlier: hook, proof structure, offer framing, CTA, and pacing.
At the end of the session, identify the single most important creative structural insight you didn’t have before this week. This becomes an actionable brief item for your creative team or creator partners.
Thursday: Trend Discovery Pulse Check (15 minutes)
Navigate to Trend Discovery. Review Rising hashtags in your category. Note any audio tracks rising rapidly. Check if any trending creators are in adjacent niches where a partnership might make sense for your product. Flag anything relevant for your content calendar or creator outreach.
Friday: Brief Update and Output
Consolidate the week’s findings into a one-page brief: updated product watching list, this week’s keyword findings, creative structural insight from Top Ads, and any cultural timing notes from Trend Discovery. Share this with any creators, content team, or sourcing partners who need to act on it.
Total weekly time investment: approximately 90 minutes. The output is a structured intelligence brief that reduces guesswork and keeps your product and creative decisions grounded in current platform data. Most of your competitors are not doing this systematically — which means you have a compounding informational advantage every week you run this process.
The Mistakes That Kill Creative Center Strategy
The framework above works — but only if you avoid the common failure modes that cause most sellers to either dismiss Creative Center as unhelpful or use it in ways that actively mislead their decisions. These are the patterns that come up repeatedly.
Mistake 1: Using Global Data Instead of Regional Data
The default view in Creative Center is global. Global data is almost never useful for product strategy because it averages demand signals across wildly different markets, price sensitivities, and cultural contexts. A product trending in Southeast Asia will show up in global data the same way a product trending in the US does — but your sourcing, pricing, and creative decisions are entirely different for each market. Always filter to your specific selling region before drawing any conclusions from the data.
Mistake 2: Treating High Impressions as a Buy Signal
Impressions measure exposure, not demand. A product with 82 million impressions (like perfume in early 2026 data) is getting a lot of advertising attention — but that attention may reflect incumbents defending an existing market position as much as a growing opportunity for new entrants. High impressions with declining Popularity Change is a category to exit, not enter. Always pair the impressions figure with directional momentum before making sourcing decisions.
Mistake 3: Ignoring the Time Period Settings
Creative Center allows you to filter by 7, 30, and 120-day windows. Most sellers leave it on the default and look at a single time horizon. This misses critical context. A keyword or product that looks flat over 30 days might be exploding over the last 7 — and vice versa. Always run a quick comparison between your primary time window and a shorter one to understand whether you’re looking at a steady trend or a recent spike. They require different strategic responses.
Mistake 4: Copying Ad Creative Instead of Principles
The Top Ads Dashboard is a creative intelligence resource, not a swipe file. Sellers who watch a competitor’s top-performing ad and try to reproduce it closely enough to replicate results consistently produce inferior outcomes — partly because the audience has already seen that creative, and partly because the product story and brand voice won’t transfer authentically. Use Top Ads to extract principles, not templates. The structural insight is portable; the specific creative is not.
Mistake 5: Treating Creative Center as a Standalone Research Tool
Creative Center is paid ads data. It tells you what the advertising layer of TikTok is doing. It doesn’t, on its own, tell you what organic content is generating buzz, what the comment sections of popular videos reveal about purchase hesitation, or what’s happening in TikTok Shop’s own affiliate and Opportunity Center data. Treat Creative Center as one layer of a multi-source research process. Supplement it with organic scroll research in your category, TikTok Shop’s Seller Center data, and direct creator feedback to get a complete picture.
Mistake 6: Running the Research Once and Not Updating It
TikTok moves fast. A trend that looks strong on Monday can begin saturating by the following Wednesday. Sellers who do a thorough Creative Center deep-dive once a month and then operate on stale data are consistently a week or two behind the actual market. The weekly cadence described in the previous section isn’t perfectionism — it’s the minimum update frequency required to make Creative Center data actionable rather than historical.
Putting It All Together: From Data to Decisions
The competitive advantage of TikTok Creative Center isn’t access — it’s free and open to anyone. The advantage is in how systematically and precisely you read the signals it contains.
To summarise the strategic framework built across this piece:
- Understand what the data actually measures. Creative Center reflects paid advertising behavior, not organic virality. That makes it a commercial signal, not a cultural one — which is exactly what product decisions require.
- Prioritise Popularity Change over absolute Popularity. Rising heat in a smaller category beats declining heat in a dominant one, every time, for a new entrant.
- Separate CTR and CVR signals. They’re measuring different things and should inform different parts of your creative — the hook and the close are not the same creative problem.
- Use Keyword Insights for language intelligence, not just keyword lists. Rising keyword clusters signal format shifts before product trends fully emerge.
- Analyse Top Ads for structural principles, not execution templates. The framework is portable; the specific creative is not.
- Map your findings to the trend lifecycle. Phase 2 entry is where you make money. Phase 3 entry is where you break even. Phase 4 is where you lose.
- Understand the three 2026 macro trends. Reali-TEA, Curiosity Detours, and Emotional ROI are the behavioral backdrop that determines which creative structures and which product categories will sustain commercial traction through the rest of 2026.
- Build the weekly system. Ninety minutes per week, run consistently, compounds into a significant informational advantage over sellers who research sporadically.
None of this requires a large budget, a data science team, or proprietary tools. It requires discipline, a clear analytical framework, and the patience to read signals carefully instead of reacting to surface-level numbers.
The sellers who build enduring TikTok businesses aren’t the ones who get lucky with a viral product. They’re the ones who read the platform’s own data more carefully than everyone else, and act on what they find before the window closes.
The data is free. The competitive edge comes from reading it differently.