There’s a pattern that shows up in nearly every Amazon advertising account that struggles to scale: the entire budget is concentrated at the bottom of the funnel. Sponsored Products campaigns eating 80–90% of total ad spend. Branded defense campaigns running on autopilot. A Sponsored Brands creative that hasn’t been refreshed in eight months. And somewhere in the console, a Sponsored Display campaign quietly bleeding money with no defined purpose.
The account isn’t broken in the obvious sense — it’s still generating sales. But growth has plateaued, new-to-brand acquisition is flat, and every time CPCs tick upward (the average Amazon PPC CPC crossed $1.27 in May 2026), the only lever available is slashing bids on campaigns that were already marginal.
This is what a structurally inverted PPC stack looks like from the inside. And it’s far more common than most sellers realize.

The fix isn’t a new bid strategy or a third-party software subscription. It’s a structural rebuild — rethinking which ad formats serve which purpose, how budget flows across funnel stages, and what “success” actually looks like at each layer. This post walks through exactly how to do that, from diagnosing the problem to deploying a functional full-funnel architecture that compounds over time.
The Architecture Problem: What a Broken Ad Stack Actually Looks Like
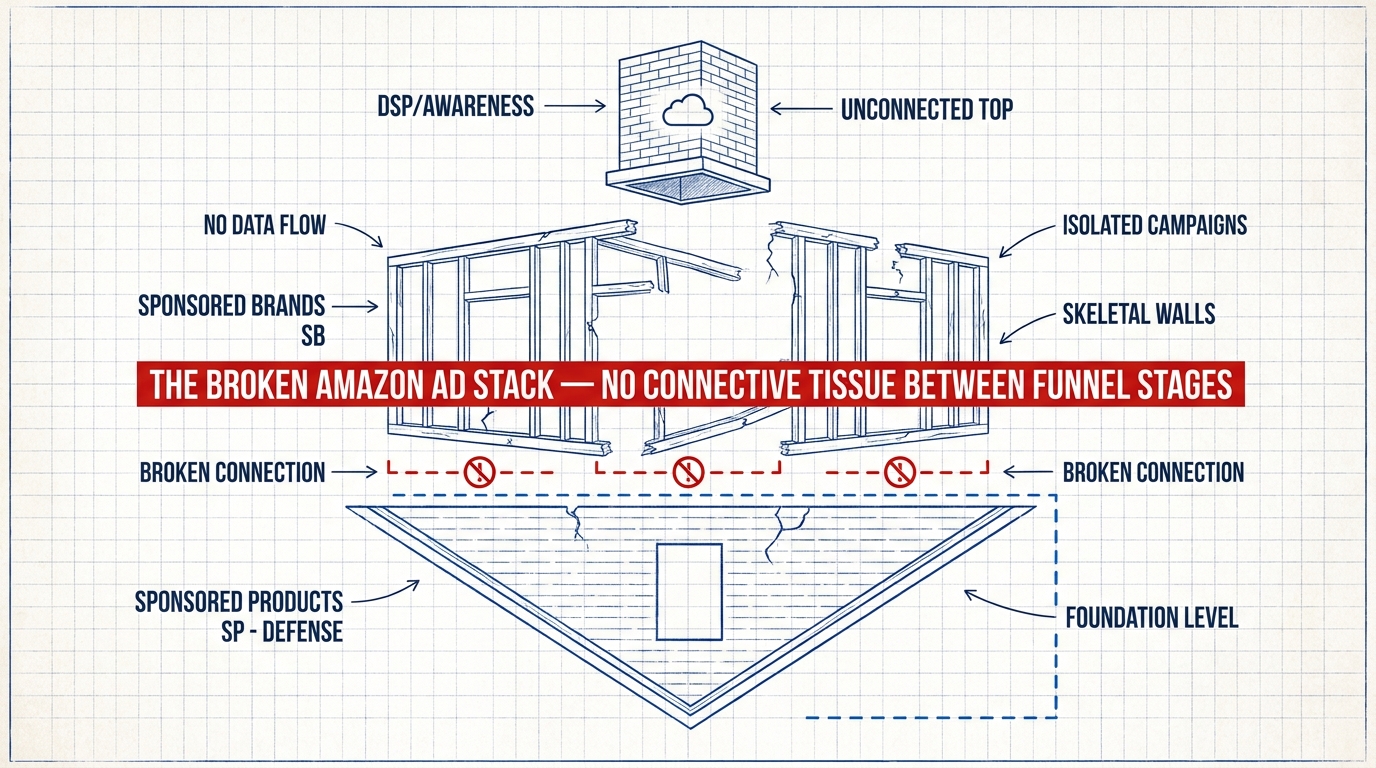
Before you can rebuild something, you need to see the problem clearly. Most Amazon ad accounts aren’t built around a strategy — they’re built around inertia. Sponsored Products campaigns were launched first because they’re the most intuitive, and everything else got added reactively: a Sponsored Brands campaign because someone said they should have one, a Sponsored Display campaign because it was easy to set up, maybe a brief DSP experiment that got shut down when it didn’t show immediate ROAS.
The result is a stack with no connective tissue. Each format exists in isolation, optimized on its own terms, measured by the same last-click ROAS metric regardless of its actual role in the purchase journey. That’s not a full-funnel strategy — it’s a collection of disconnected campaigns pretending to be one.
The Five Symptoms of an Inverted Stack
Here’s what the structural breakdown looks like in practice. If three or more of these describe your account, your stack is almost certainly inverted:
- 80%+ of ad spend in Sponsored Products alone. Sponsored Products is a conversion tool. When it’s carrying the entire budget, you’re harvesting demand you didn’t create — and hoping organic reach fills the gaps.
- No clear mid-funnel presence. There’s nothing capturing the shopper who viewed your product detail page three days ago and is now back on Amazon searching in your category. They leave through a competitor’s Sponsored Display ad while yours sits idle.
- Sponsored Brands running static banners with no video. Sponsored Brands Video (SBV) consistently drives approximately twice the click-through rate of static Sponsored Brands banners, yet most accounts are still running image carousels as their primary SB format.
- All campaigns measured by ACoS or ROAS in Campaign Manager. Campaign Manager uses 14-day last-touch attribution. It systematically assigns all credit to the last click before purchase — which is almost always a Sponsored Products click. Upper-funnel spend appears to generate no return, so it gets cut.
- Flat or declining new-to-brand (NTB) percentage. NTB rate is one of the clearest indicators of whether your ad stack is growing your customer base or just re-converting existing demand. If NTB is stuck below 25–30% for a mature product, the top of your funnel isn’t working.
Why the Bottom-Heavy Default Happens
It’s not incompetence that creates inverted stacks — it’s the structure of Amazon’s reporting. When every format is measured on the same ROAS dashboard, the formats that touch the bottom of the funnel will always look like the winners. Sponsored Products closes the sale. That’s what the dashboard credits. DSP and Sponsored Brands set up the conditions that made the sale possible — and the dashboard gives them nothing.
The result is a feedback loop: bottom-funnel campaigns look great, so they get more budget. Top and mid-funnel campaigns look weak, so they get cut or starved. The account slowly becomes more bottom-heavy over time, and the seller wonders why growth has stalled while their cost-per-click keeps rising.
Fixing this requires changing not just your campaign structure, but your measurement philosophy. Both of those rebuilds are addressed in this post.
Mapping the Real Amazon Purchase Journey (It’s Not Linear)
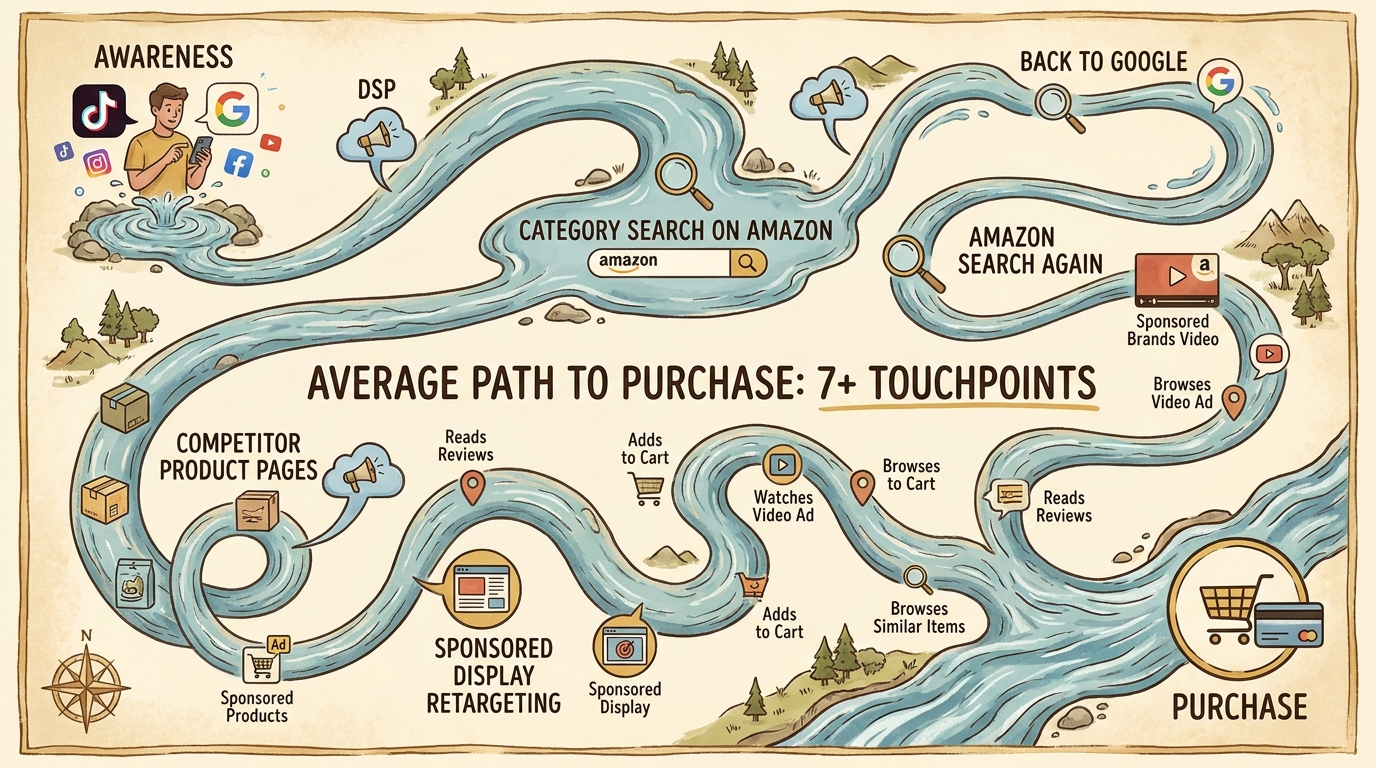
The mental model that most PPC managers carry — awareness leads to consideration leads to purchase, neatly and sequentially — doesn’t reflect how Amazon shoppers actually behave. The real path to purchase is fragmented, recursive, and deeply influenced by touchpoints that happen both on and off the platform.
A shopper might first encounter your brand through a Sponsored Brands Video while searching a broad category term. They click through, spend 45 seconds on your Store, then leave without buying. Two days later, they’re back on Amazon searching a more specific term — and they click on a competitor. They add that competitor’s product to their cart, then abandon it. A week later, they see your Sponsored Display ad on a news site off Amazon. They click through again, read your reviews, and this time they buy.
What does Campaign Manager show for that sale? One Sponsored Products click (if they happened to click an SP ad on the final visit) or perhaps nothing attributable to upper-funnel at all. The SBV impression that introduced them to your brand, the Sponsored Display ad that re-engaged them — neither gets credit in standard last-touch reporting.
The Touchpoint Reality
Amazon Marketing Cloud path-to-purchase analyses consistently reveal that shoppers in competitive categories interact with multiple ad touchpoints before converting. The specific number varies by category and price point, but the pattern is consistent: single-touch attribution models dramatically overvalue the final click and dramatically undervalue the earlier touchpoints that created intent.
For high-consideration categories — supplements, electronics accessories, home goods, pet products — the gap between what last-click attribution credits and what actually drove the sale is significant. AMC analyses in these categories routinely show that 40–60% of the “value” credited to a final Sponsored Products click was actually built by earlier impressions from Sponsored Brands, Sponsored Display, or DSP.
Why This Matters for Stack Design
Understanding the real purchase journey changes how you think about every budget decision. Each ad format is not just competing for the same shopper’s final click — it’s playing a specific role in a sequence that ultimately determines whether that shopper ever reaches the final click in the first place.
This means your rebuild can’t just be about adding more formats. It has to be about defining the job each format does at each stage — and measuring success on terms that are appropriate to that job. A Sponsored Brands Video impression should not be judged on immediate ROAS. It should be judged on the downstream conversion rate of shoppers who were exposed to it versus those who weren’t. Those are fundamentally different questions, and mixing them up is what creates broken stacks.
Top of Funnel: When — and How — to Actually Use DSP
Amazon DSP is both the most powerful and most misunderstood tool in the Amazon advertising ecosystem. It’s powerful because it gives you access to Amazon’s first-party behavioral data for targeting, and because it allows you to reach shoppers on and off Amazon with programmatic display, video, and connected TV inventory. It’s misunderstood because most sellers either dismiss it as a “big brand” tool or deploy it without the infrastructure to measure it properly — then cancel it when it “doesn’t generate ROAS.”
DSP Is Not a Performance Channel
This is the core conceptual error. Amazon DSP is an audience channel. Its job is to reach defined, behaviorally qualified audiences — in-market shoppers, category browsers, competitor ASIN viewers, or custom audiences built from your own customer list — and expose them to your brand before they’ve entered the high-intent search phase. That’s top-of-funnel work. It will not, by design, generate the same ROAS as a Sponsored Products campaign targeting “buy [your product] now” keyword intent.
The measurement question for DSP is not “what is the ROAS on this campaign?” It’s “are shoppers who were exposed to this DSP campaign more likely to convert in my Sponsored Products and Sponsored Brands campaigns than shoppers who weren’t?” That question requires AMC to answer, which is why DSP and AMC are inseparable tools.
When DSP Makes Sense for Your Budget Stage
DSP has historically required a minimum commitment — typically $15,000–$35,000 per month when managed through Amazon Ads directly, though this threshold has shifted as Amazon has opened more programmatic access. For sellers below that threshold, or those who haven’t yet built the AMC measurement infrastructure to interpret DSP outcomes, Sponsored Brands Video serves as the functional equivalent for top-of-funnel exposure within the Sponsored Ads ecosystem.
The general guidance from practitioners in 2026: start DSP when your core Sponsored Products and Sponsored Brands campaigns are profitable, your search term hygiene is solid, and you have AMC set up with at least 90 days of historical data to build meaningful audiences. Launching DSP before your bottom-funnel is efficient means you’re paying to create demand you can’t then convert efficiently.
DSP Audience Architecture for Top-of-Funnel
When you do deploy DSP at the top of the funnel, the audience strategy matters more than the creative. The most commonly used and effective TOF audiences in 2026 include:
- In-market category audiences: Shoppers who have recently browsed or purchased in your category but have no prior exposure to your brand. This is true prospecting — reaching new-to-brand shoppers before they’ve made a decision.
- Lifestyle audiences: Amazon’s curated behavioral segments based on broader interest patterns (e.g., “outdoor enthusiasts,” “health-conscious shoppers”). These cast a wider net and are best for categories where purchase triggers are lifestyle-driven rather than purely need-driven.
- Competitor ASIN viewers: Shoppers who have recently viewed competitor product detail pages. This isn’t strictly top-of-funnel — these shoppers already have category intent — but it’s a high-value prospecting audience for conquest.
- Lookalike audiences from your own customer list: Built via AMC or through pixel data if you have off-Amazon traffic. These tend to produce the highest downstream conversion rates of any prospecting audience.
Streaming TV and Video at the Top
Amazon’s Streaming TV (formerly OTT) inventory has become increasingly accessible even for mid-market sellers through DSP. STV ads — unskippable 15- or 30-second video spots served on Fire TV, IMDb TV, and partner streaming apps — are pure awareness plays. They cannot be clicked on a TV screen. Their job is brand exposure at scale.
The case for STV in a full-funnel Amazon stack is that it feeds downstream conversion at a measurable rate. Amazon’s own internal studies have shown that shoppers exposed to STV campaigns convert at higher rates in Sponsored Products auctions than those who weren’t. The mechanism is essentially increased brand familiarity reducing the barrier to the first click in a search environment. For brands in crowded categories with heavy competitor advertising, that familiarity margin matters.
The Consideration Gap: Why Mid-Funnel Is Where Most Budgets Die
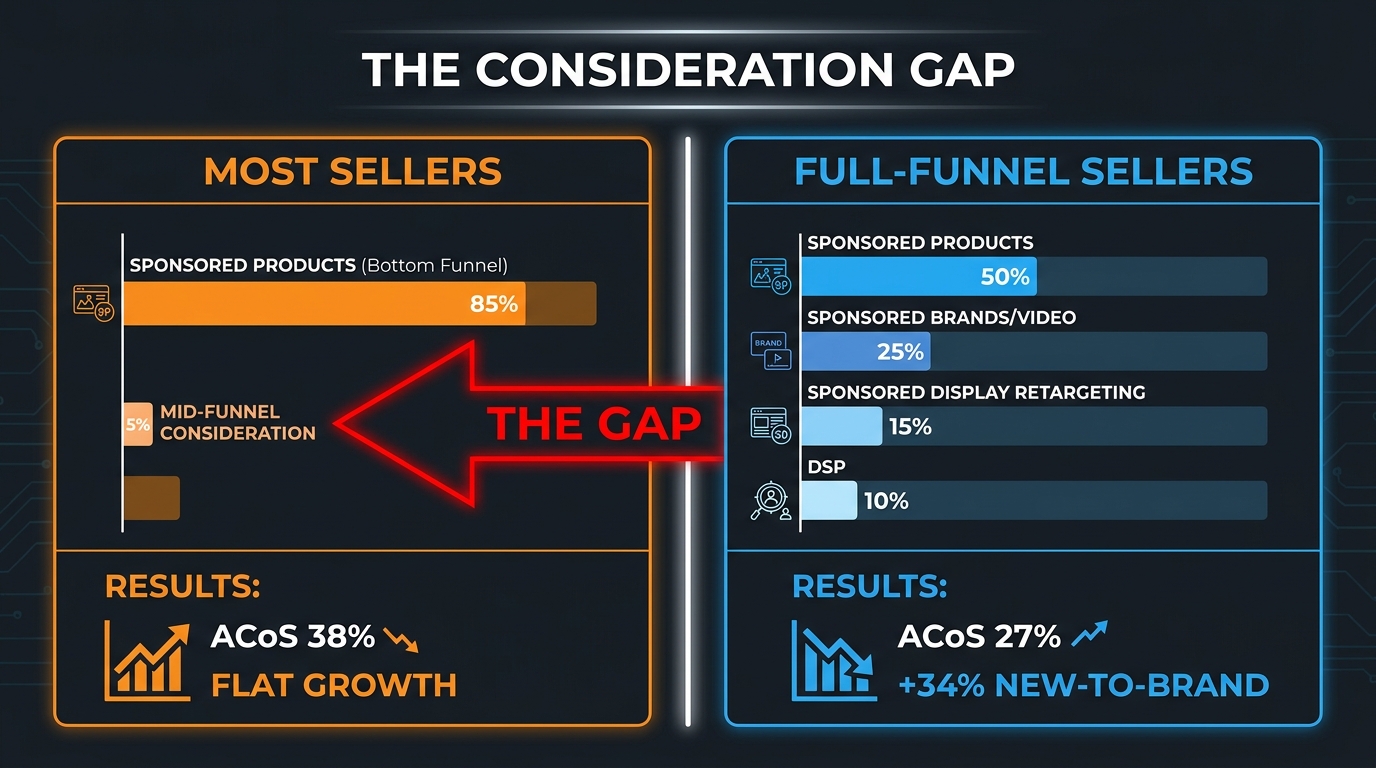
If the top of funnel is underinvested in most Amazon stacks, the middle of the funnel is essentially non-existent. This is the consideration gap — the stage where a shopper has already discovered your product and is actively evaluating it against alternatives, but hasn’t yet committed to a purchase. It’s the most competitive, and arguably the most important, stage of the funnel to own.
Consideration-stage shoppers exhibit a specific behavioral signature: they’ve viewed your product detail page, possibly multiple times. They may have added your product to a wish list or cart. They’re searching category terms, clicking competitor PDPs, reading review comparisons. They’re invested enough to evaluate, but not yet ready to buy. And in most ad accounts, there is no campaign structure designed to specifically reach them.
What the Consideration Stage Actually Looks Like on Amazon
The consideration stage on Amazon is defined by a few behavioral signals that the platform’s targeting systems can detect:
- Product detail page views (no purchase): The most important consideration signal. A shopper who viewed your ASIN but didn’t buy is the highest-probability prospect you can retarget.
- Add-to-cart abandonment: Even higher intent than a PDP view. These shoppers reached the decision threshold but backed away — price, timing, or a competing product pulled them out.
- Category browsing without brand interaction: Shoppers exploring the category without yet engaging with your specific listing. They’re aware of the category need but haven’t yet evaluated your solution.
- Competitor ASIN engagement: Shoppers who have viewed your competitors’ listings. They have active purchase intent but are orienting toward your competition.
The Tools That Cover the Consideration Layer
Two ad formats are specifically built for the consideration stage: Sponsored Display with audience targeting and Sponsored Brands with keyword targeting on consideration-stage search queries. Used together with properly defined targeting parameters, they can close the gap between the shopper who first saw your brand and the shopper who finally decided to buy.
The critical mistake sellers make at the consideration stage is not having it at all — or having it in name only. A Sponsored Display campaign set to “views remarketing” with no audience refinement, no creative differentiation, and no bid strategy tied to the lookback window is not a consideration campaign. It’s an auto-retargeting campaign that may or may not be reaching the right people at the right time.
Genuine consideration-stage coverage requires deliberate audience segmentation: separate campaigns for PDP viewers (7-day lookback), cart abandoners (14-day), category browsers (30-day), and competitor viewers. Each segment warrants different creative messaging, different bids, and different success metrics. The PDP viewer who abandoned yesterday needs reminder messaging. The category browser who hasn’t yet visited your listing needs differentiation messaging. These are not the same ad.
Sponsored Display as a Strategic Tool, Not an Afterthought
Sponsored Display occupies a unique and frequently misunderstood position in the Amazon ad stack. It sits between the full programmatic scale of DSP and the search-intent specificity of Sponsored Products — covering both on-Amazon retargeting and, increasingly, off-Amazon display placements. Most sellers treat it as an automatic upsell tool. The smarter approach is to treat it as the primary vehicle for mid-funnel consideration coverage.
Audience Targeting vs. Product Targeting: The Functional Divide
Sponsored Display offers two fundamentally different targeting mechanisms, and conflating them is one of the most common structural errors in Amazon PPC. Understanding the difference is essential:
Product/ASIN targeting is a placement strategy. You’re bidding to show your ad on specific product detail pages — your own (for cross-sell and upsell) or your competitors’ (for conquest). The shopper hasn’t necessarily engaged with your brand before. This is closer to mid-funnel awareness than it is to conversion-stage retargeting.
Audience (views) targeting is a behavioral retargeting strategy. You’re showing ads to specific people — specifically, people who have previously viewed your product detail pages or similar products, regardless of where they’re currently browsing. This is true retargeting, and it’s the closest thing to a remarketing list that Sponsored Ads offers.
Running both in the same campaign mixes two fundamentally different objectives. It pollutes your data, makes bidding optimization impossible, and guarantees that one objective will get underserved. They need to be separate campaigns with separate budgets and separate success criteria.
Lookback Windows and Bid Logic
Lookback windows in Sponsored Display audience campaigns are a precision instrument that most sellers leave on default settings. The standard window is 30 days, which means you’re retargeting everyone who viewed your ASIN at any point in the past month. But the conversion probability of a shopper who viewed your product yesterday is dramatically higher than the conversion probability of someone who viewed it 28 days ago and hasn’t been back.
Advanced consideration-stage strategy uses tiered lookback windows with differentiated bids:
- 0–7 day viewers: Highest bid. These shoppers are actively in the purchase window. Urgency-oriented creative (“Still deciding? Here’s why 4,000+ customers chose us.”).
- 8–14 day viewers: Moderate bid. The decision window is narrowing but hasn’t closed. Value-reinforcement creative.
- 15–30 day viewers: Lower bid. Re-engagement is the goal. Test promotional messaging or social proof emphasis.
This tiered structure requires running separate campaigns for each window — which adds management overhead but delivers materially better return on consideration-stage spend.
Off-Amazon Placements: The Underused Lever
In 2026, Sponsored Display has expanded its off-Amazon placement footprint significantly. Ads can now appear on third-party websites and apps across the Amazon Publisher Services network, meaning your retargeting doesn’t stop when the shopper leaves Amazon. For consideration-stage shoppers who are actively researching across multiple sites, this follow-through capability can be the difference between winning and losing the conversion to a competitor who maintains visibility after the shopper leaves the platform.
Rebuilding Sponsored Brands: The Video-First Imperative
Sponsored Brands is the most underperforming format in most Amazon ad accounts — not because the format doesn’t work, but because sellers haven’t updated their approach to match what the format has become. The Sponsored Brands of 2026 is a video-first, mid-to-top-of-funnel format that can introduce a brand, communicate value, and drive meaningful new-to-brand traffic. Most accounts are still using it like a bottom-funnel banner ad.
Why Static Banners Are Losing Ground
Sponsored Brands Product Collection — the traditional banner format with a headline and three product images — was the workhorse of SB for years. It still has a role in brand defense (owning the top of search for your own branded queries) and in retargeting-adjacent placements. But in terms of driving new-to-brand engagement in competitive categories, static banners are increasingly outpaced by video.
Sponsored Brands Video (SBV) autoplay format, appearing in-line in search results, captures attention that static banners simply can’t. The movement creates pattern interruption in a page full of still images. Amazon’s placement algorithm has also shifted to favor SBV in competitive top-of-search placements, particularly on mobile, where the video format occupies a larger share of the visible screen.
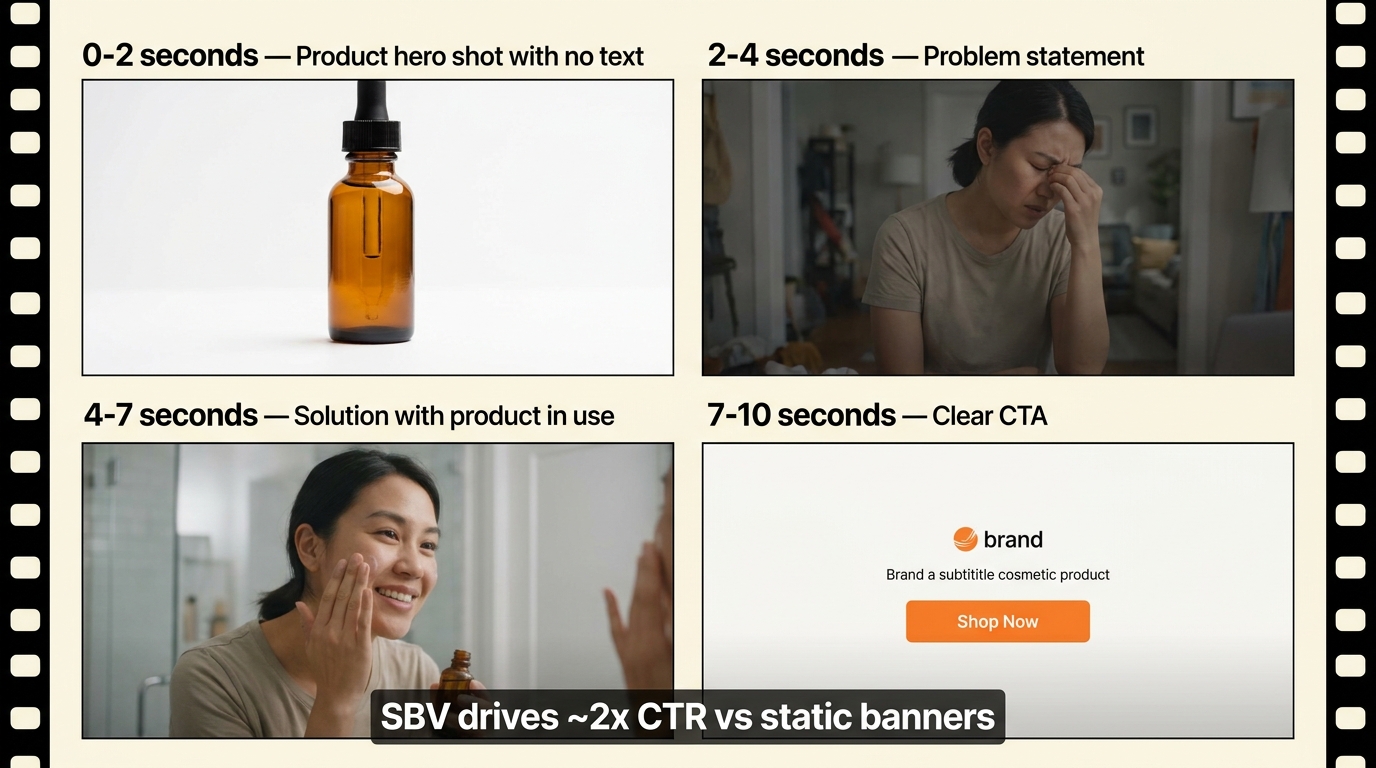
The CTR differential is significant. In competitive categories, SBV routinely achieves click-through rates approximately twice those of comparable static SB campaigns. That gap represents more shoppers reaching your product detail page per dollar spent — which compresses the effective cost per consideration touchpoint.
The Anatomy of a High-Performing SBV
Effective Sponsored Brands Video is not the same as effective YouTube advertising or TikTok creative. The context is fundamentally different: a shopper who is actively searching on Amazon, scanning results, and autoplay video appears in line with their search results. This viewer is in a high-intent, purchase-adjacent mindset. The creative should meet them there.
The structural principles that consistently outperform in SBV:
- Product visible in the first 2 seconds, no exceptions. Amazon’s guidance and practitioner experience both confirm this. Shoppers in an active search context will not wait for a build-up. Show the product immediately.
- No audio dependency. SBV plays silently by default. All essential information — what the product is, why it’s better — must be communicated through visuals and on-screen text. Captions are not optional; they’re the primary communication channel.
- Keep it under 30 seconds, ideally 15–20. Amazon allows up to 45 seconds, but performance data consistently favors shorter formats. A 15-second video that communicates three clear differentiators outperforms a 45-second video that communicates eight.
- End with a single, specific call to action. “Shop Now,” “See All Sizes,” “View the Full Range” — not three options, one. Decision fatigue applies even at the final frame of an ad.
- Test multiple variations, not one production. The most common SBV mistake is investing heavily in one polished video and running it indefinitely. A/B testing between two or three variations — different opening frames, different problem statements, different social proof formats — generates data that informs every future creative decision.
Sponsored Brands and the Store: A Funnel Pair
Sponsored Brands campaigns that send traffic to your Amazon Store rather than directly to a product detail page perform differently — and for the right shopper segment, often better. Store traffic allows the shopper to explore your full catalog, which increases the likelihood of cart additions across multiple SKUs and significantly increases basket size. Amazon’s own Brand Metrics data shows that shoppers who engage with a Store have higher order values and higher NTB rates than those who land directly on a single PDP.
The rebuild implication: use SBV with direct-to-PDP links for bottom-of-funnel keyword targeting where the shopper has high-intent, specific product searches. Use SBV with Store links for broader category keywords where the shopper is exploring and hasn’t yet identified a specific product. These are different creative jobs, and the landing destination should match the intent signal of the keyword being targeted.
Bottom-Funnel Hygiene: Match Types, Negatives, and Search Term Graduation
Even if your top and mid-funnel rebuilds are executed perfectly, a messy bottom-funnel structure will hemorrhage the demand you’ve created. The bottom of the funnel is where money is made — and where it’s most easily lost through poor search term management, undefined match type roles, and campaigns that have never been structurally separated by intent.
The data on wasted spend at the bottom-funnel is stark: Amazon PPC advertisers in 2026 are losing an estimated 15–25% of total bottom-funnel ad spend to low-intent or irrelevant search terms, according to aggregated agency data. That waste doesn’t show up as a single obvious line item — it’s distributed across dozens or hundreds of underperforming search terms that individually look like small problems but collectively represent a major efficiency drain.
The Match Type Roles That Most Accounts Get Wrong
Match types in Amazon PPC are not about traffic volume — they’re about intent precision and discovery. The common error is treating them as interchangeable or using them based on comfort rather than strategy. Here’s the function each match type actually serves in a well-structured account:
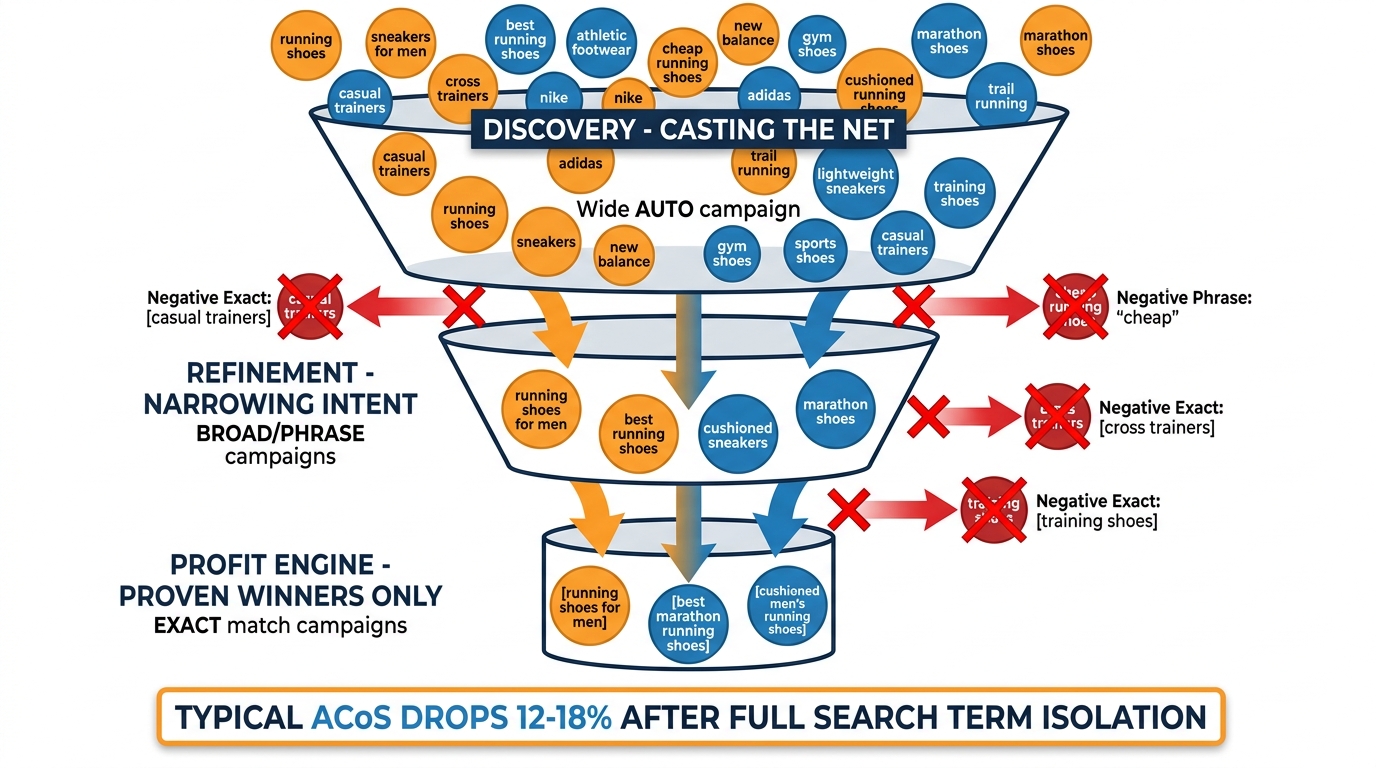
Auto campaigns exist for discovery. Their job is to surface search terms that you didn’t think to add manually. They should be running constantly, with a moderate bid that allows sufficient impressions without overspending on untested terms. They should never be your primary conversion driver — they’re a data source. Every week, you pull the search term report, identify converting queries, and harvest them into manual campaigns.
Broad match campaigns serve a similar discovery function but with more control over the seed keyword direction. In 2026, broad match has expanded its semantic matching significantly — Amazon’s algorithm interprets broad match terms with considerable flexibility. This means broad campaigns can catch valuable close variations that exact campaigns miss, but also that they need aggressive negative keyword management to avoid serving irrelevant traffic.
Phrase match is the refinement layer. After you’ve identified converting search terms from auto and broad, phrase match captures the directional intent around proven keywords while still allowing for some variation. It’s useful for high-value keywords where you want broad coverage of related queries but more control than pure broad match provides.
Exact match is the profit engine. These campaigns target precisely proven, converting search terms with full bid control and zero variation. All top-performing keywords eventually graduate here. Exact match campaigns should have the highest bids in your account for their respective terms and the most aggressive negative keyword lists to prevent cannibalizing other campaigns.
The Graduation Funnel in Practice
The keyword graduation process is the operational backbone of bottom-funnel hygiene. The workflow is:
- Run auto and broad campaigns to collect search term data (minimum 7–14 days before drawing conclusions on any given term).
- Pull the search term report weekly. Filter for terms with at least 5–10 clicks and a conversion rate at or above your category average.
- Add proven converting terms to a dedicated exact match campaign. Set bids at 110–120% of what they converted at in auto/broad — exact match deserves a bid premium because you’re concentrating budget on known winners.
- Add the newly graduated terms as negatives in the campaigns they originated from. This prevents the same shopper from triggering both campaigns and inflating impression counts without corresponding sales.
- Add non-converting, high-spend search terms as negatives in all relevant campaigns. A term that has spent 3x your target CPA without converting is a negative keyword, regardless of how relevant it appears.
Negative Keywords: The Most Neglected Efficiency Lever
The fastest way to improve bottom-funnel efficiency without changing a single bid is comprehensive negative keyword management. Most Amazon PPC accounts have positive keyword lists that grow continuously and negative keyword lists that are nearly empty. The asymmetry is backward.
A rigorous negative keyword framework operates at three levels: campaign-level negatives (preventing specific campaigns from serving irrelevant queries), ad group-level negatives (preventing cross-contamination between ad groups targeting different intent stages), and portfolio-level exclusions (category-wide brand exclusions, clear mismatches, competitor brand terms you’re not running conquest campaigns on).
Spending 30–45 minutes per week on negative keyword hygiene — reviewing the search term report for irrelevant terms and adding them as negatives — typically produces 5–15% efficiency gains within 30 days. It’s unglamorous work, but no bid optimization strategy can match it for pure spend efficiency improvement.
Amazon Marketing Cloud: Seeing the Funnel You’re Actually Running
Amazon Marketing Cloud is the measurement layer that makes full-funnel PPC visible. Without it, you’re flying the aircraft using only the altimeter — you can see one metric clearly, but you have no idea about heading, speed, or fuel state. AMC provides the multi-dimensional view that full-funnel strategy requires.
AMC is a clean-room data environment that allows brands to run SQL queries against their own Amazon Ads event data. This sounds technical — and it is — but the business value is straightforward: AMC can tell you the complete path a shopper took before converting, across all ad formats, with full deduplication and without the last-click attribution bias that Campaign Manager imposes.
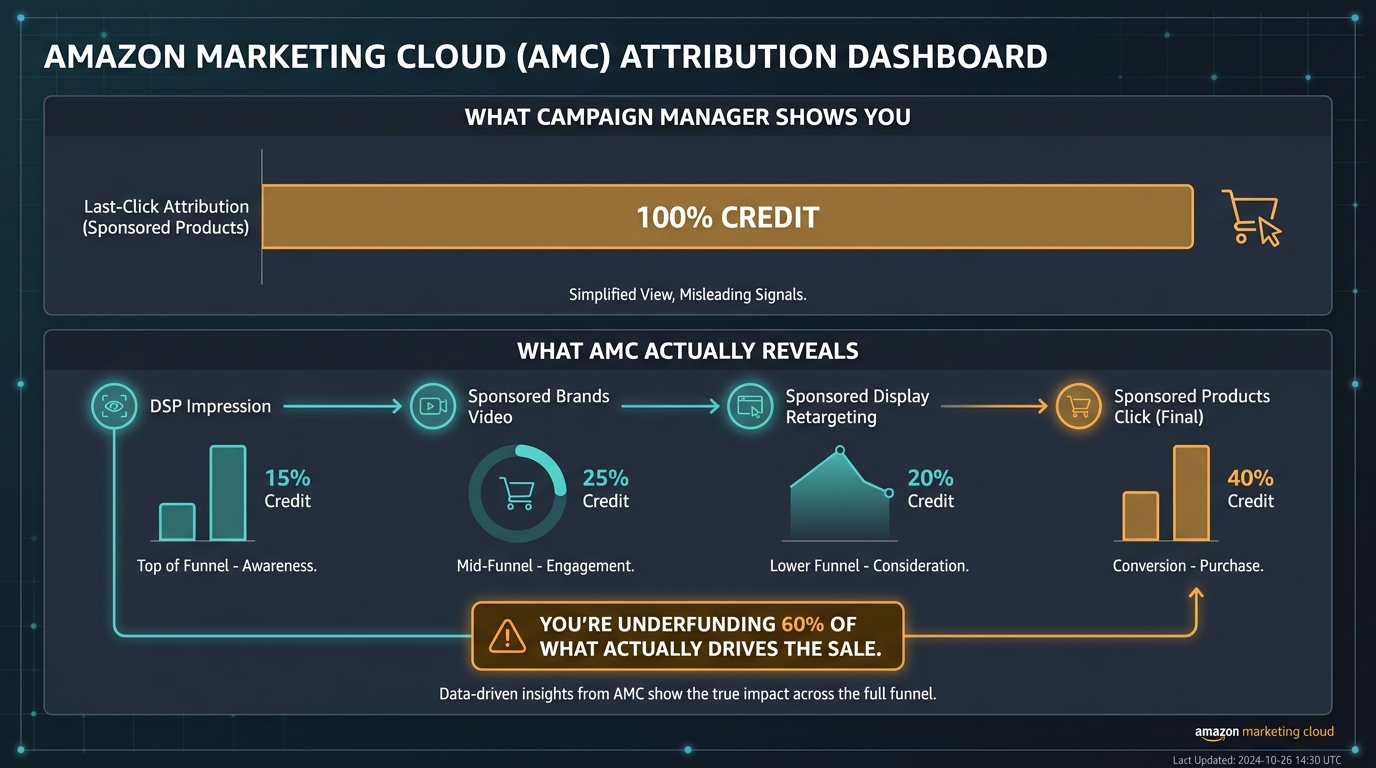
The Attribution Gap AMC Reveals
The most important AMC analysis for full-funnel strategy is the path-to-conversion report. This query shows, for every converting order in a defined time window, which ad touchpoints the shopper experienced before purchasing — in sequence, with timestamps. The results are consistently revelatory for sellers who have never run this analysis.
A typical finding: a seller who has been running DSP prospecting campaigns and attributing them zero ROAS in Campaign Manager discovers through AMC that 35% of their Sponsored Products conversions came from shoppers who had a prior DSP impression. The DSP campaign wasn’t generating “direct sales” — but it was generating the audience that the SP campaign was converting. Cut the DSP campaign (which is what Campaign Manager’s ROAS report would suggest) and you’d be cutting 35% of the pipeline feeding your highest-performing SP campaigns.
This is the attribution gap, and it’s why last-click ROAS is the wrong primary metric for any account running more than one ad format.
Key AMC Analyses for Full-Funnel Optimization
Beyond path-to-conversion, AMC supports several other analyses that are directly actionable for ad stack rebuilds:
Overlap and frequency analysis: How many of the same shoppers are seeing your DSP ads, your Sponsored Brands ads, and your Sponsored Products ads? High overlap can mean you’re paying multiple times to reach the same audience — either by design (frequency for consideration) or by accident (wasted budget). AMC lets you see exact overlap percentages and calibrate accordingly.
New-to-brand incrementality: AMC can isolate which campaigns are genuinely driving new customer acquisition versus re-engaging existing customers. This matters because Sponsored Products, by default, tends to disproportionately capture existing customers who would have found and bought from you organically. Knowing which campaigns are driving true NTB acquisition changes budget allocation logic significantly.
Time-lag analysis: How long does it take from a shopper’s first ad touchpoint to their first purchase? In complex categories, this lag can be days or weeks. Understanding the typical conversion lag for your category helps you set appropriate lookback windows in Sponsored Display retargeting campaigns and interpret AMC data correctly — a campaign that looks like it’s generating no ROAS on a 7-day window might look very different on a 21-day window.
Getting Started with AMC Without a Data Team
AMC was once primarily accessible to enterprise-level brands with dedicated analytics teams. In 2026, that’s no longer the case. Amazon has built query templates for common analyses directly into AMC’s interface, and several third-party PPC platforms have built pre-packaged AMC dashboards that surface the most important insights without requiring SQL expertise.
The practical entry point for most sellers is the AMC Quick Sight dashboard — Amazon’s own visualization layer — combined with the pre-built path-to-purchase and NTB query templates. These provide approximately 80% of the actionable insight from AMC without requiring custom SQL development. If you’re spending more than $15,000 per month on Amazon advertising, there is no credible justification for not having AMC set up and running.
Budget Architecture: Allocating Across the Full Funnel
Structural changes to campaign organization only deliver results if the budget architecture changes alongside them. A perfectly segmented, full-funnel campaign structure that still allocates 85% of budget to Sponsored Products is a cosmetic rebuild, not a functional one. Real full-funnel strategy requires deliberate budget allocation that funds each stage of the funnel according to its strategic role.
The right budget split depends on multiple factors — category maturity, brand awareness level, product life cycle stage, and competitive intensity. There is no universal ideal allocation. But the following framework provides a useful starting structure that can be adjusted based on performance data:
A Starter Budget Architecture by Funnel Stage
- Top of Funnel (DSP, Streaming TV, SBV prospecting): 10–20% of total ad budget. For brands with low category awareness or new product launches, this number should be toward the higher end. For brands with strong organic traffic and established category presence, the lower end is defensible.
- Mid-Funnel (Sponsored Display audience retargeting, Sponsored Brands category keywords): 15–25%. This is almost certainly the most underinvested layer in most current accounts and the one with the highest potential for quick efficiency gains when properly structured.
- Bottom-Funnel Conversion (Sponsored Products exact match, branded search defense, high-intent category terms): 50–65%. Yes, the majority of spend still belongs at the bottom — but it should be earned allocation based on performance data, not default allocation based on inertia.
- Testing and Discovery (auto campaigns, broad keyword expansion, competitor conquest): 10–15%. This pool funds ongoing search term discovery and new keyword identification. It should be fixed as a percentage of total budget, not variable — when CPCs rise and budgets get squeezed, discovery is often the first thing cut, which accelerates funnel decay.
Portfolio Budgeting vs. Campaign-Level Capping
One of the most practical operational changes you can make to budget architecture is moving from campaign-level daily budgets to portfolio-level budget management. Portfolio budgets in Amazon Ads allow you to set a total spend cap across a group of campaigns, with the system allocating within the portfolio based on performance signals throughout the day.
The functional advantage is avoiding the “budget runout” problem: individual campaigns that hit their daily cap at 2 PM stop showing ads for the rest of the day, creating artificial impression gaps during peak evening shopping hours. Portfolio budgets allow the system to dynamically shift unspent budget from lower-activity campaigns to higher-activity ones within a defined envelope, smoothing coverage across the day.
Structure portfolios by funnel stage, not by product. A “Top-of-Funnel Portfolio,” a “Consideration Portfolio,” and a “Conversion Portfolio” allow you to see aggregate spend and performance at each funnel stage with a single view — and to make budget reallocation decisions between stages based on where the current bottleneck sits.
Reading the Bottleneck Signal
Full-funnel budget management is dynamic, not static. The right allocation shifts as the funnel evolves. The signal to watch:
- If NTB rate is declining: Your top-of-funnel is underfunded. Increase TOF allocation and monitor for 30–60 days.
- If impression share is high but conversion rate is falling: The consideration layer isn’t doing its job. Audit mid-funnel campaigns for audience relevance and creative messaging.
- If ACoS is rising on bottom-funnel campaigns despite good conversion rates: CPCs are increasing faster than your conversion rate is improving. This is usually a keyword hygiene problem — pull the search term report and aggressively negative out low-intent terms.
- If overall TACoS is flat but ad spend is growing: You’re buying growth rather than building it. This indicates organic rank isn’t improving alongside paid performance, which usually points to listing quality or review velocity problems that no ad structure change can fix.
Competitive Conquest as a Funnel Layer
Competitive conquest — targeting competitor keywords and ASINs with your own ads — is often treated as a standalone tactic rather than as an integrated funnel layer. That framing misses its structural potential. When conquest is embedded thoughtfully into a full-funnel rebuild, it functions as a consideration-stage acquisition engine: intercepting shoppers who have expressed active category intent toward your competition and redirecting their evaluation process.
The Four Types of Conquest and Where They Live in the Funnel
Brand name keyword conquest: Bidding on a competitor’s brand name in Sponsored Products or Sponsored Brands. This is top-of-funnel interruption — catching shoppers who have typed the competitor’s name and presenting your brand as an alternative. Conversion rates are lower than on your own branded terms, but the NTB rate is very high. Measure success on NTB orders, not ROAS.
Competitor ASIN targeting in Sponsored Products: Placing your Sponsored Products ad on a competitor’s product detail page. The shopper is in active evaluation mode — they’ve opened the competitor’s listing and are reading it. Your ad appears on that page. Conversion rates on this placement type vary widely by category and by the visual strength of your creative versus the competitor’s product images. This is mid-funnel conquest.
Competitor ASIN targeting in Sponsored Display: Similar to SP ASIN targeting, but served to audiences who have previously viewed competitor ASINs — including off-Amazon. This extends the conquest reach beyond the competitor’s PDP into the broader web browsing context of the shopper, following them after they’ve left Amazon.
Category keyword conquest: Targeting broad category terms where your competitors are dominant (e.g., targeting “best [category] brand” or “[competitor benefit]” terms). This is consideration-stage conquest — intercepting shoppers who are actively comparing options within your category.
The Conquest Bidding Principle
One practical rule for conquest campaigns: bid lower than you would for your own branded terms, and measure success differently. Conquest clicks are warmer than cold prospecting but cooler than branded search. The conversion rate delta means that bidding the same CPC for a conquest click as you would for a branded click will almost always produce an unsustainable ACoS. Build conquest campaigns with a 20–35% bid discount relative to your equivalent branded campaigns, and hold them to a NTB-oriented success metric rather than overall ROAS.
Rebuilding in Sequence: A 90-Day Stack Rebuild Timeline
A full-funnel Amazon PPC rebuild is not a weekend project. Done properly, it involves structural changes that need time to accumulate data before they can be optimized. The following sequence is designed to minimize disruption to existing performance while systematically building the full-funnel architecture over three months.
Days 1–30: Audit, Clean, and Fortify the Bottom
The first month is entirely about bottom-funnel hygiene. Do not launch new campaigns or change the fundamental structure of your existing campaigns in the first 30 days. Instead:
- Complete a full search term audit for the past 90 days. Add negative keywords to every campaign that has search terms spending more than 2x target CPA without converting.
- Separate auto and manual campaigns if they’re currently combined. Auto discovery belongs in dedicated campaigns with moderate bids; manual campaigns targeting proven keywords need isolation.
- Set up AMC if it isn’t already running. You need 30+ days of AMC data before you can run meaningful path-to-purchase analysis.
- Audit your Sponsored Brands campaigns. Identify any static banner campaigns that don’t have a video counterpart. Flag them for creative production in month two.
- Segment your Sponsored Display campaigns by targeting type. Separate product/ASIN targeting from audience (views) targeting into different campaigns.
Days 31–60: Build the Consideration Layer
Month two is dedicated to mid-funnel construction. With bottom-funnel hygiene in place and AMC beginning to accumulate data:
- Launch tiered Sponsored Display audience campaigns: 0–7 day PDP viewers, 8–14 day viewers, and 15–30 day viewers, each with separate budgets and bids.
- Launch or relaunch Sponsored Brands Video. If you don’t have video creative, invest in at least one 15–20 second product-led video. A simple, well-lit product demonstration outperforms a polished brand story film in most categories.
- Add competitor ASIN targeting to Sponsored Products (mid-funnel conquest). Start with 5–10 of the most directly competitive ASINs in your category.
- Set up portfolio budgeting for each funnel stage: a Consideration Portfolio and a Conversion Portfolio, with defined budget envelopes for each.
Days 61–90: Activate the Top and Measure the System
Month three brings top-of-funnel activation and full-system measurement:
- Run your first AMC path-to-purchase query. Identify what percentage of your converting orders in the past 60 days had a prior upper-funnel touchpoint. Use this data to make the case for (or against) DSP investment.
- If DSP is accessible and the AMC data supports upper-funnel investment, launch a small DSP in-market audience prospecting campaign. Set a 90-day measurement window before evaluating performance.
- If DSP isn’t accessible, expand Sponsored Brands Video to include broader category keyword targeting for prospecting — not just your branded terms and high-intent category terms, but broader awareness-stage searches in your category.
- Run an NTB analysis in AMC. What percentage of orders from each campaign type are new-to-brand? Use this data to reallocate budget toward the campaigns that are genuinely growing your customer base.
Measuring a Full-Funnel Stack: The Metrics That Actually Matter
The final piece of a full-funnel rebuild is establishing a measurement framework that reflects the system you’ve built — not the single-format, last-click model you’re replacing. This requires accepting that different funnel stages require different success metrics, and that no single number can represent the health of a multi-stage system.
The Full-Funnel Metric Stack
Here is the metric framework organized by funnel layer:
Top of Funnel (DSP, Streaming TV, SBV prospecting):
- Reach and unique reach (how many unduplicated shoppers did you reach?)
- Frequency (how many times did the average shopper see your ad? 3–5 exposures is typically the effective range)
- Downstream ROAS in AMC (what is the conversion rate of shoppers who saw a TOF ad versus those who didn’t?)
- New-to-brand rate among converters
Mid-Funnel (Sponsored Display retargeting, Sponsored Brands consideration):
- Detail page view rate (how often does a click from your SB ad result in a product page view?)
- Cart abandonment recovery rate (what percentage of cart abandoners who saw your SD ad ultimately purchased?)
- Branded search lift (did your SBV campaigns increase branded search volume in subsequent weeks?)
- Consideration-to-conversion rate in AMC
Bottom of Funnel (Sponsored Products, exact match, branded defense):
- ACoS (advertising cost of sale) — appropriate here because the intent signal is clear and last-click attribution is mostly accurate
- Conversion rate by keyword and match type
- Search term impression share on branded and top-category keywords
- TACoS (total advertising cost of sale) — this is the most important single number because it captures whether organic sales are growing alongside paid performance
TACoS as the North Star
If you’re going to use one number to judge whether your full-funnel rebuild is working, make it TACoS — total ad spend divided by total sales (ad-attributed plus organic). TACoS captures the relationship between paid investment and organic growth in a way that ACoS alone cannot.
A healthy full-funnel stack should, over time, produce a declining TACoS even as ad spend grows. That pattern indicates that paid advertising is creating genuine demand that converts into organic sales and improves organic rank — compounding the return on ad investment over time. A flat or rising TACoS alongside growing ad spend is a signal that the stack is buying revenue rather than building it.
Conclusion: The Stack That Compounds
The argument for rebuilding your Amazon PPC stack from the funnel out is not that it will immediately improve your ROAS. In the short term, a proper full-funnel rebuild will almost certainly move money into areas that show lower direct returns in Campaign Manager. That’s not a bug — it’s the expected outcome of investing in funnel stages that last-click attribution systematically undervalues.
The argument is that an inverted stack has a ceiling. When your entire ad strategy is concentrated at the point of conversion, you’re harvesting demand you didn’t create. You’re dependent on organic discovery, word-of-mouth, and external channels to fill the top of the funnel — and those sources are neither controllable nor scalable in the way that paid media is. When CPCs rise (and they have been, consistently, across 2025–2026), a bottom-heavy stack has nowhere to go but less efficient.
A properly structured full-funnel stack compounds. Top-of-funnel investment today creates mid-funnel retargeting audiences for next month and bottom-funnel branded search demand for next quarter. AMC data from each stage informs bidding and creative decisions across all stages. New-to-brand acquisition builds a customer base that eventually re-purchases without any ad spend. TACoS trends down as organic rank improves on terms where your paid performance has been consistent.
That compounding dynamic is what separates brands that grow on Amazon year over year from brands that plateau or decline as the competitive environment intensifies. The stack is the strategy.
Your Full-Funnel Rebuild Checklist:
✅ Audit current budget allocation by funnel stage (if >80% is in SP, you have an inverted stack)
✅ Set up Amazon Marketing Cloud if not already active
✅ Separate Sponsored Display by targeting type (product ASIN vs. audience/views)
✅ Create tiered Sponsored Display audience campaigns by lookback window (0–7, 8–14, 15–30 days)
✅ Produce at least one Sponsored Brands Video if you’re running static SB only
✅ Run full search term audit — add negatives for all terms spending >2x CPA without converting
✅ Graduate top-performing search terms to isolated exact match campaigns
✅ Implement portfolio budgets organized by funnel stage
✅ Run AMC path-to-purchase query after 60 days of full-funnel data
✅ Establish TACoS as your primary account-level health metric