
There is a number that almost every Amazon seller knows but few say out loud. After referral fees, fulfillment, storage, advertising, and the cost of goods, the average third-party seller is left with somewhere between 6% and 15% net profit on revenue — and that range is getting narrower, not wider.
Amazon’s third-party marketplace is not dying. Far from it. U.S. e-commerce grew 12.2% in the second quarter of 2026, its fastest pace in five years, and more than 60% of Amazon’s sales now flow through independent sellers. The platform has never been larger. The opportunity has never been more visible. And yet the structural pressure on individual sellers has never been more acute.
Fees have compounded. Competition has intensified. The ad auction has grown more expensive every year. Chinese factory-direct sellers — now 55.9% of the top 10,000 sellers by count — have erased the listing-quality gap that once gave domestic brands a comfortable moat. Meanwhile, entirely new discovery surfaces, from Amazon’s AI recommendation shelf to the growing Amazon Business B2B channel, are rewriting the rules about how products get found in the first place.
The sellers who are winning in 2026 are not necessarily the loudest, the most aggressive with ads, or the most prolific with new product launches. They are the ones who understand the actual math of their business, who see the structural shifts coming, and who position themselves accordingly.
This piece digs into what the data actually shows — from Marketplace Pulse’s latest research to the real-world fee economics that most sellers don’t model accurately until it’s too late. It is not a collection of tips. It is a structural analysis of the Amazon marketplace in 2026, and what it means for sellers who want to build something that lasts.
The Full Cost Stack: What You’re Actually Paying Amazon
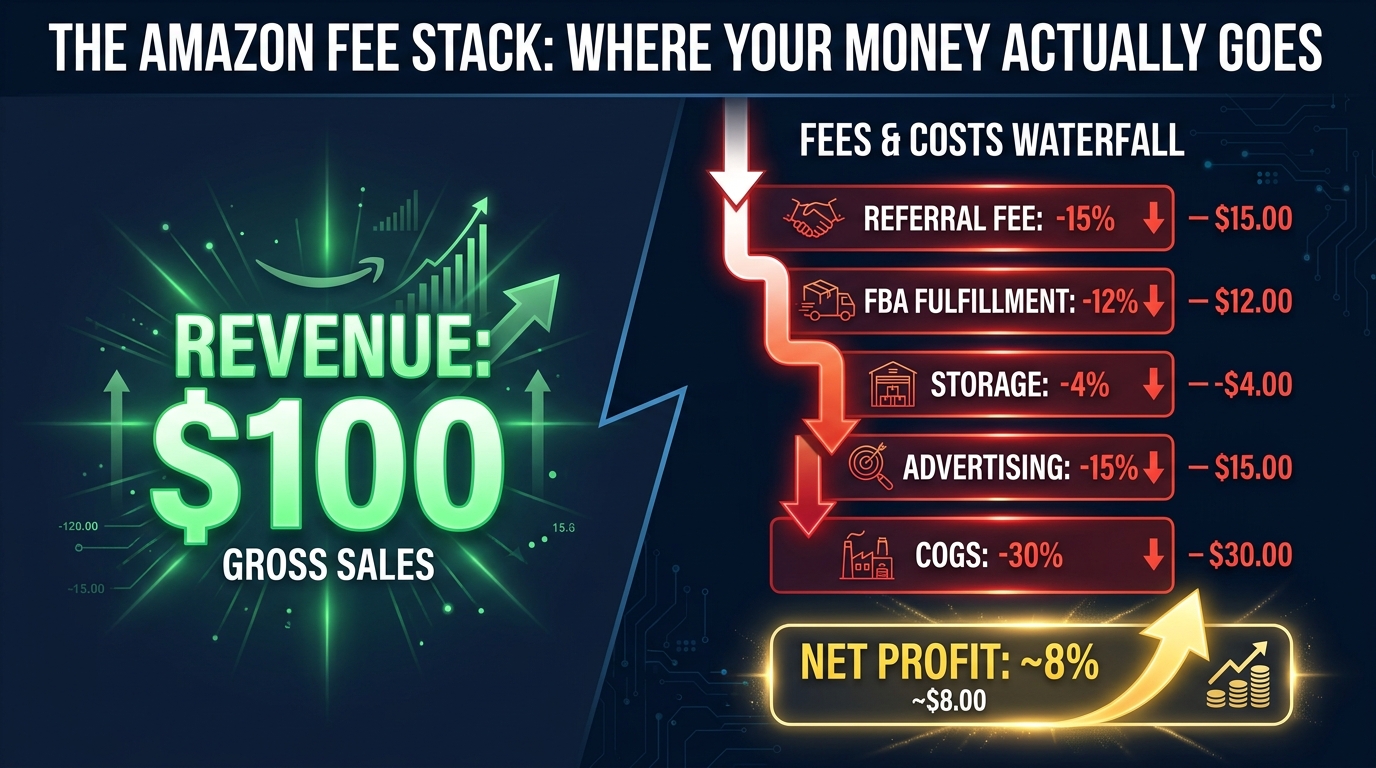
Ask most Amazon sellers what they pay Amazon, and they will answer with their referral fee percentage. Ask them for their total Amazon cost rate as a percentage of revenue — including every fee, every service, every ad dollar — and the number gets uncomfortable fast.
The full fee stack works in layers, and each layer compounds into the next.
Layer 1: The Referral Fee
Amazon charges a referral fee on every sale — this is the baseline “commission” for accessing the marketplace. The rate varies by category, but for most mainstream product categories, it sits at 15%. Some categories are lower: computers and consumer electronics run at 8%, grocery is tiered at 8% for items under $15 and 15% above. Others are higher: jewelry charges 20% on the first $250, and clothing and accessories charges 17%.
For a seller moving a $35 private label product in the Home & Kitchen category, the referral fee alone is $5.25 before a single box is packed.
Layer 2: FBA Fulfillment Fees
For the approximately 82% of Amazon sellers who use Fulfillment by Amazon, the next layer is the fulfillment fee itself — charged per unit based on size and weight. A standard-size item in the 1-3 lb range typically costs $3.50–$5.30 per unit to pick, pack, and ship through FBA. Oversized items can climb dramatically higher.
Amazon has increased FBA fulfillment fees consistently over the past three years, adding a fuel and inflation surcharge that was later baked permanently into the base rates. For sellers who entered the market modeling 2021 fee structures, today’s rates represent a meaningful step-down in profitability on every unit shipped.
Layer 3: Monthly Storage Fees
Inventory sitting in Amazon’s fulfillment centers costs money every month — $0.78 per cubic foot from January to September, rising to $2.40 per cubic foot during Q4 (October through December). This seems manageable until a product slows down, a restock arrives too early, or a PPC campaign underperforms for a couple of weeks.
Beyond the standard monthly fee, Amazon levies aged inventory surcharges on units that have been in fulfillment centers for more than 181 days. The surcharge schedule is steep, and for slow-moving SKUs it can quietly drain thousands of dollars from a seller’s account over a quarter without appearing in any obvious dashboard alert.
Layer 4: Advertising
This is where the real compression happens. Amazon’s advertising business generated $68.6 billion in revenue in 2025 — a figure that represents the money sellers and brands collectively spent buying visibility on a platform they are also paying a referral fee to use. Sponsored Products, Sponsored Brands, Sponsored Display — each auction gets more competitive as more sellers enter every category, driving up cost-per-click regardless of campaign efficiency.
According to Marketplace Pulse data, 46% of sellers name advertising as their primary margin concern, second only to marketplace fees themselves at 49%. For many sellers in competitive categories, advertising spend as a percentage of revenue — the Advertising Cost of Sale, or ACoS — runs at 15–25%, often higher during peak periods or new product launches.
What the Numbers Add Up To
Stack referral fees (15%), FBA fulfillment (10–15% of revenue depending on product weight and price), storage (1–4%), and advertising (15–25%) together with cost of goods (typically 25–35% for private label), and a seller in a competitive category can easily find that 85–92 cents of every dollar of revenue is spoken for before they count any overhead, returns, or miscellaneous platform charges.
A 10% net margin is a good outcome on Amazon in 2026. A 15%+ margin is genuinely rare and hard to defend. This is not a pessimistic take — it is the structural reality of a maturing marketplace. The sellers who thrive are those who model the full cost stack honestly, price accordingly, and stop chasing revenue at the expense of actual profit.
The Winner-Take-All Dynamic: Why Position Has Never Mattered More
Here is the paradox at the heart of the Amazon marketplace in 2026: the top sellers are holding their positions more durably than ever before, while the market itself is growing faster than it has in years. More money is flowing through the platform, and yet that money is concentrating at an accelerating rate toward the sellers already at the top.
Marketplace Pulse data captures this precisely. 68.6% of today’s top 10,000 sellers held that position a year ago — almost identical to the 67% recorded in 2019. Nearly half (49.6%) were already in the top 10,000 three years ago. Position at the top of Amazon has become more durable over time, not less. The platform rewards incumbency.
What “Durable Position” Actually Means
The durability of top-seller positions is not accidental. It is the product of compounding advantages that are genuinely hard to replicate from a standing start. Review velocity compounds over years. Organic rank builds through sustained sales history that takes time and capital to accumulate. Brand Registry gives established sellers tools — A+ content, storefronts, video ads — that newer competitors cannot access until they qualify. And crucially, the ad auction favors bidders who can model their true LTV accurately, meaning established sellers with longer customer data histories can bid more efficiently than newcomers guessing at conversion rates.
The result is that the seats at the top turn over at essentially the same rate they did seven years ago, but they are increasingly occupied by sellers with structural advantages that newcomers cannot buy their way past quickly — which is a meaningful shift from the early years of the marketplace when listing quality and keyword targeting could vault an unknown seller into a top position within weeks.
The Concentration of GMV
Marketplace Pulse data is explicit about how concentrated the platform has become. Fewer than 8,000 sellers now generate half of Amazon’s estimated $300 billion in U.S. third-party GMV. The top 1% of sellers are capturing a disproportionate share of a growing market, while mid-tier and long-tail sellers fight over an increasingly commoditized remainder.
This does not mean new sellers cannot succeed. It means they need a clearer theory of where their edge comes from — and “better PPC” or “better images” is not a sufficient answer if the underlying product and brand position are weak.
China vs. US Sellers: What the 2026 Data Actually Reveals
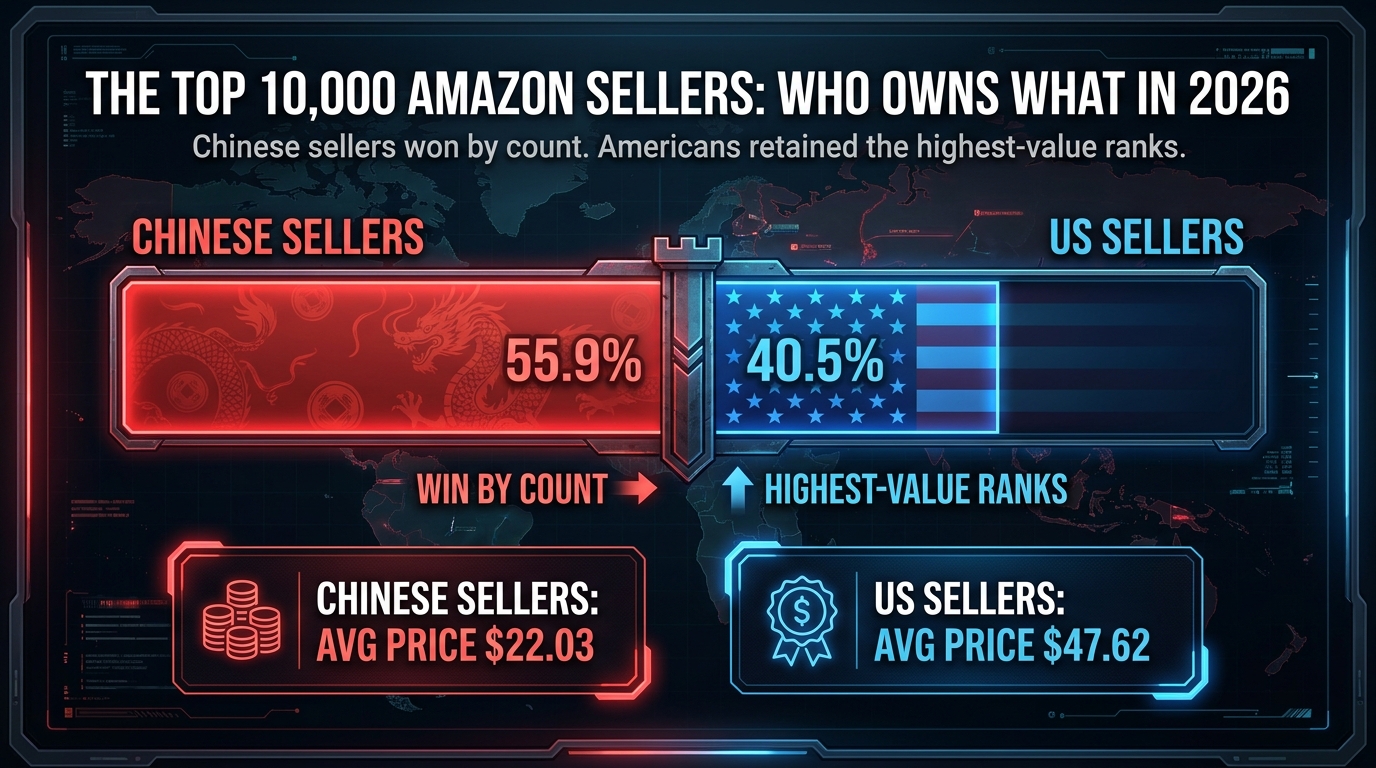
The headline number from Marketplace Pulse’s July 2026 analysis of the top 10,000 Amazon sellers is striking: Chinese sellers now account for 55.9% of those positions, up from 42.5% in July 2020. U.S. sellers have fallen from 53.7% to 40.5% over the same period. The crossover — Chinese sellers taking a majority of the top 10,000 — arrived roughly two years before Chinese sellers reached a majority of the global active seller base.
But the headline number requires careful reading, because it tells a more nuanced story than “Chinese sellers are winning.”
Count vs. Value: Two Very Different Pictures
When Marketplace Pulse looked at GMV rather than seller count, the inversion is dramatic. U.S. sellers hold 65.3% of the GMV generated by the entire top-10,000 cohort, against 28.6% for Chinese sellers. At the very summit — the top 100 sellers — American sellers represent 81.4% of the sellers and produce 93.2% of the GMV.
The average selling price tells the same story from a different angle. In the top 100, American sellers have an average selling price of $47.62. Chinese sellers in the same cohort average $22.03. Chinese sellers have captured the top 10,000 by count while building their positions overwhelmingly in the lower-price, high-volume end of the catalog. American sellers have retreated from the mid-tier volume game and concentrated at the high-value end.
What Chinese Sellers Did Right — and What It Means for Everyone Else
The rise of Chinese sellers in the top 10,000 is not primarily a story about cheap labor. It is a story about structural advantages that the marketplace’s maturation has made increasingly decisive:
- Manufacturing proximity: Chinese sellers can iterate on product design and production in weeks rather than months, test market responses, and adjust rapidly in ways that importers cannot match.
- Direct factory relationships: Eliminating the import markup that most Western private-label sellers absorb creates a meaningful cost-of-goods advantage that flows directly to the ability to bid more aggressively in the ad auction.
- AI listing tooling: The listing quality gap that once protected established domestic sellers — the advantage of better copy, better images, better keyword optimization — has narrowed dramatically as AI-powered listing creation tools have become standard practice.
For U.S. and European sellers, the implication is not that competing with Chinese sellers is impossible. It is that competing on the same terrain — commoditized products at low price points with thin differentiation — is increasingly a losing proposition. The sellers retaining their positions at the top are winning on the dimensions Chinese factory-direct sellers cannot easily replicate: genuine brand equity, differentiated product development, and customer loyalty that does not depend entirely on price.
The Pandemic Cohort That Got Squeezed
Marketplace Pulse’s data identifies a specific cohort under acute pressure: sellers who registered between 2019 and 2021, the pandemic era. They represent just 17.5% of the top 10,000 today — the thinnest cohort on the chart. They entered during the marketplace’s peak, built businesses on the assumption that elevated pandemic demand was durable, and are now being squeezed by Chinese competition from below and established incumbents from above. If you entered Amazon between 2019 and 2021 and are still fighting to hold your position, the data suggests you are not alone — and the structural headwinds you are facing are real.
FBA vs. FBM in 2026: When the Math Actually Flips
The dominant narrative in the Amazon seller community is that FBA is almost always the right choice. And for many sellers, it is: 82% of Amazon sellers use FBA, 64% use FBA exclusively. But the narrative of FBA’s superiority obscures important edge cases where Fulfilled by Merchant (FBM) produces meaningfully better economics — and in 2026’s fee environment, those cases are more common than they were three years ago.
The FBA Default and Why It Persists
FBA’s appeal is genuine and multi-dimensional. It confers Prime eligibility, which is a significant conversion rate driver. It offloads storage, picking, packing, and shipping logistics. It delegates customer service for fulfilled orders to Amazon. For sellers with small, lightweight, fast-moving products, the fee structure is broadly favorable and the operational simplicity is a real advantage.
The Prime badge alone is a meaningful conversion lift. Data across multiple independent studies suggests Prime-eligible listings convert at materially higher rates than non-Prime equivalents, and that gap persists even for sellers who qualify for Seller Fulfilled Prime (SFP) — a program that is difficult to maintain due to its strict performance requirements.
When FBM Makes More Financial Sense
There are specific scenarios where the math consistently favors FBM:
- Heavy or oversized products: FBA fees are not linear with product price. A 20-pound product might cost $15–20 in FBA fulfillment fees — a meaningful percentage of the product price for anything under $150. A seller with their own logistics or a 3PL relationship may be able to fulfill the same order for $8–12 and retain the Prime conversion advantage through Seller Fulfilled Prime.
- Slow-moving SKUs: Products that sell one or two units per week accumulate storage fees and aged inventory surcharges that can erase margin over a quarter. FBM moves storage risk from Amazon’s fulfillment center to the seller’s own facility, where the cost structure is usually more predictable.
- High-value, low-volume products: For products priced at $200+, the FBA fulfillment fee as a percentage of revenue becomes small, but the per-unit fee still exists. More importantly, high-value products often benefit from the seller having direct control of the unboxing experience — packaging quality, inserts, branding — that FBA cannot accommodate.
- Products with high return rates: FBA handles returns, but the disposition of returned inventory — whether it is relisted, repackaged, or disposed of — is out of the seller’s control. For categories with high return rates, FBM gives sellers the ability to inspect, refurbish, or repackage returns before relisting them, recovering value that FBA’s automated processing would destroy.
The Hybrid Model
Jungle Scout’s data showed that 14% of Amazon sellers use both FBA and FBM across different products in their catalog — and in 2026’s fee environment, that percentage is almost certainly higher. The optimal approach is not a blanket choice between the two methods but a product-by-product analysis that applies each method to the products where it produces better economics. The sellers treating this as a nuanced financial decision — rather than a one-size-fits-all commitment to FBA — are consistently finding margin improvement without sacrificing the conversion rate advantages that matter for their top-selling products.
The Inventory Cash Flow Problem Nobody Talks About Loudly Enough
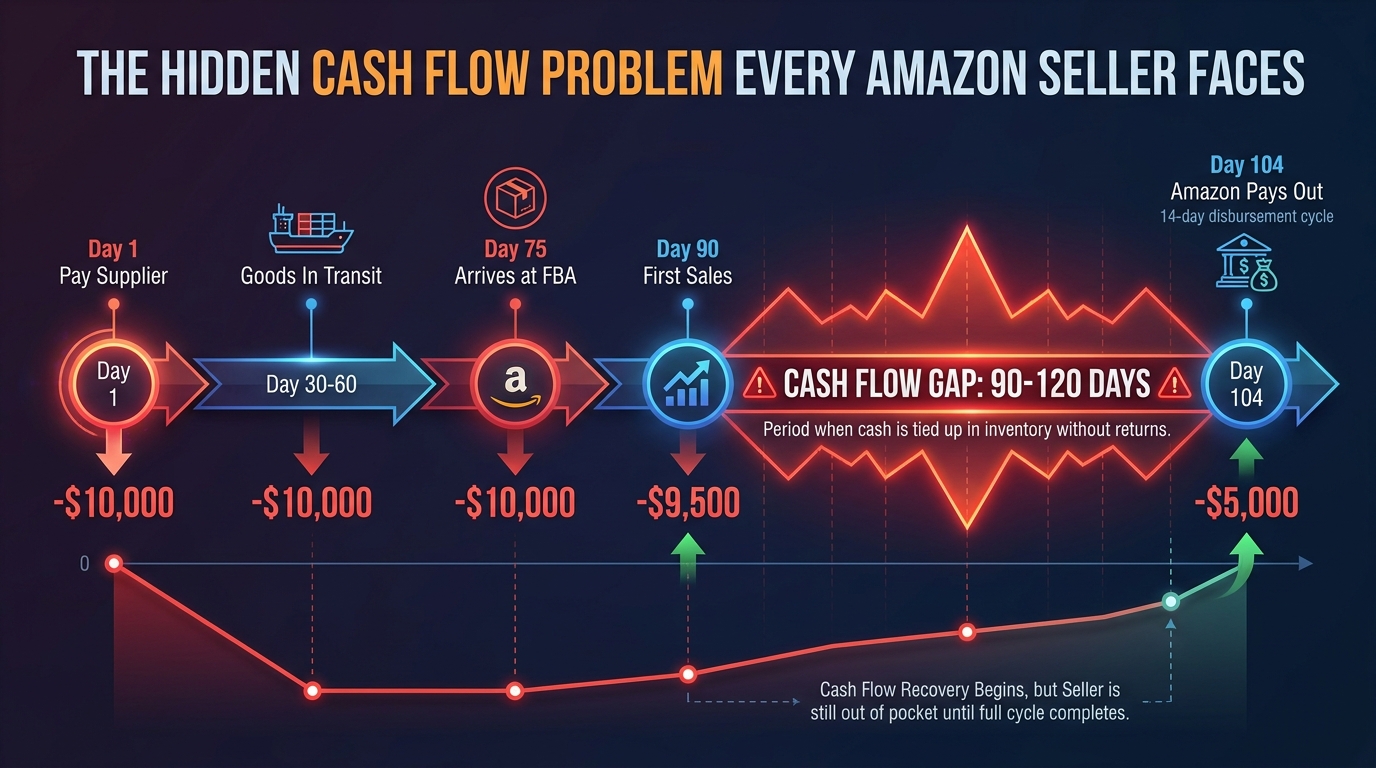
Profit margins and cash flow are not the same thing, and Amazon’s payment structure makes them diverge dramatically. This is one of the most consequential structural realities of the FBA business model — and it is underestimated by the majority of sellers, particularly those who are growing quickly.
The Cash Flow Timeline
Consider the lifecycle of a single inventory replenishment order for a typical FBA seller with a Chinese manufacturer:
- Day 1: Supplier payment due — most require a 30–50% deposit on order placement.
- Day 30–60: Production, quality control, and export preparation.
- Day 45–75: Ocean freight transit — sea freight is cheaper than air but slower. For most FBA sellers, the economics favor sea freight.
- Day 75–90: Customs clearance, domestic trucking, FBA check-in, and putaway.
- Day 90+: First sales begin.
- Day 104+: Amazon’s disbursement cycle pays out every 14 days, and newly activated inventory often takes a full cycle before funds hit the seller’s bank account.
From the moment a seller pays their supplier to the moment they receive revenue from Amazon, 90 to 120 days is typical. For air freight shipments, the cycle compresses to 45–60 days — but air freight costs 5–8x more than sea, and that cost comes directly out of the margin the seller is trying to protect.
How Growth Amplifies the Problem
The insidious element of the inventory cash flow gap is that it gets worse as the business grows, not better. A seller moving $50,000 per month in revenue might have $80,000–$120,000 of working capital tied up in inventory at any given time — in transit, at FBA, or committed in supplier deposits. A seller growing to $200,000 per month needs to fund $300,000–$500,000 of working capital. Growth demands cash before it generates cash.
This is why many Amazon sellers who build a genuinely profitable business by margin percentages nonetheless find themselves in a cash crunch during growth phases. Revenue is growing, profit is being generated, but the cash is trapped in inventory somewhere in the supply chain. Without adequate working capital — whether from retained earnings, a credit facility, or inventory financing — the natural ceiling on growth is set by the seller’s liquid cash position rather than their market opportunity.
Practical Levers on the Cash Flow Gap
The sellers managing this well in 2026 are typically doing some combination of the following:
- Negotiating longer payment terms with suppliers — net-30 or net-60 on the balance payment after deposit — to delay cash outflows relative to when goods ship.
- Using inventory financing or revenue-based financing — facilities specifically structured around Amazon disbursement cycles — rather than conventional bank credit lines that are harder to access for marketplace businesses.
- Running tighter inventory models that prioritize sell-through rate over in-stock rate, accepting the occasional stockout risk in exchange for lower average capital tied up in inventory.
- Tiering their product launches so that new products are funded from cash flow generated by existing profitable products rather than through fresh capital infusions.
None of these are exotic strategies. But they require modeling the cash flow cycle explicitly rather than assuming that profitability and liquidity are the same thing — a mistake that has forced more than a few sellers with healthy P&Ls into genuine operational distress.
The Advertising Trap: When Your Ad Spend Is Buying Revenue, Not Profit
Amazon’s advertising business crossed $68.6 billion in 2025. That is not Amazon’s total revenue — that is just the money sellers and brands paid to buy visibility on the platform. It is the world’s third-largest digital advertising business, behind only Google and Meta, built almost entirely on fees paid by the same sellers who also pay Amazon referral fees and FBA fees on every sale those ads generate.
The structural problem with Amazon advertising in 2026 is not that it doesn’t work. Sponsored Products, in particular, remains one of the most efficient paid acquisition channels available to product brands because it captures purchase intent at the moment of search. The problem is that as more sellers spend more money competing for the same eyeballs, the auction price of visibility rises, and the margin left after advertising declines — often without sellers noticing quickly enough.
The ACoS Illusion
Advertising Cost of Sale — the ratio of ad spend to attributed sales — is the metric most Amazon sellers use to evaluate their campaigns. But ACoS has a structural limitation: it measures the cost of attributed sales, not the cost of all advertising-influenced outcomes. A seller running a 20% ACoS might look efficient until they model the full picture:
- Referral fee on the sale: 15%
- FBA fulfillment fee: 12%
- Advertising (ACoS): 20%
- Storage: 2%
- Cost of goods: 30%
- Total: 79% of revenue spoken for — leaving 21% gross margin before overhead, returns, or account-level fixed costs.
A 20% ACoS that looks healthy at the campaign level produces thin profitability at the business level when layered onto the full fee stack. And in competitive categories, 20% ACoS requires active management — left to optimize passively, campaigns in high-competition niches drift upward as bid auctions respond to category-wide spending pressure.
The New Launch Tax
The problem is most acute during product launches. Getting a new ASIN to rank organically requires sales velocity, and generating sales velocity on an unranked product requires advertising. The typical new product launch requires running at 40–70% ACoS for the first 30–90 days — not because the campaigns are poorly managed, but because the organic rank that would reduce the required ad spend does not exist yet. The advertising spend required to earn organic rank is a sunk cost of launch. Sellers who don’t model this upfront are routinely surprised when their launches show months of losses followed by uncertain profitability once rank is established.
Protecting Margin in a Crowded Auction
The sellers managing advertising costs effectively in 2026 share several practices:
- Setting target ACoS at the product level based on actual margin contribution, not category benchmarks or platform averages.
- Using dayparting and placement modifiers to concentrate spend during peak conversion windows rather than running flat bids 24/7.
- Building and aggressively maintaining negative keyword lists to prevent spend on irrelevant queries.
- Treating launch ACoS as a capital investment in organic rank — budgeted separately from ongoing advertising — rather than as an operational marketing cost to minimize immediately.
Amazon’s AI Recommendation Shelf: The Third Discovery Surface
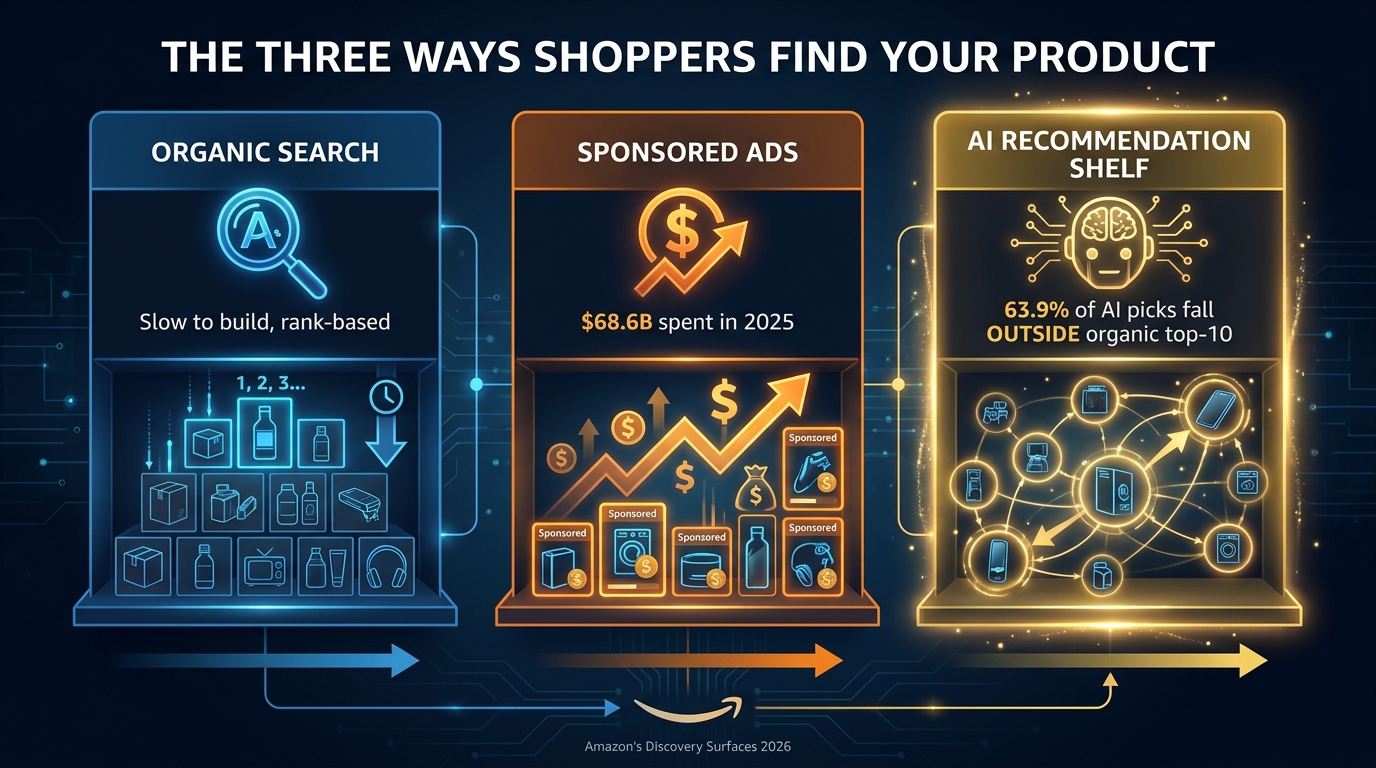
In May 2026, Amazon renamed Rufus as Alexa for Shopping, embedding the AI recommendation engine more deeply into the search and shopping experience. What followed — documented in one of the first large-scale studies of AI shopping recommendations on Amazon — is one of the most significant structural shifts in how products get discovered on the platform in years.
The study, conducted by Autopilotbrand.com and analyzed by Marketplace Pulse, captured 1,963 non-branded queries and 12,810 recommendations from Alexa for Shopping in May and June 2026. The findings are striking.
What the AI Actually Recommends
63.9% of Alexa for Shopping’s recommendations fell outside the organic top-10 for the matched search term. More dramatically, 40.9% of the AI’s picks never appeared on the visible search results page at all — products that would be invisible to a shopper conducting a standard search. Only 14.3% of picks were products running a sponsored listing on that search page, and 83% of those already ranked organically anyway.
The implications are profound. Amazon’s search page — the surface that sellers have spent years and billions of dollars optimizing for — may not be the primary surface through which AI recommendations are generated. The AI appears to be consulting a different, broader, and deeper slice of the catalog than the one that organic rank and ad spend have traditionally surfaced.
As Christian Umbach, Co-Founder & CEO of Autopilotbrand.com, noted in the Marketplace Pulse analysis: “We’re seeing the emergence of a third shelf alongside organic search and paid placements. Brands cannot simply buy or rank their way onto it; they need to give Amazon’s AI enough context to understand when and why their product is the right recommendation. That means richer catalog data, optimization around shopper intent, and continuous updates as seasonal use cases and product differentiators evolve. For products that do not yet own the top of search, this creates an entirely new path to compete.”
What “Richer Catalog Data” Actually Means in Practice
The AI’s apparent indifference to rank and advertising spend creates an unusual opening: a surface where the quality and completeness of your product data matters more than your ad budget or the age of your sales history. Products that are well-suited to the AI recommendation shelf share some common characteristics:
- Comprehensive backend attribute completion: Every product type has structured attributes in the catalog — material, dimensions, use case, compatibility, certifications. Listings with fully completed attribute sets give the AI more signal about when a product is the right recommendation.
- Intent-aligned copy: Listing copy that speaks to the specific use cases and problems a product solves — rather than generic category language — helps the AI understand the recommendation context.
- Seasonal and contextual keywords in bullet points: Adding language that reflects seasonal relevance, gifting occasions, or specific user scenarios expands the range of queries for which the AI considers a product relevant.
- A+ content that answers “why this product”: Enhanced content that addresses comparison scenarios, use-case fit, and decision criteria gives the AI narrative context that raw product attributes alone cannot provide.
The Strategic Implication
The AI recommendation shelf is currently the rare surface on Amazon where incumbency is a weak advantage — where a product outside the top search results can appear in front of a buyer who would never scroll to find it. That asymmetry creates a real opportunity for sellers who invest in catalog quality over ad spend. It also mirrors what search looked like before the ad load arrived. The sellers learning how this surface selects now are positioned to benefit before the monetization dynamics that have compressed every previous Amazon discovery channel find their way to this one too.
Amazon Business: The $60 Billion Channel Most Sellers Haven’t Touched
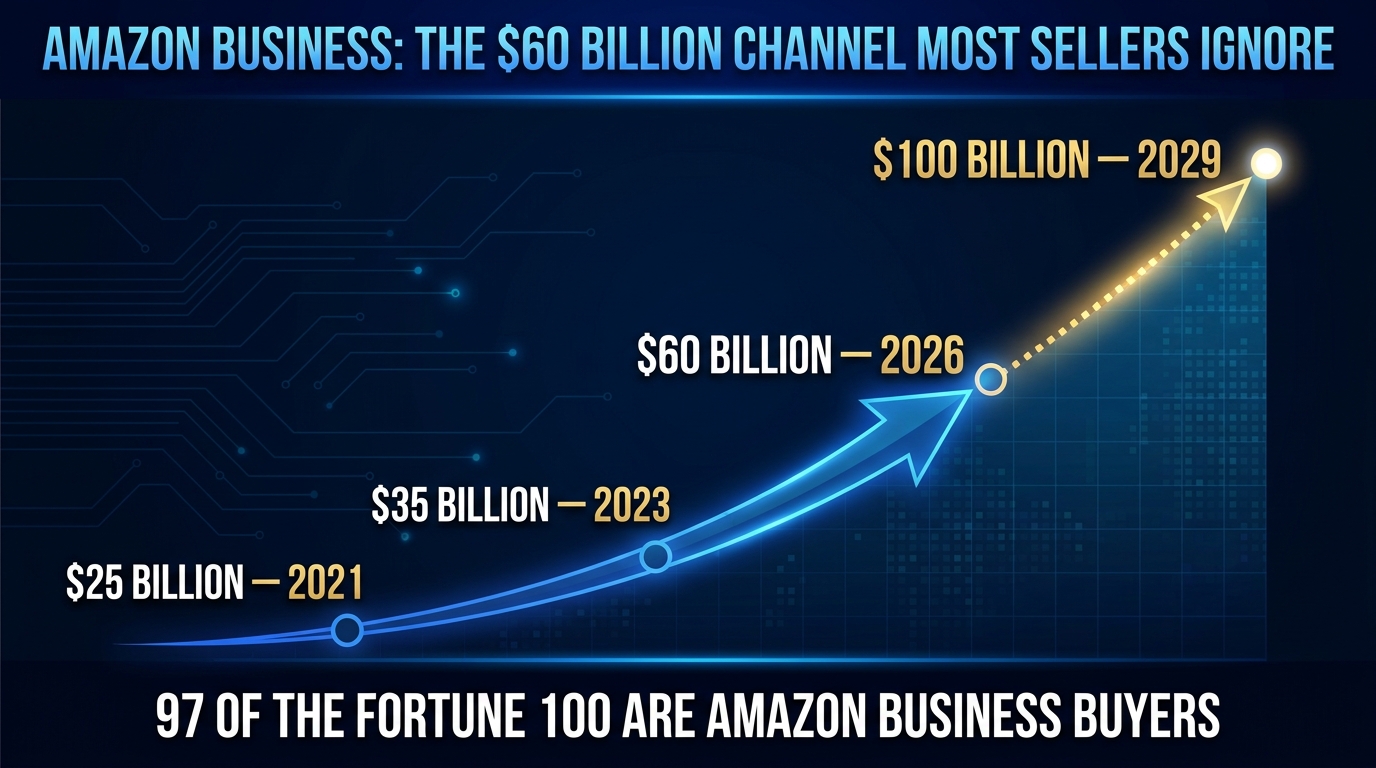
Amazon Business reached $60 billion in annualized gross sales in July 2026, up from $35 billion in 2023 and $25 billion in 2021. Growing at roughly 18% annually — nearly double the baseline growth rate of U.S. e-commerce — it sits on a trajectory to reach $100 billion before the end of the decade. It already represents roughly 7% of Amazon’s $830 billion total GMV, and its buyers include 97 of the Fortune 100, plus hospitals, universities, and government agencies.
And the vast majority of Amazon sellers have done almost nothing to capture it.
Why Amazon Business Is Structurally Attractive for Sellers
The B2B buyer on Amazon behaves differently from the consumer buyer in ways that are almost uniformly favorable to sellers. Business buyers are less price-sensitive in the comparison-shopping sense — procurement decisions are driven by reliability, tax documentation, payment terms, and supplier relationships as much as by price. Business orders are larger on average. Business buyers repurchase at higher rates because procurement relationships are sticky in ways that consumer purchasing is not.
Marketplace Pulse’s analysis frames the opportunity cleanly: B2B demand arrives through listings sellers already maintain, at higher average order values, from customers that include some of the most creditworthy institutions in the world. The incremental revenue captured through quantity discounts on existing inventory is a fundamentally different proposition than incremental revenue bought through an advertising auction.
The Asymmetry Amazon Has Built
Amazon has invested heavily in the buyer side of Amazon Business. Features in 2026 include an AI assistant for account management, Savings Insights for spend analysis, Spend Anomaly Monitoring, dedicated delivery logistics for commercial facilities across 13 states, and Prime Business bundled with enterprise software partnerships including CrowdStrike, Gusto, and QuickBooks. The buyer experience is being rebuilt for enterprise procurement.
The seller side, by contrast, has seen relatively modest changes. The tools available to sellers who enroll in Amazon Business — business-only pricing, quantity discount tiers, business-only listings, custom quote responses — have existed for years. That asymmetry is the opportunity. Amazon is actively driving enterprise buyers toward the marketplace. The sellers who have configured their Business offerings are the ones who will capture that demand.
What Enrolling in Amazon Business Actually Requires
The practical steps to capture Amazon Business demand are less complicated than sellers often assume:
- Enroll in the Amazon Business program through Seller Central — available to Professional sellers at no additional fee.
- Set business-only prices — typically a small discount below consumer pricing, sufficient to trigger algorithmic preference in Business search results without meaningfully degrading consumer margin.
- Create quantity discount tiers — even modest discounts of 3–5% for orders of 5+, 10+, or 25+ units can be decisive for procurement buyers with recurring needs.
- Ensure complete tax documentation — B2B buyers expect clear product tax codes and documentation support.
- Add product certifications and compliance documentation to listings — safety certifications, materials documentation, and regulatory compliance information matter to procurement officers in ways they rarely do for consumer purchases.
The sellers who have done this systematically are generating meaningful incremental revenue from the same catalog they maintain for consumer sales — without additional ad spend, without additional inventory, and without competing in the consumer price auction for every sale.
Building a Durable Amazon Business: What the Data Says About Who Lasts
The data from 2026 points clearly to what separates sellers who sustain top positions from those who fade: it is not primarily tactics or tools. It is structural decisions made early — about product type, price point, differentiation, and brand positioning — that either set a business up for compounding advantages or leave it fighting on terrain where incumbents and factory-direct entrants have permanent structural advantages.
Price Point and Defensibility
The divergence between American and Chinese sellers in the top 10,000 — with American sellers averaging $47.62 per unit versus $22.03 for Chinese sellers — is not coincidental. High-price-point products generate more margin per unit in absolute dollars, which funds the brand investment, catalog development, and advertising precision that protect position over time. They are also less attractive terrain for factory-direct entrants operating on thin per-unit margins.
This does not mean every seller needs to sell expensive products. It means the economics of competing at low price points require either manufacturing proximity that most non-factory sellers cannot replicate, or volume that requires capital most individual sellers cannot sustain. The sellers building durable businesses are increasingly those who have chosen to compete on value rather than price.
Brand as a Compounding Asset
The most durable moat on Amazon is a brand that generates repeat purchases, review velocity, and search volume independent of the ad auction. Brand-searched traffic — customers who type your brand name rather than a generic category term — converts at higher rates, requires no ad spend, and is completely immune to PPC competition.
Building brand-searched traffic takes time and external marketing — social media, email lists, content, influencer partnerships. These are investments that most marketplace-first sellers are reluctant to make because they do not appear on Amazon’s own dashboards. But the sellers in the top 100 who are holding their positions are overwhelmingly those who have built customer relationships that extend beyond any single marketplace.
Catalog Depth vs. Breadth
The instinct to launch more products — to spread risk across more ASINs, to chase more categories — is understandable but often counterproductive. The sellers who sustain top-10,000 positions are typically building deep into fewer categories rather than spreading thinly across many. Deep catalog investment in a category — multiple complementary products, extensive variation selection, comprehensive review coverage — creates algorithmic and social proof advantages that a broad, shallow catalog cannot replicate. Amazon rewards sellers who own a category with cross-sell positioning, “frequently bought together” adjacency, and brand store prominence. None of those advantages compound in a catalog that is one product per category across 40 categories.
Conclusion: The Squeeze Is Real — But So Is the Path Through It
The Amazon marketplace in 2026 is not a place where it has become impossible to build a profitable business. It is a place where it has become impossible to build one accidentally. The structural forces — rising fees, intensifying competition, an increasingly winner-takes-all GMV distribution, and an advertising auction that extracts more seller value every year — are real and well-documented.
But so are the structural opportunities. E-commerce is growing at its fastest rate in five years. Amazon Business is growing at 18% annually toward $100 billion. The AI recommendation shelf is a nascent, unmeasured surface where catalog quality matters more than ad budget. And the sellers who hold the most durable positions in the marketplace are doing so not by spending more or launching faster, but by making smarter structural decisions about where they compete and how they build.
The path through the squeeze is not complicated, but it requires honesty about the numbers:
- Model the full cost stack — not just COGS and referral fees, but FBA, storage, advertising, and returns. Know what your actual net margin is, not what your gross margin suggests it should be.
- Treat cash flow as a separate problem from profitability — understand your inventory capital cycle and ensure you have the working capital to grow without hitting a liquidity ceiling.
- Choose your competitive terrain deliberately — the data is clear that competing on price with factory-direct sellers is a losing game for most Western brands. Compete on value, differentiation, and brand equity.
- Invest in catalog quality for AI discovery — complete your product attributes, optimize for intent-based copy, and treat the AI recommendation shelf as a channel worth building for now, before it gets monetized.
- Enable Amazon Business — it is the easiest incremental revenue channel most sellers have not touched, serving buyers with higher average order values who are actively purchasing from the catalog you already maintain.
- Build toward brand-searched traffic — every customer who searches for your brand by name is a customer who cannot be outbid from you in the Sponsored Products auction.
The sellers who survive the squeeze are not the ones who hustle harder at the same things everyone else is doing. They are the ones who read the structural data clearly and position their businesses on the right side of it.