



Most Amazon sellers can tell you last month’s sales within a few dollars. Far fewer can tell you what one unit of their best SKU actually earned after every cost touched it. That gap explains why plenty of accounts grow revenue for two years and still feel broke.
This post is a per-unit profit audit. It doesn’t chase the latest feature or algorithm change. It walks through the price-to-payout ladder, step by step, so you can find where margin leaks in your own catalog.
A note on the numbers: Amazon’s fee schedules change often and vary by category, size and weight tier. Every figure below is a hypothetical example to show the method. Replace them with your own data from Seller Central before making decisions.
The Price-to-Payout Ladder
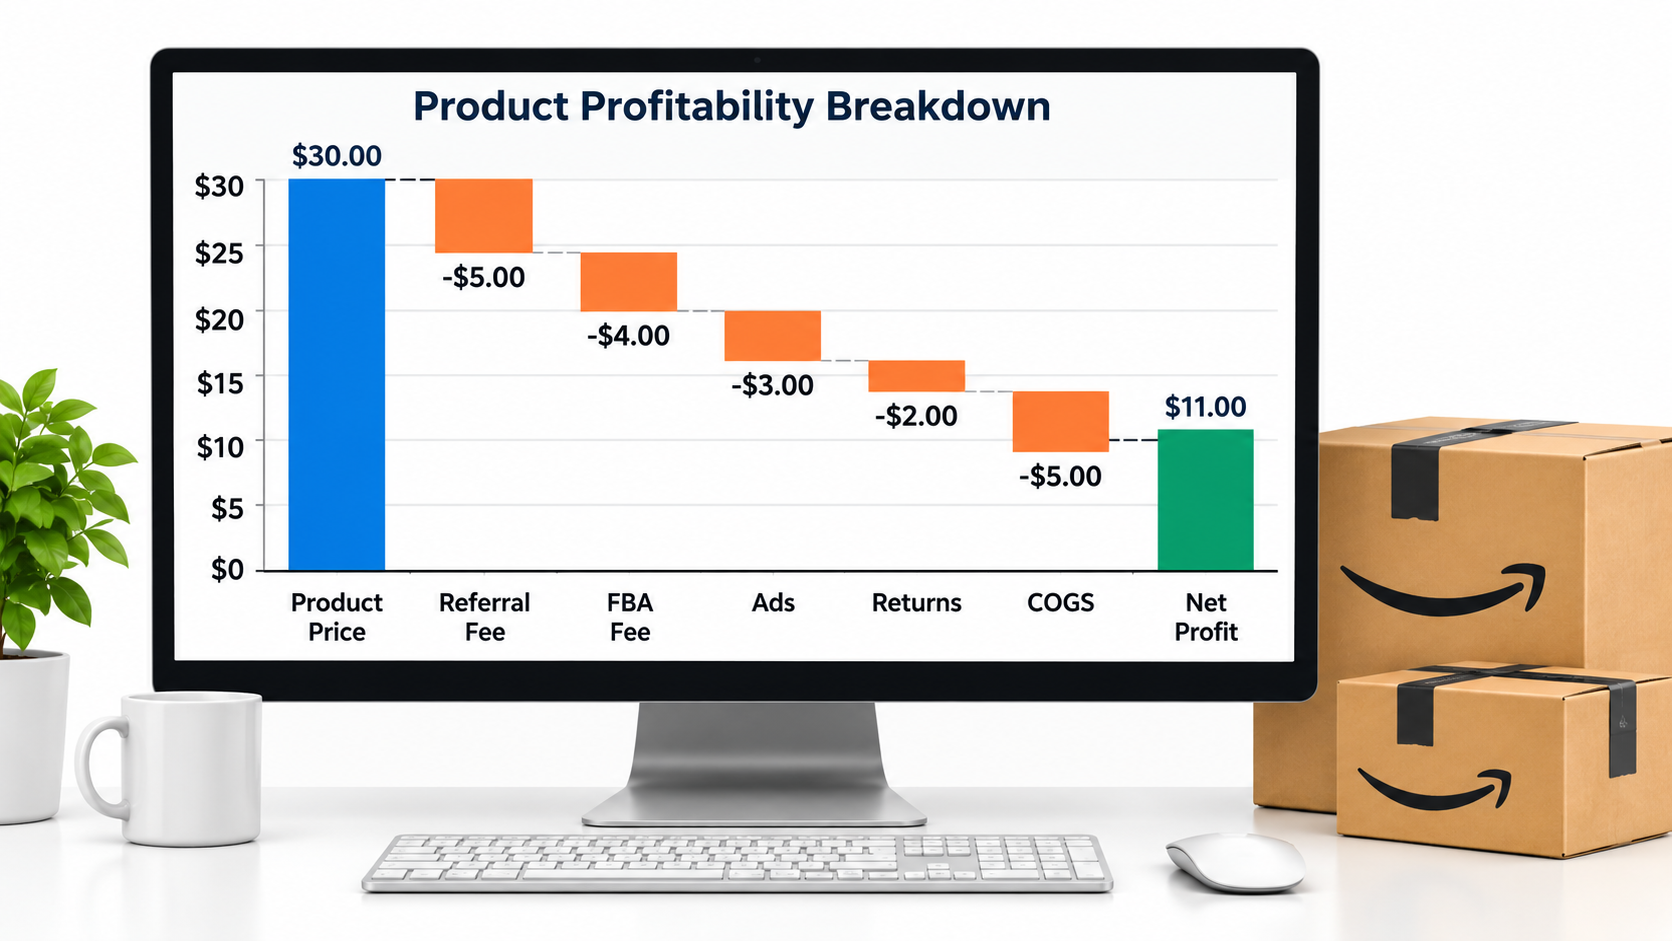
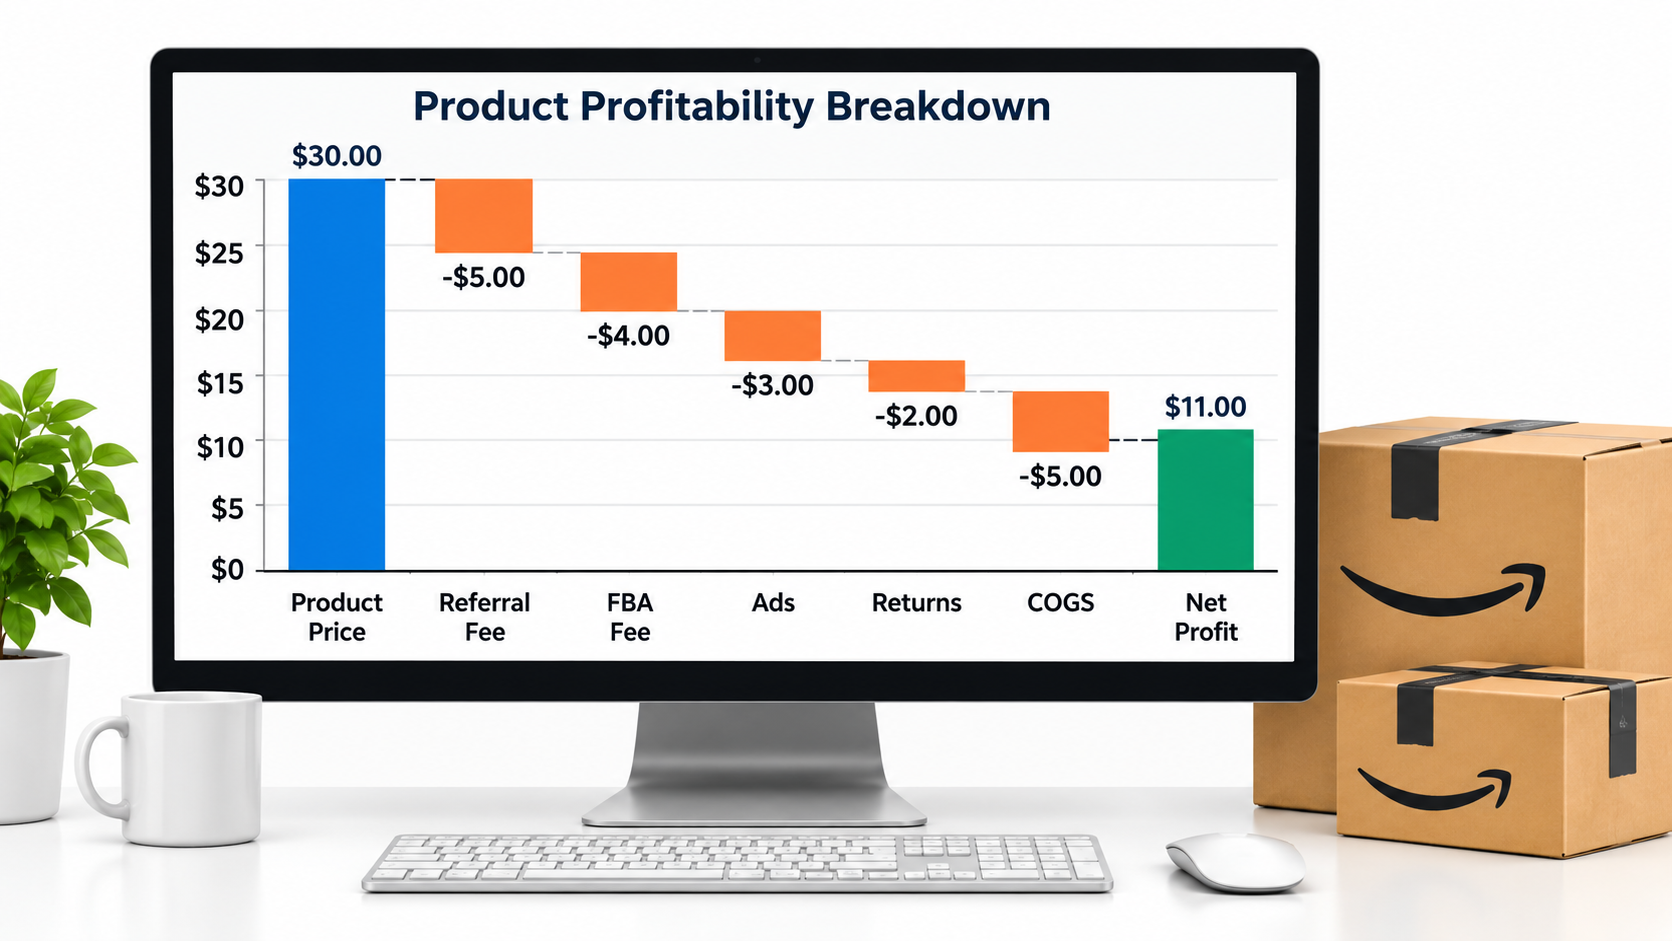
Think of your sale price as the top rung of a ladder. Each cost takes you down a rung, and what is left at the bottom is the only number that pays you.
Here is a hypothetical $30 product:
- Sale price: $30.00
- Referral fee (assume 15%): $4.50
- FBA fulfillment fee (assumed): $5.00
- Landed cost of goods, including freight and duties: $7.00
- Inbound shipping to Amazon and prep: $0.80
- Advertising (assume 12% of sales): $3.60
- Returns and damage reserve: $1.00
- Remaining per unit: $8.10, or 27%
A 27% margin looks healthy. Now notice how little room it has. A 10% rise in freight and duties, a few more ad points and a higher return rate can cut it nearly in half without any single change looking alarming.
Why a single margin number misleads
Many sellers calculate margin once, at sourcing time, and never revisit it. Fees, ad costs and returns move continuously. A margin you calculated at launch describes a product that no longer exists.
The fix is to rebuild the ladder per SKU on a regular schedule, monthly at minimum, using actual settlement and ad data rather than estimates.
Step One: Separate Fixed Fees From Controllable Costs
Not every rung on the ladder is yours to change. Sorting them tells you where to spend effort.
Costs you mostly can’t control
Referral fees are set by category. Fulfillment fees depend on size and weight tier, so they are tied to your product and packaging. Storage fees depend on volume and time.
Costs you can influence
Packaging dimensions, ad spend, return rate, supplier pricing, freight method and inventory age are all in your hands. Of these, packaging is the most overlooked. Shaving a fraction of an inch can move a product into a cheaper size tier, and that saving repeats on every unit you ever ship.
Check your product’s measured dimensions in Seller Central against your actual packaged size. Mismatches in either direction are worth investigating, since they affect fees and can cause compliance problems.
Step Two: Treat Advertising as Two Different Costs
Advertising is usually the largest controllable cost, and it is almost always reported as one number. That hides a useful distinction.
Launch spend versus maintenance spend
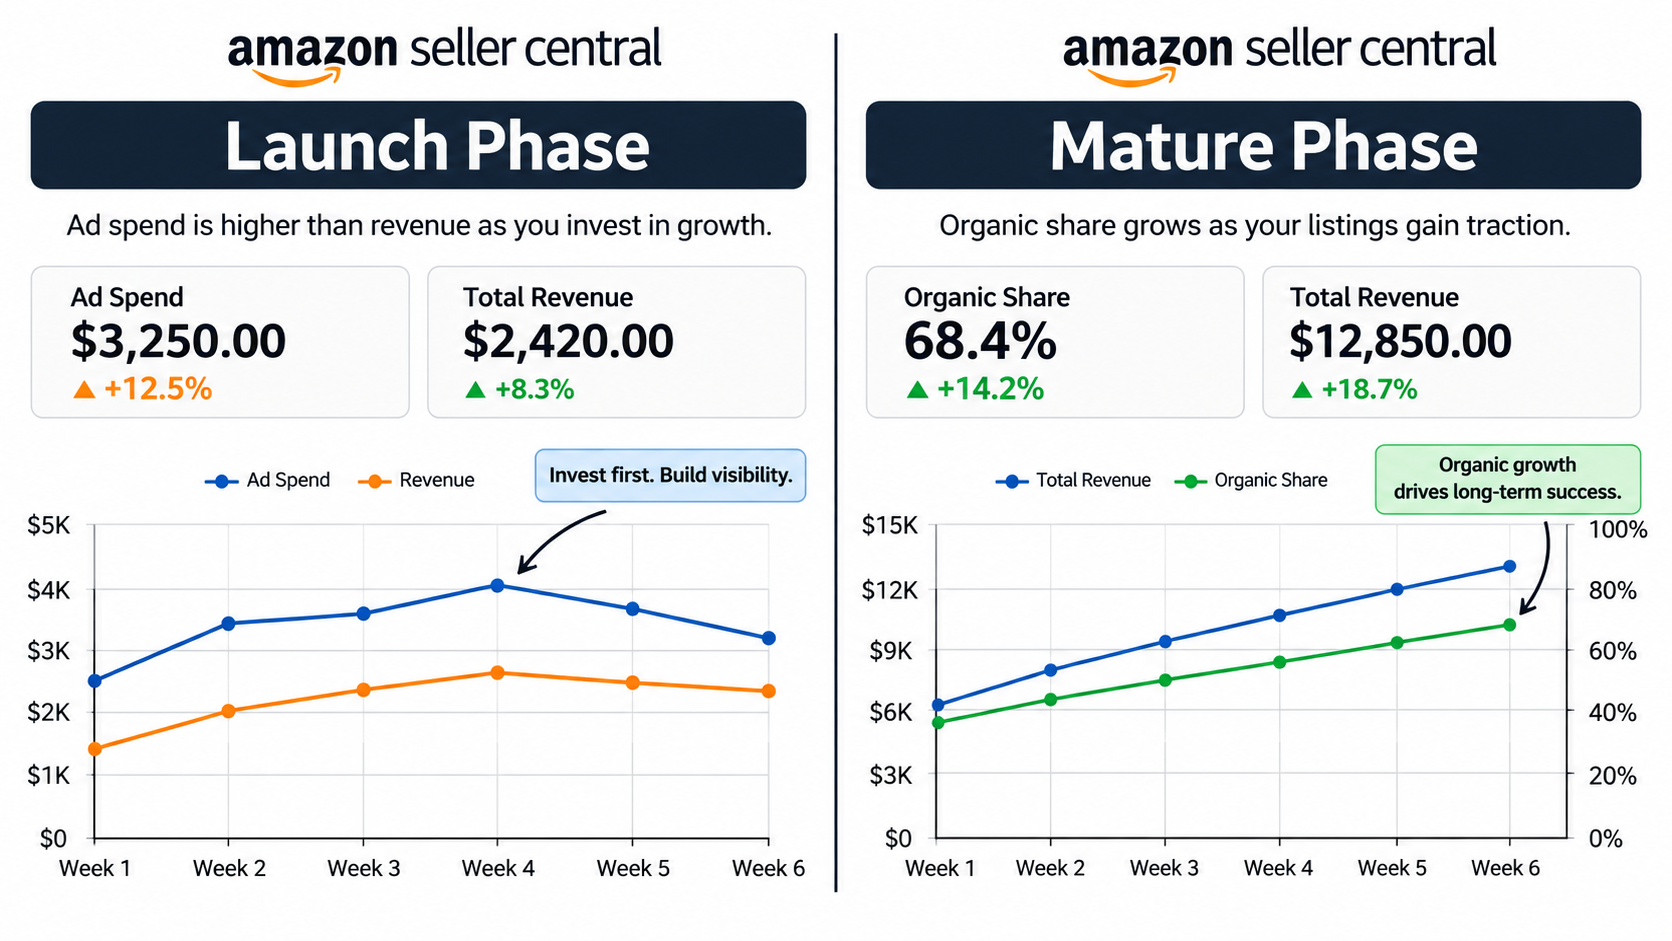
Launch spend buys visibility, reviews and ranking for a new listing. It is an investment with an expected end. Maintenance spend defends position and captures existing demand. It should be judged on return, like any ongoing expense.
If you blend both into a single ACOS figure, a mature product carrying launch-level spend looks the same as a new product in a healthy ramp. They need different decisions.
Use TACOS alongside ACOS
ACOS measures ad spend against ad-attributed sales. TACOS measures ad spend against total sales, including organic. Falling TACOS over time on a given SKU suggests ads are building organic momentum. Flat or rising TACOS with no growth suggests you are renting every sale.
Set a break-even ACOS per SKU from your ladder: your margin before ad cost. In the example above, that is 27% plus the 12% ad share, so roughly 39%. Spending beyond that on a sale loses money on that sale, though it may still be justified during launch.
Step Three: Count Returns Honestly
Returns hit twice. You may refund the customer, and the returned unit may come back unsellable or only sellable at a discount. Categories like apparel and items with sizing or fit questions tend to see more returns than simple consumables, though your own report is what matters.
Where to find your real return rate
Seller Central’s returns reports and customer feedback show reason codes. Group them. Sizing confusion, “not as described” and damage-in-transit each point to a different fix: better size charts, more accurate images and copy, or sturdier packaging.
Treat return reasons as a listing brief
“Not as described” is a listing problem, and you can fix it for free. Add a dimensions image, a use-case image or a comparison to common alternatives. Lower returns raise margin without touching price or cost.
Step Four: Inventory Age Is a Cost That Arrives Late
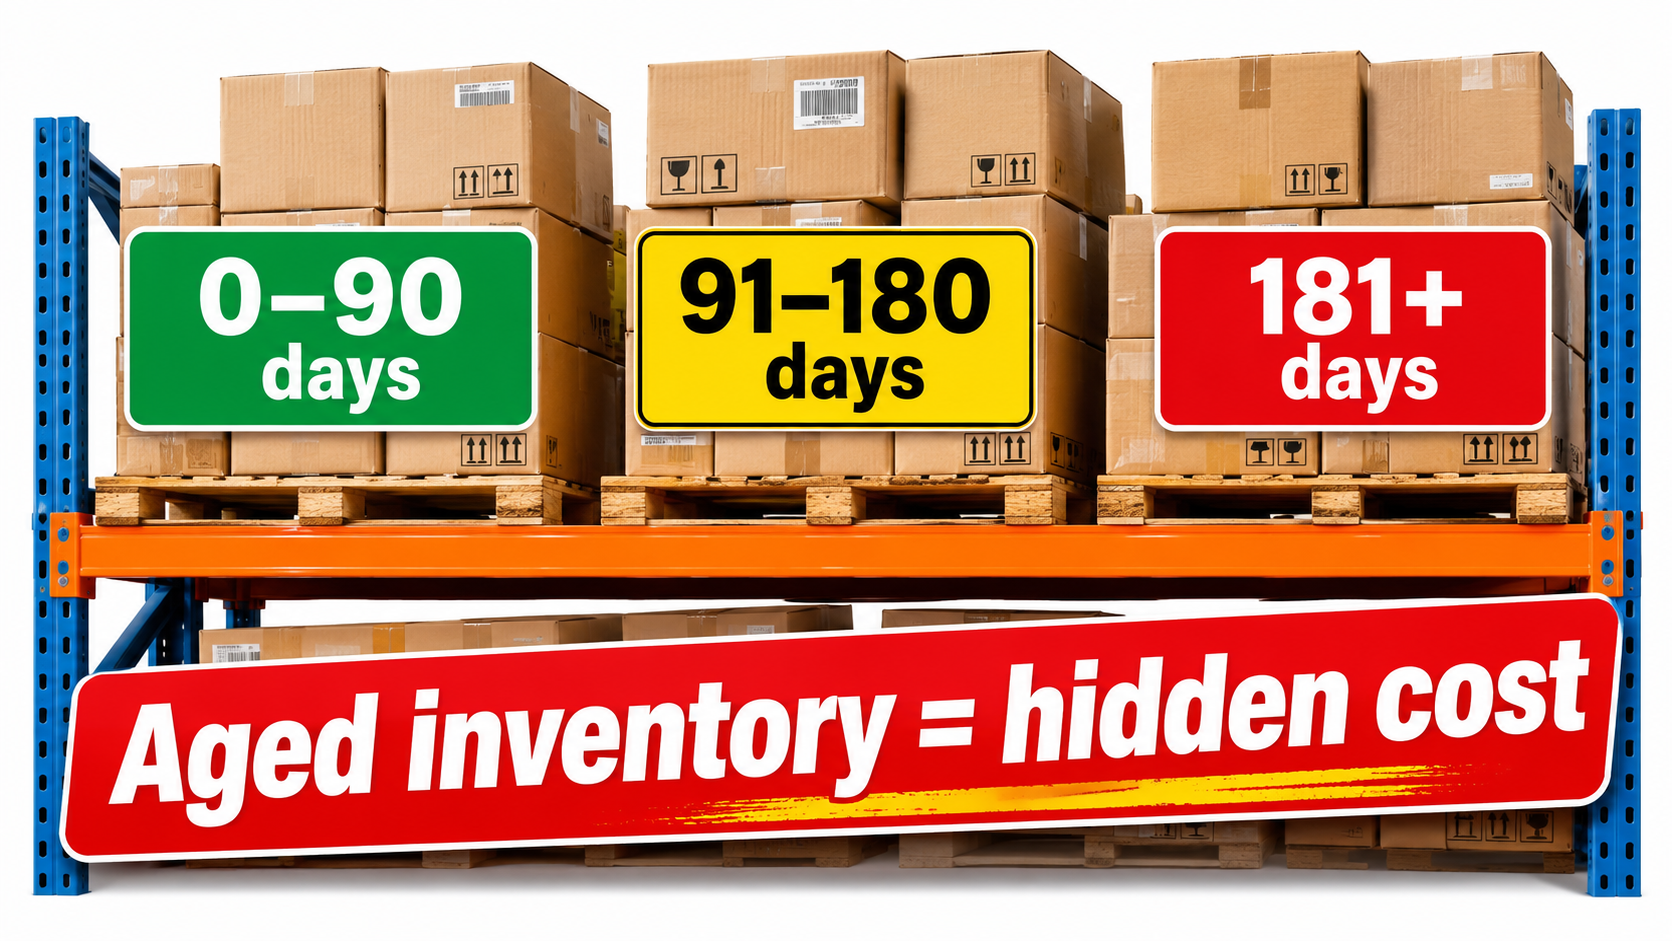
Storage fees are visible. The larger cost of slow inventory is capital tied up, plus the potential for age-based surcharges and eventual liquidation at a discount.
Days of cover
Calculate days of cover for every SKU: units on hand and in transit divided by average daily sales. Compare it to your lead time plus a safety buffer. Far above that figure, you are overstocked. Below it, you risk a stockout that damages ranking.
Decide early, not late
When a SKU drifts into slow territory, act while you still have options: a promotion, a bundle, a price test or a removal order. Waiting until storage surcharges apply narrows the choices and shrinks the recovery.
Stockouts are the opposite risk. A product that goes out of stock can lose search position that takes weeks to rebuild. Use days of cover to find the middle ground rather than defaulting to either extreme.
Step Five: Measure the Cash Cycle, Not Just Profit
A profitable product can still starve your business of cash. You pay the supplier first, wait through production and shipping, wait while stock is checked in and sold, and only then receive disbursement.
Cash conversion in days
Add up the days from supplier payment to your first payout on that stock: production, transit, receiving, selling through, and the payout cycle. A SKU that returns 27% margin but takes 150 days to turn cash may be worse for growth than a 18% margin SKU that turns in 60.
Return on inventory dollars
Compare SKUs by annualized profit per dollar of inventory invested. The ranking often differs from a ranking by margin percentage, and it tells you where the next restocking dollar should go.
Step Six: Build a SKU Scorecard
Once you have the inputs, put them in one table so decisions are fast and consistent.
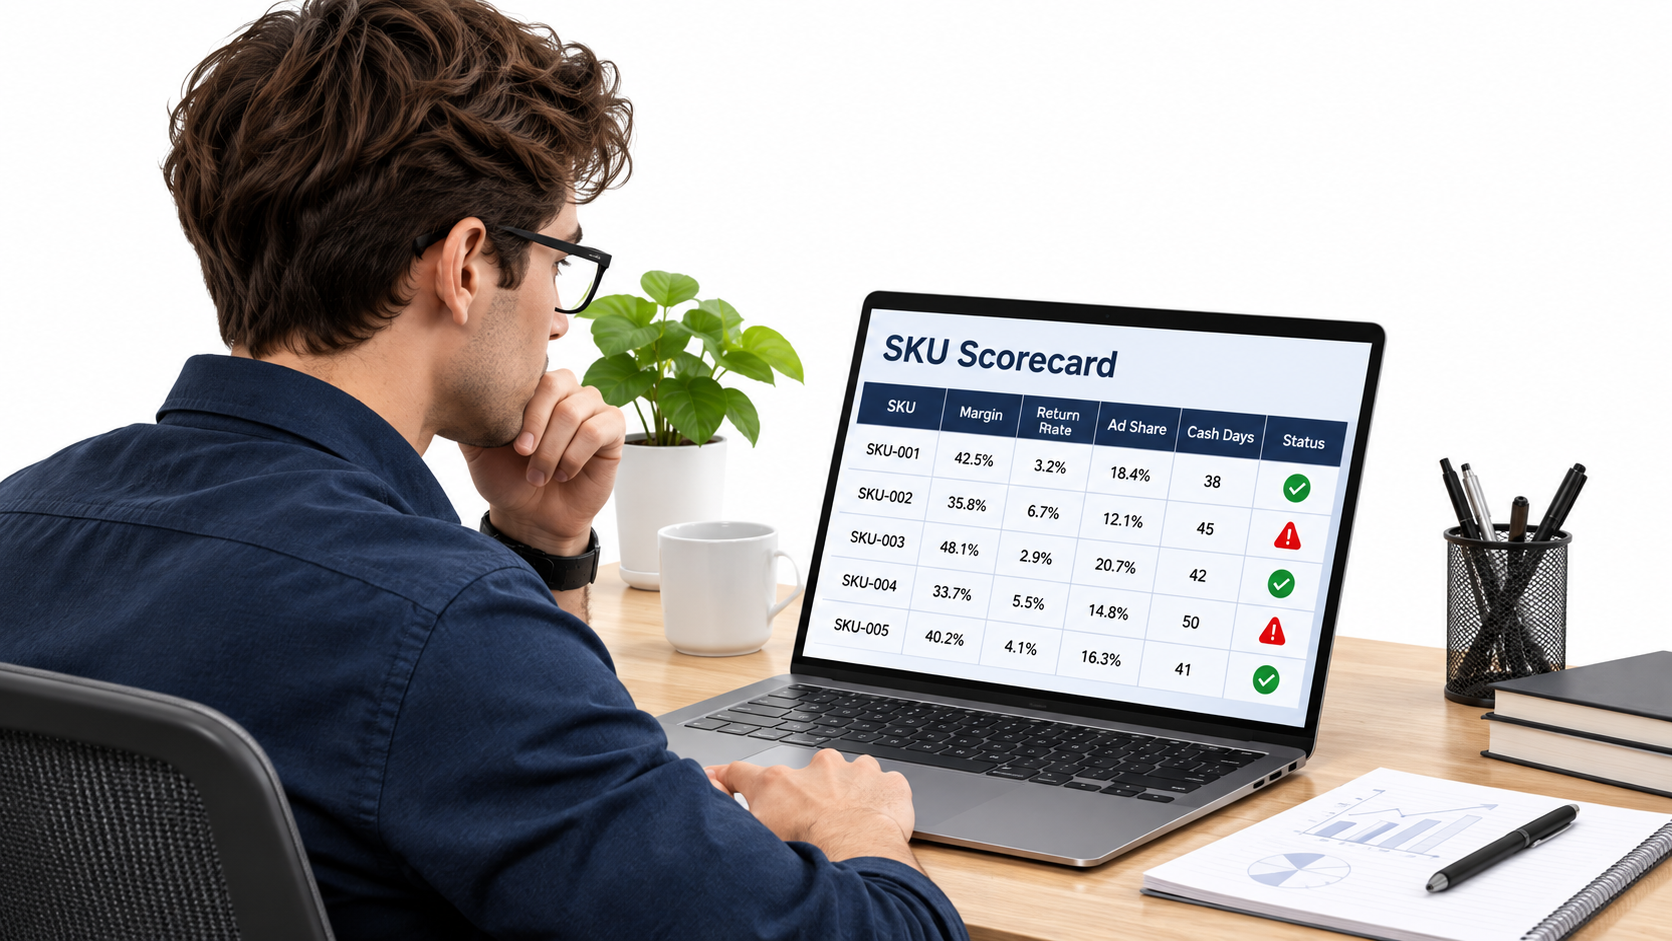
Suggested columns
- Net profit per unit after all costs
- Net margin percentage
- Break-even ACOS and current ACOS
- TACOS trend over three months
- Return rate and top return reason
- Days of cover
- Cash conversion days
- Annualized profit per inventory dollar
Sort SKUs into four actions
- Scale: strong margin, quick cash turn, healthy TACOS trend. Restock and invest.
- Fix: good demand, weak margin. Look at packaging tier, returns, ad waste and supplier pricing.
- Harvest: mature, stable. Trim ads to break-even and collect cash.
- Exit: low margin, slow turn, no fix. Clear it and reuse the capital.
Common Mistakes in Profit Tracking
Ignoring costs that sit outside the settlement report
Software subscriptions, photography, samples, inspection, prep, and your own time never appear in Amazon reports. Allocate them across SKUs, even roughly.
Averaging across the catalog
A catalog-wide margin hides winners subsidizing losers. Always read per SKU, and for variations, per variation.
Using list price instead of realized price
Coupons, deals and promotions lower realized price while fees may still follow the sale price. Use actual average selling price from your reports.
Forgetting reimbursements and fee errors
Lost or damaged inventory and incorrect dimension fees can be eligible for reimbursement or correction. A periodic check of these reports can recover money you have already earned.
A 30-Day Audit Plan
- Week 1: Export 90 days of settlement, ad and returns data. Rebuild the ladder for your top five SKUs by revenue.
- Week 2: Compare packaging dimensions to fee tiers, and set break-even ACOS per SKU.
- Week 3: Calculate days of cover and cash conversion. Flag SKUs that are overstocked or at stockout risk.
- Week 4: Assign each SKU to scale, fix, harvest or exit, and set one measurable action for each.
Conclusion
Amazon selling rewards sellers who know their per-unit numbers better than their sales totals. The ladder from price to payout shows where profit goes, and each rung offers a lever: packaging, ad structure, return reduction, inventory age and cash timing.
Start with your top five SKUs this week. Rebuild the ladder with real data, sort them into the four actions, and commit to one change per SKU. Revenue is easy to grow. Margin that survives is the harder and more valuable result.