



Most conversations about Amazon selling start with tactics: keywords, images, PPC structures, launch sequences. Those matter. But in 2026, the most useful thing a seller can understand isn’t a tactic. It’s the shape of the marketplace itself, and that shape has changed a lot in a short time.
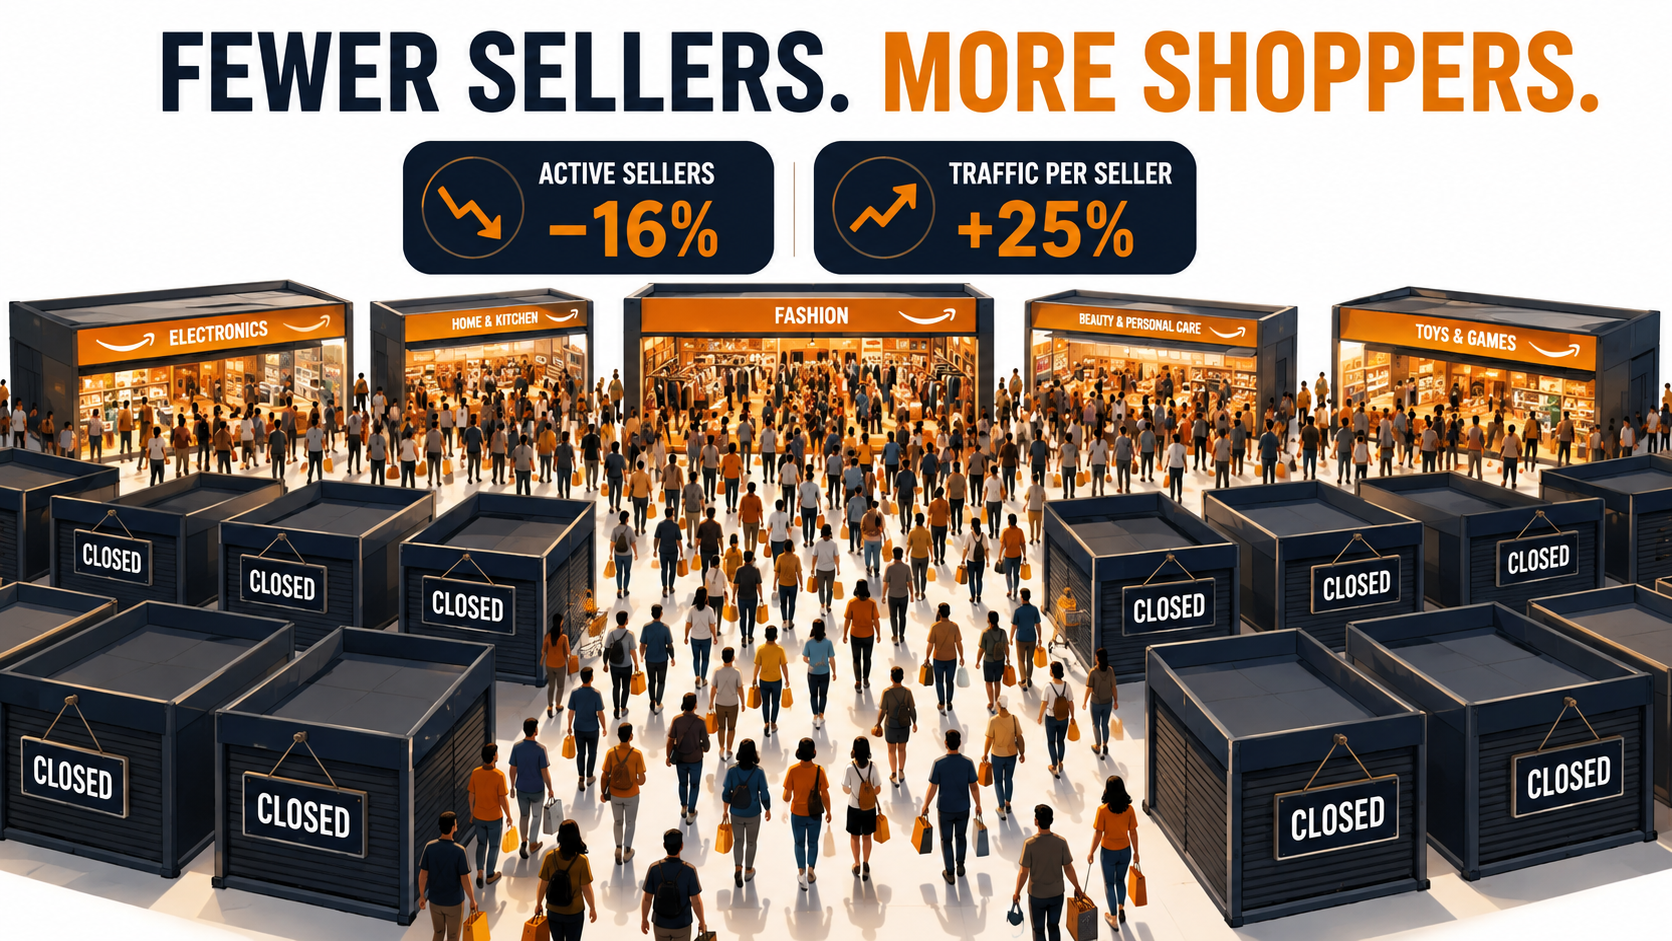
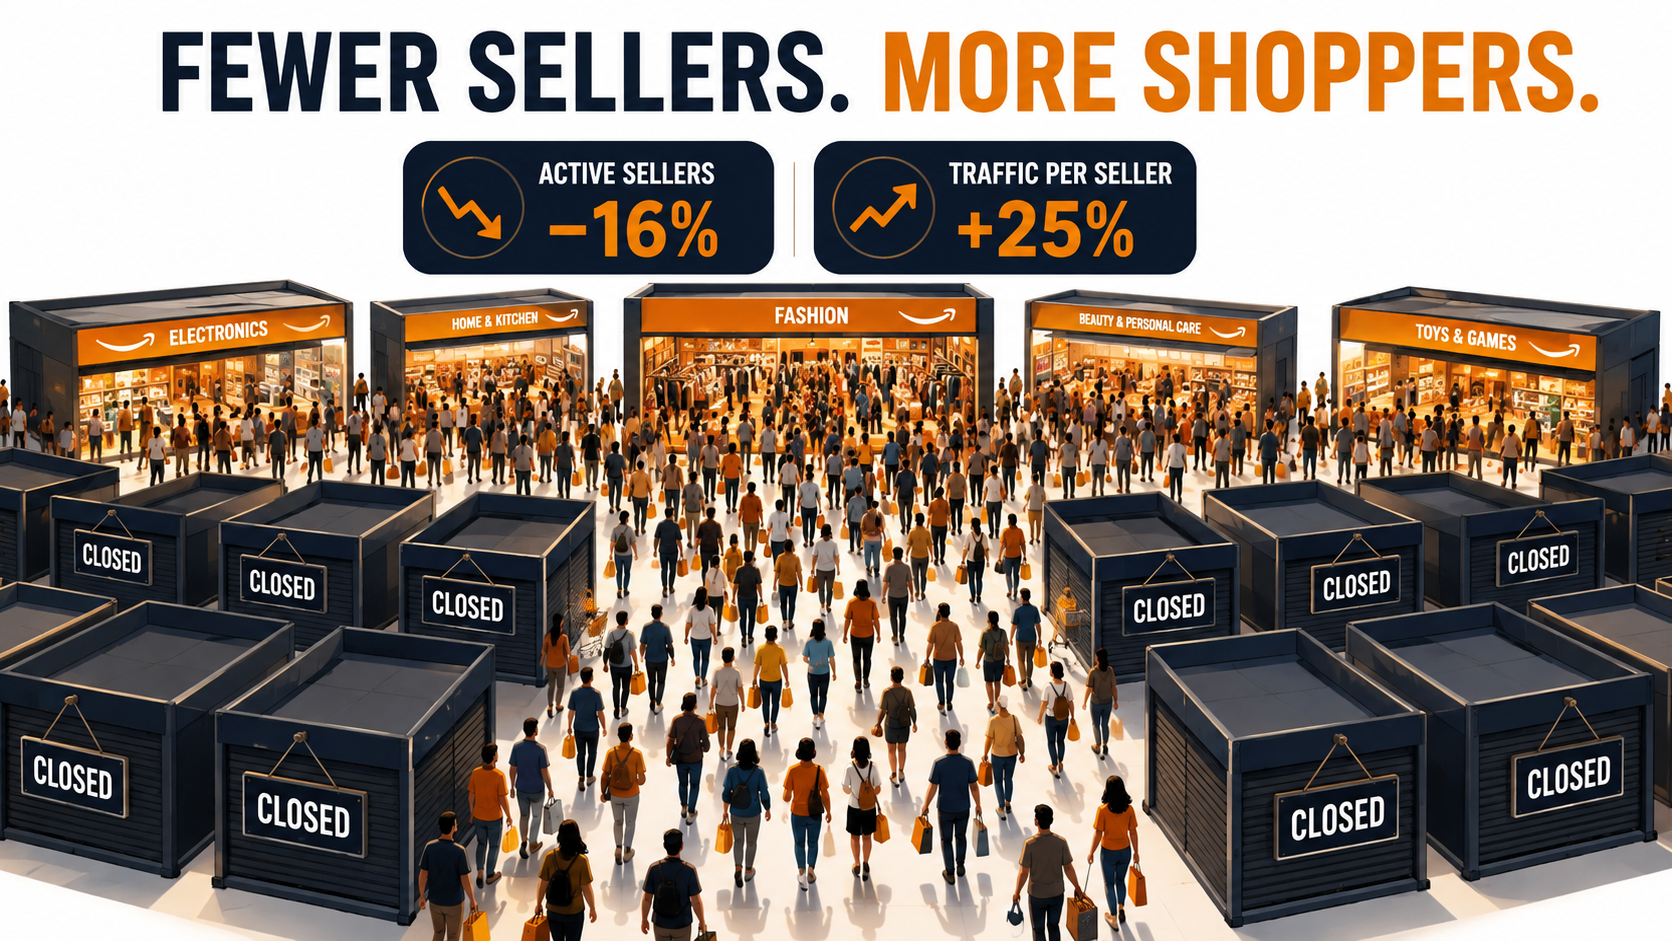
Here is the headline. Across Amazon’s 23 global marketplaces, the number of active sellers fell 16% in a year, to under 1.56 million. Over the same period, combined web traffic grew nearly 5%, to roughly 5.5 billion monthly visits. The customer pie got bigger while the number of people dividing it got smaller.
That sounds like good news for anyone still standing, and for some sellers it is. But the gains aren’t spread evenly. Fewer than 8,000 sellers now generate half of Amazon’s U.S. third-party GMV. Chinese sellers hold a majority of the top 10,000 seats. An AI shopping assistant is recommending products that search rank doesn’t reward. And Amazon has just turned Seller Central into a control panel for its rivals’ marketplaces.
This article doesn’t repeat the usual strategy checklist. Instead, it follows the customers: where the shoppers who used to buy from 16% of departed sellers went, which kinds of businesses are capturing them, and what the data says about the structural forces deciding winners. Most figures come from Marketplace Pulse’s 2026 research, Amazon’s own disclosures, and Jungle Scout’s seller survey.
The goal is practical. If you sell on Amazon, or plan to, you should know which cohort you’re in, which forces are working for or against you, and which few decisions actually change your path. Let’s start with the number that frames everything else.
The Number That Reframes Amazon Selling: 3,544 Visits Per Seller
Marketplace Pulse tracks a metric it calls traffic per active seller. It divides marketplace web traffic by the number of sellers who received at least one feedback rating in the past year. In May 2026, that figure for Amazon reached 3,544 monthly visits per seller, up 25% in a single year.
To put that in context, the same metric rose 31% across the previous four years combined. So nearly as much change happened in twelve months as happened in the four years before them. That isn’t a gradual trend. It’s a step change.
Why the denominator is shrinking
Traffic growing 5% wouldn’t move the needle much on its own. The big driver is the drop in active sellers. Marketplace Pulse points to several pressures hitting at once:
- Cost of goods: Tariffs and inflation complicated product costs over the past year, especially after the end of the de minimis exemption.
- Price competition: Chinese sellers, now more than half of Amazon’s active sellers globally, keep pushing prices down.
- Operational sophistication: AI has raised the bar on listing quality and operations, and established sellers are using it to widen their lead.
- Fees and ad spend: Marketplace fees rank as the top margin concern among Amazon sellers, closely followed by advertising costs.
Jungle Scout’s State of the Amazon Seller survey, covering nearly 1,500 sellers and brands, points the same way. Among enterprise brands, 38% cited higher shipping costs as a top challenge, 34% pointed to rising cost of goods, and 32% named growing advertising expenses.
It’s happening everywhere, not just in the U.S.
When Marketplace Pulse first set up this metric in 2021, the U.S. stood out as the marketplace where sellers got the most traffic relative to their numbers. That pattern now covers almost every Amazon marketplace.
In fact, the U.S. posted the smallest gain among Amazon’s top ten marketplaces, at 19%. Brazil, Mexico, France, Poland, and the Netherlands each saw traffic per seller grow between 40% and 57%. Amazon.com.br added 36 million monthly visits while its active sellers declined 23%.
A few outliers are worth knowing about:
- Saudi Arabia leads on traffic per seller at 9,980 visits, a result of demand inherited from Amazon’s 2020 Souq transition. Its low total traffic, though, limits which categories can support a real business.
- Australia is the only Amazon marketplace where the number of active sellers grew over the past year.
- The U.S. is still the strongest absolute opportunity, with revenue per seller more than $200,000 above the next-largest market.
What this means in practice
Traffic per seller is an average, and averages hide a lot. A rising number doesn’t mean every remaining seller gets 25% more shoppers. It means the attention that’s available has never been greater, but the bar to capture it has risen too.
Marketplace Pulse put it plainly: for sellers who can operate at the standard the platform now demands, the share of customer attention available to each seller has never been greater. The key phrase is “capable of executing.” The rest of this article is about what that standard looks like.
Concentration at the Top: Fewer Than 8,000 Sellers, Half the GMV
If departing sellers left customers behind, someone picked them up. The data shows clearly who that was: the largest operators.
Less than three years ago, it took about 15,000 sellers to account for half of Amazon’s U.S. third-party GMV. Today it takes fewer than 8,000. The group of businesses controlling half the marketplace’s third-party sales has roughly halved.
The four seller cohorts
Platform-level numbers show growth in aggregate. To see what’s going on beneath them, Marketplace Pulse surveyed 181 marketplace sellers representing more than $2 billion in combined annual revenue for its 2026 Seller Index. The results split sellers into four cohorts:
- Thriving (23%): Revenue growing and margins improving at the same time.
- Grinding (31%): Revenue up, but margins flat or falling. Marketplace Pulse calls this a potentially unsustainable treadmill.
- Distressed (38%): At best no growth in sight; at worst, revenue and margins both moving the wrong way.
- Consolidating: The remaining share of respondents (about 8% by arithmetic) falls into this fourth group.
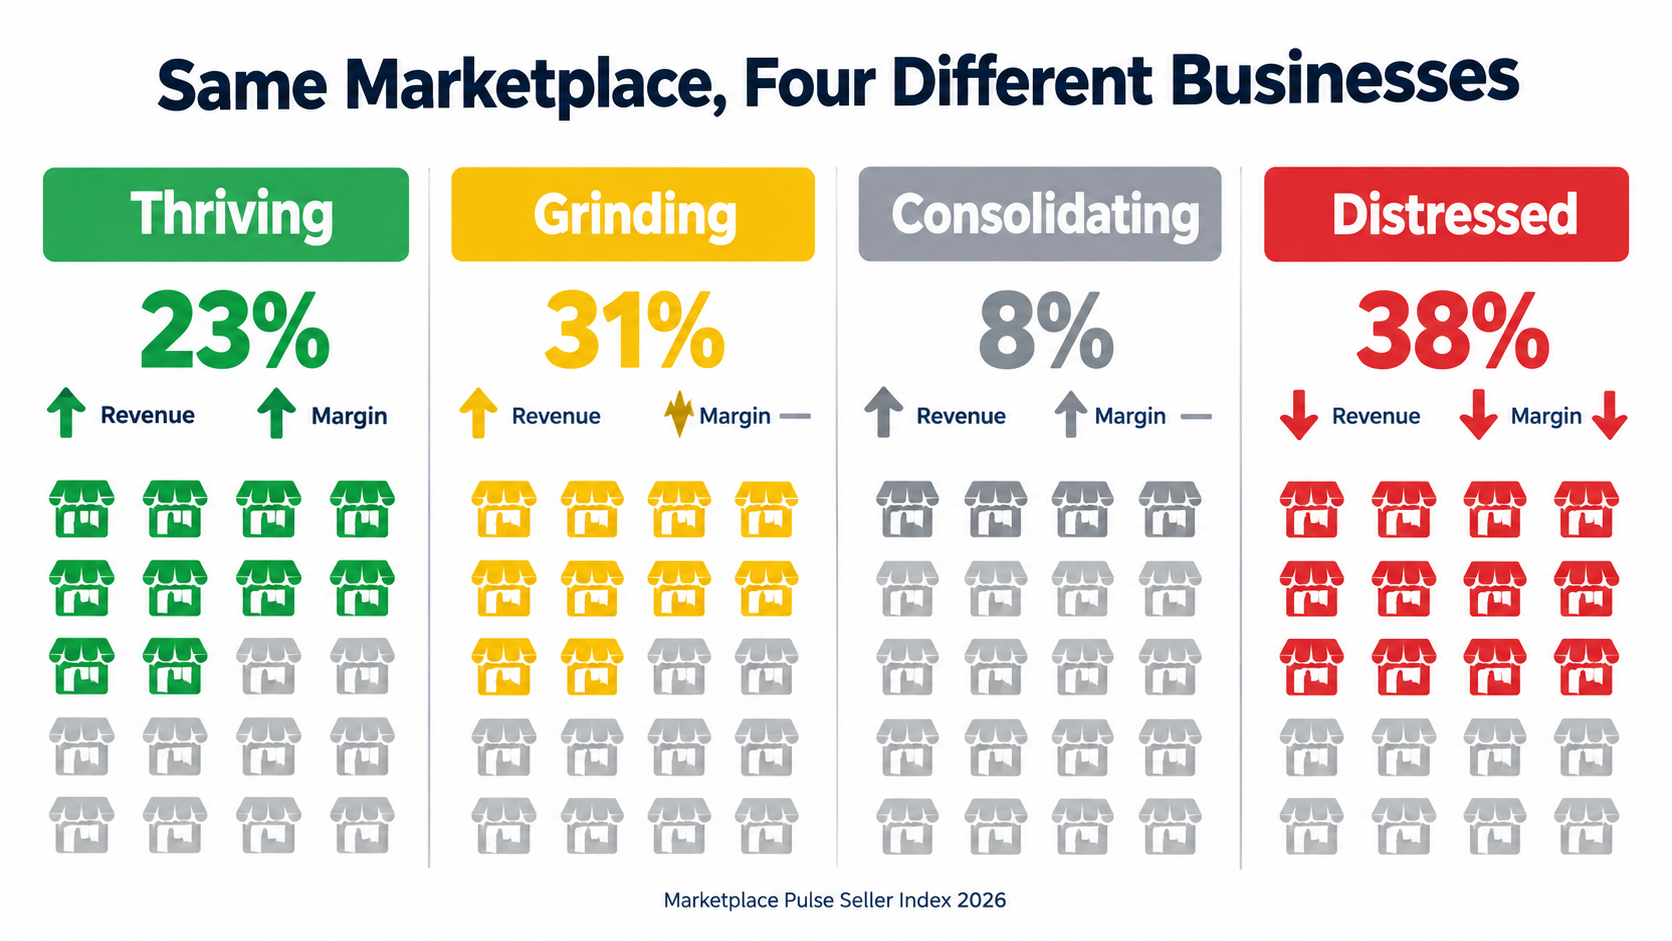
The striking detail is that all four cohorts work on the same platforms under the same conditions. Fees, algorithms, and traffic are identical for each. Yet fewer than one in four sellers manage to grow and get more profitable at the same time.
The grinding trap
The grinding cohort deserves special attention because it’s the easiest to mistake for success. Revenue is going up. Sales dashboards look healthy. But margins are flat or shrinking, which usually means growth is being bought, through ads, discounts, or both.
A grinding seller can stay in this state for a long time, but it’s fragile. One fee change, one tariff shift, or one aggressive competitor can push it into the distressed column. If your top-line chart and your contribution-margin chart are heading in different directions, you’re grinding, whatever the revenue report says.
Why concentration compounds
Large sellers have structural advantages that grow with scale. They can spread fixed costs, such as software, design, and compliance, over more units. They negotiate better freight and manufacturing terms. They can afford to run ads at a loss during launches because the rest of the catalog pays for it.
And as the active seller pool shrinks, each top seller’s share of traffic grows, which funds more ad spend and more reviews, which earns more rank. That cycle is why the 8,000 figure has fallen so quickly. Concentration isn’t a one-time event. It feeds itself.
Actionable takeaway: Before any growth plan, work out which cohort you’re in using the last four quarters of data. Compare revenue growth against contribution margin after ads, fees, and returns. The right strategy for a thriving seller (push harder) is the opposite of the right strategy for a grinding seller (cut unprofitable growth first).
Who Holds the Top 10,000 Seats Now: Headcount vs. Revenue
Concentration tells you how much the top captures. It doesn’t tell you who sits there. Marketplace Pulse’s July 2026 analysis of Amazon.com’s top 10,000 sellers answers that, and the answer depends on whether you count sellers or dollars.
The headcount crossover
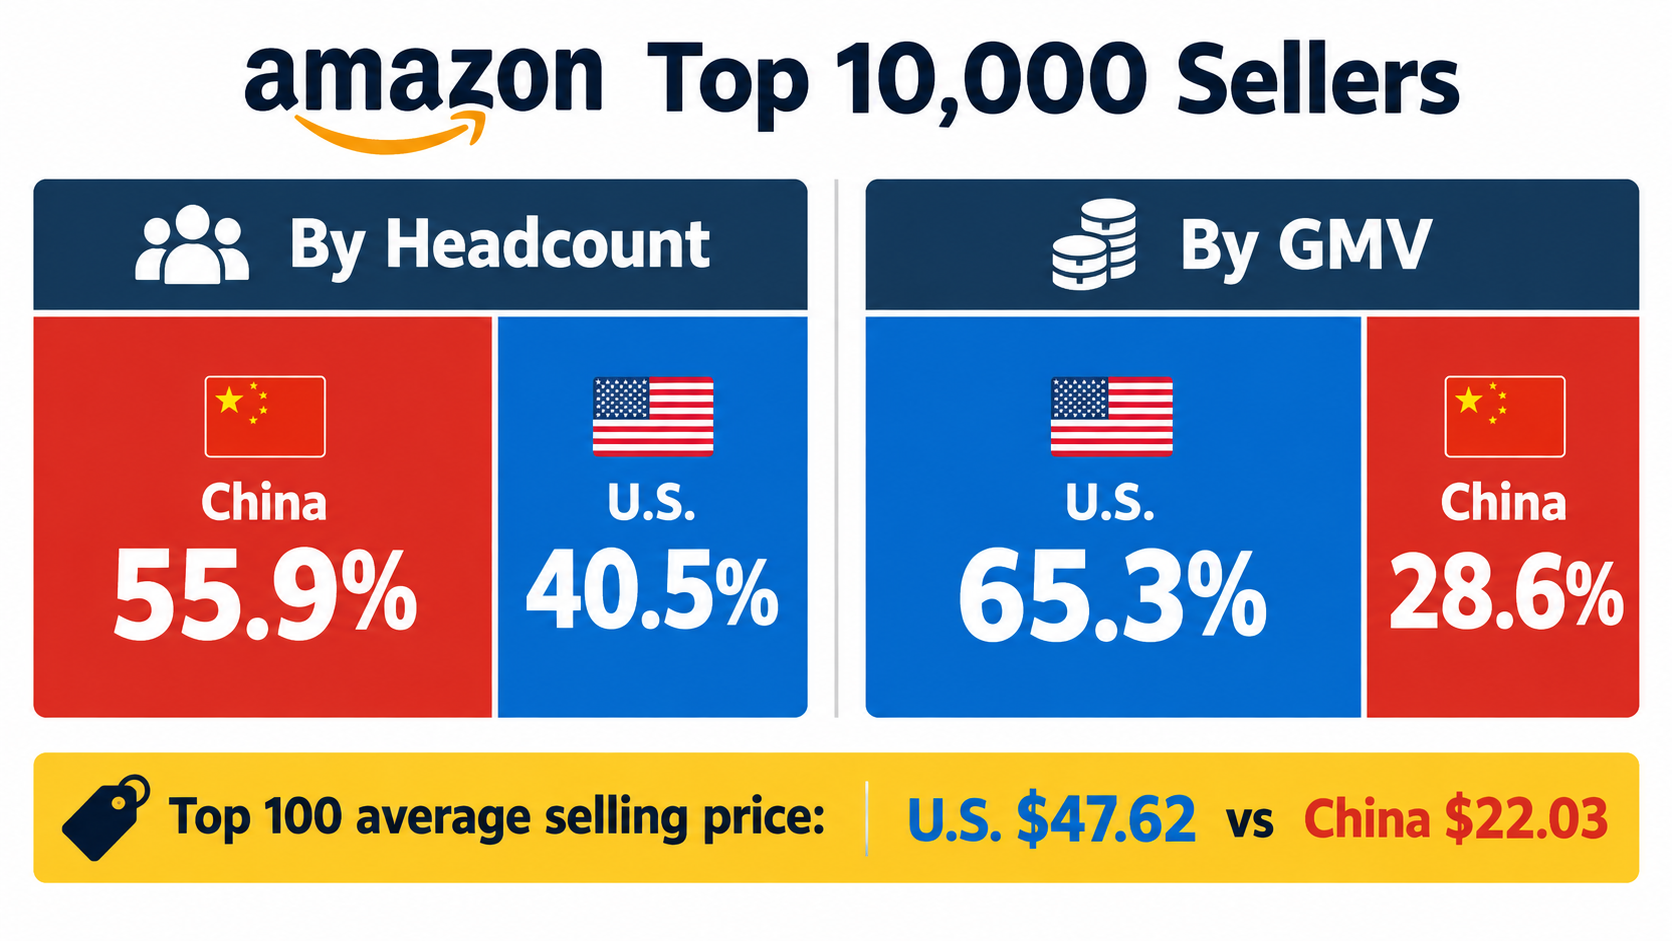
Since July 2020, Chinese sellers have gained 1,342 positions in the top 10,000, while U.S. sellers have lost 1,320. Chinese sellers made up 42.5% of the cohort then and 55.9% now. American sellers fell from 53.7% to 40.5%.
The pace isn’t slowing. In the past twelve months alone, 3.8 percentage points of share moved. The crossover at the top of Amazon.com arrived roughly two years before Chinese sellers became a majority of the global active seller base.
The revenue picture is reversed
Headcount overstates the shift, though. U.S. sellers produce 65.3% of the GMV this top-10,000 cohort generates, against 28.6% for Chinese sellers. That’s an almost exact inversion of their headcount positions.
The gap is widest at the summit:
- American sellers make up 81.4% of the top 100 and produce 93.2% of its GMV.
- In the 5,001–10,000 band, American sellers are only 34% of sellers.
- Average selling prices for U.S. sellers exceed Chinese sellers’ at every rank, most sharply in the top 100: $47.62 vs. $22.03.
What the price gap tells you
The average selling price gap is the most useful number here for strategy. Factory-direct sellers compete on price and volume in lower-priced categories. They arrive, as Marketplace Pulse notes, with manufacturing proximity, direct factory relationships, export subsidies, and AI tools that have closed the listing-quality gap that once protected domestic sellers.
Competing head-on with that model on a $20 commodity product is a tough fight for most Western sellers. The top-100 data suggests where the defensible ground is: higher price points, brand equity, and categories where trust, design, or regulation make the cheapest option less appealing.
Practical implications
- Check your price band. If your products sit under about $25 in a category full of factory-direct listings, expect constant price pressure and rising ad costs.
- Move up where you can. Bundles, premium materials, certifications, and better packaging can shift a product into a band where the cost advantage matters less.
- Don’t assume headcount means threat. A category with many Chinese sellers isn’t automatically lost. Look at who holds the revenue, not just who holds the listings.
Durability: Why Top Positions Are Stickier Than Ever, and Who’s Getting Squeezed
One common belief about Amazon is that rankings churn constantly and nobody stays on top for long. The data says the opposite, and the real story is more subtle.
Retention has gone up, not down
According to Marketplace Pulse, 68.6% of today’s top 10,000 sellers held that position a year ago, compared with 67% in 2019. Nearly half, 49.6%, were already in the top 10,000 three years ago, up from 41% in 2019.
So holding a top position has become more durable. Seats turn over at about the same rate as always. What’s changed is who’s waiting to take them.
The vintage breakdown
Looking at when today’s top sellers registered on Amazon shows a clear pattern:
- Pre-2016 sellers: 21.9% of top positions
- 2016–2018 sellers: 27.4%
- 2019–2021 sellers: 17.5%, the thinnest group
- 2022–2024 sellers: 26.9%
- Last eighteen months: 6.3%
Half of today’s top sellers registered before 2019, down from over 60% a year earlier. Veteran cohorts are thinning, but slowly.
The pandemic cohort problem
The 2019–2021 group is the weakest. Marketplace Pulse describes it as a pandemic vintage that entered at the marketplace’s peak and has been squeezed from both directions since.
It’s easy to see why. These sellers often launched when demand was surging and ad costs were lower. Many sourced inventory at elevated freight prices and built businesses around pandemic-era demand. They didn’t have the review history and organic rank of older sellers, and they didn’t have the cost structure or AI-native operations of newer factory-direct entrants.
Veterans built rank through organic position and review history. As that organic space has given way to sponsored placements, entrants with thinner product margins but lower costs can outspend them for visibility.
Does time on the platform still matter?
Yes, but less than it used to. In 2019, Marketplace Pulse concluded that it takes years to build a lasting Amazon business, but once built, it can be held for years. In 2026, the first half still holds. Time still compounds into advantage, just less of it and for fewer sellers.
Longevity has gone from being the defining trait of top sellers to one attribute among several. Review count and historical rank are still valuable, but they no longer protect you on their own.
Actionable takeaway: If you’re a 2019–2021 seller, take an honest look at what your moat actually is. If it’s mostly “we got here first,” that advantage is shrinking. Building brand search volume, owning a differentiated product, or moving into a higher price band are the more defensible routes.
The Visibility Tax: Ads, Fees, and the $68.62 Billion Question
Every structural trend in this article points back to one cost line: paying for visibility. Understanding its size helps explain why so many sellers are grinding rather than thriving.
The scale of Amazon advertising
Marketplace Pulse reports that sellers paid $68.62 billion for Amazon search ads in 2025, as sponsored placements kept crowding around organic results. By Q1 2026, Amazon’s advertising revenue was running above $70 billion on a trailing twelve-month basis and growing 22% at constant currency.
Amazon’s advertising has grown faster than its total revenue for several years running. And that record ad revenue is being generated against a smaller active seller base than a year ago. Fewer sellers are paying more, on average, to be seen.
Why ad spend and concentration go together
Visibility on Amazon search has historically come through two routes. Organic rank is earned slowly through sales velocity. Ads are bought outright at auction. Over time, the line between them has blurred, since ad spend is often what produces the sales velocity that earns organic rank.
That favors sellers with the deepest pockets. A large seller can treat ad spend as an investment across a whole catalog. A small seller with five SKUs feels every dollar of a rising cost-per-click directly in its margin.
Fees are the top margin concern
Marketplace Pulse’s research finds that marketplace fees rank as the top margin concern among Amazon sellers, followed closely by advertising spend. Its April 2026 analysis describes a paradox: sellers are frustrated with platform fees yet keep deepening their dependence on Amazon, because no alternative offers comparable scale.
The same analysis notes a less obvious flip side. As Amazon extracts more revenue from a more concentrated seller base, it becomes more exposed to that base. In theory, a small group of large sellers could coordinate or exit. In practice, there’s nowhere else to go at the same volume.
How to manage the visibility tax
- Track TACoS, not just ACoS. Total advertising cost of sale (ad spend divided by total revenue) shows whether ads are building organic sales or simply replacing them.
- Separate defensive from offensive spend. Ads on your own brand terms protect existing demand. Ads on generic terms try to capture new demand. They have very different economics and should be measured separately.
- Model the full fee stack per SKU. Referral fees, fulfillment fees, storage, inbound costs, returns, and ads together decide whether a product makes money. Many grinding sellers have a handful of SKUs quietly losing money on every sale.
- Cut losers before scaling winners. In a concentrated marketplace, fixing negative-margin SKUs often improves profit faster than chasing new revenue.
The Third Shelf: How Alexa for Shopping Picks Products Differently
For years, Amazon visibility came from two shelves: organic search and paid placements. In 2026, a third shelf is taking shape, and early evidence suggests it plays by different rules.
From Rufus to Alexa for Shopping
In May 2026, Amazon renamed its Rufus assistant as Alexa for Shopping, folding the recommendation engine into a broader assistant. Usage has grown fast. In its Q1 2026 earnings call, Amazon reported that Rufus monthly active users were up 115% year over year and engagement up nearly 400%. The assistant was credited with an estimated $12 billion in incremental sales.
Amazon also launched Sponsored Products and Brand Prompts inside the assistant that quarter. CEO Andy Jassy said nearly 20% of shoppers who interact with a sponsored brand prompt keep the conversation going about that brand, while stressing that “it is early.” That figure measures continued conversation, not purchases.
The study: AI doesn’t follow search rank
In one of the first large-scale studies of what Alexa for Shopping recommends, Autopilotbrand.com captured 1,963 non-branded queries and 12,810 recommendations during May and June 2026. It compared “best-of” questions such as “what is the best queen mattress?” against the plain category search, “queen mattress.” The results, reported by Marketplace Pulse:
- 63.9% of the assistant’s picks fell outside the organic top 10 for the matching search term.
- 40.9% never appeared on the visible search results page at all.
- Only 14.3% of picks were products running a sponsored listing on that search page, and 83% of those already ranked organically anyway.
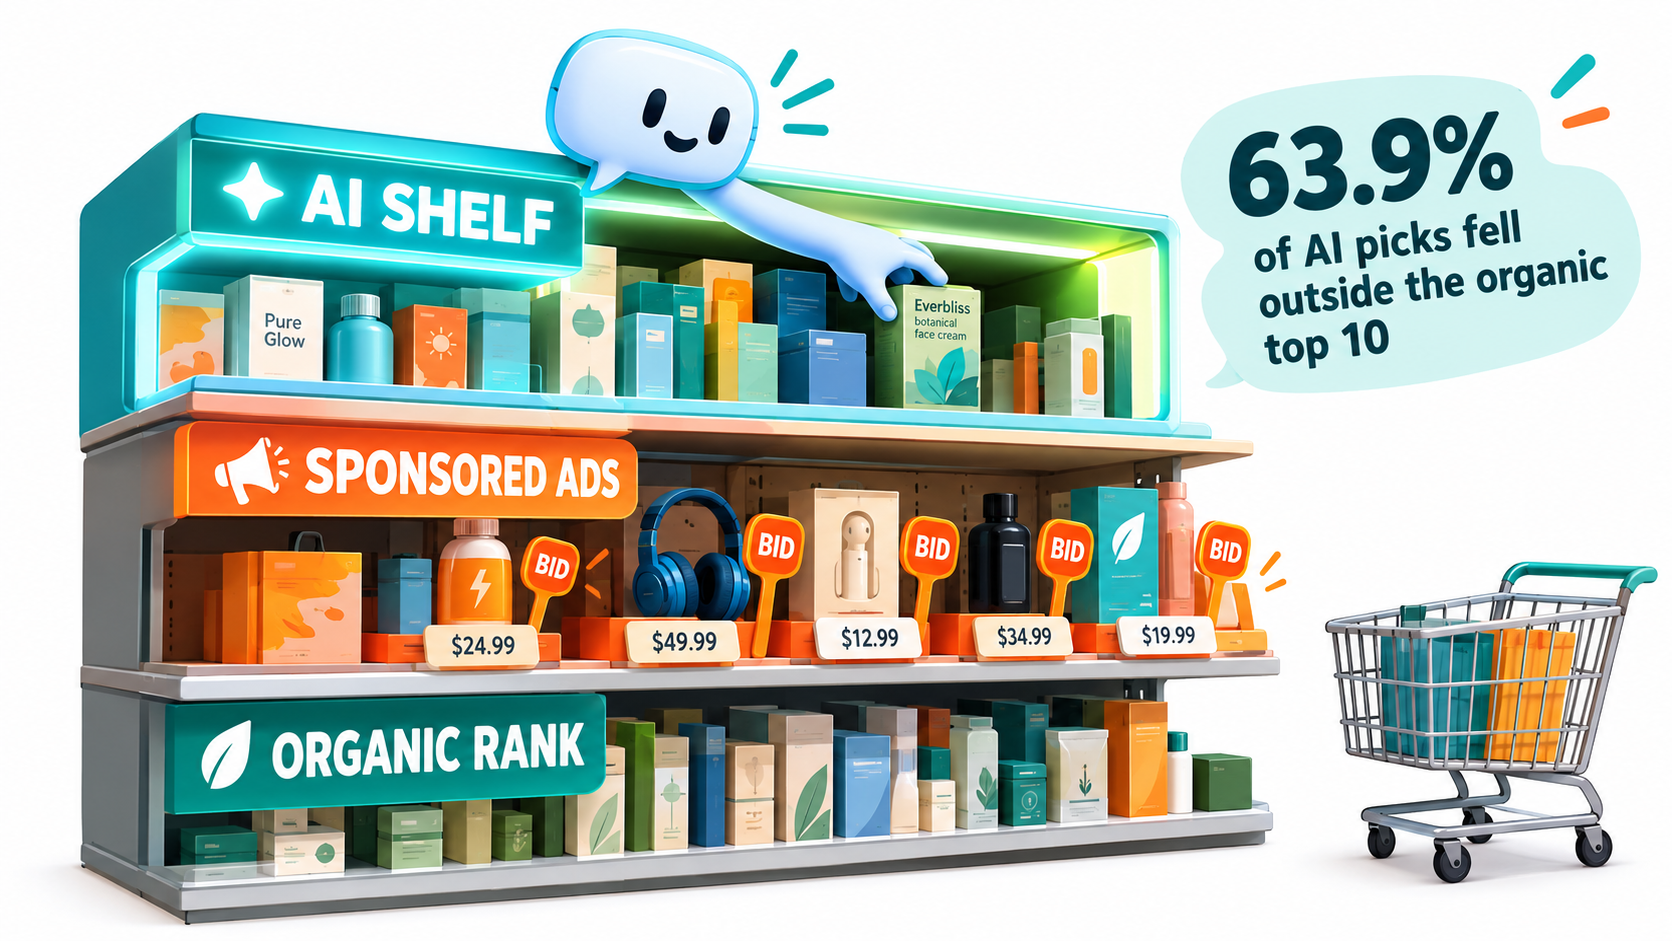
In other words, when asked to recommend rather than list, the assistant brings up a meaningfully different, and often deeper, set of products than the search page most sellers optimize their listings for. Neither rank nor ads appear to shape AI discovery much yet.
“We’re seeing the emergence of a third shelf alongside organic search and paid placements. Brands cannot simply buy or rank their way onto it; they need to give Amazon’s AI Alexa enough context to understand when and why their product is the right recommendation.” — Christian Umbach, Co-Founder & CEO, Autopilotbrand.com
The caveats matter
This is a single snapshot from one U.S. account, captured early, by a vendor that sells services in this area. Treat it as a directional signal, not settled fact. Marketplace Pulse also points out that search once looked open like this too, before ads filled it in. Sponsored placements inside the assistant already exist, so the AI shelf’s economics are far from fixed.
What sellers can do now
- Write for questions, not just keywords. Assistants answer “best for” and “which one should I get” questions. Your listing should clearly state who the product is for, what problem it solves, and how it compares.
- Fill every attribute. Structured catalog data gives the assistant context. Missing attributes are missing reasons to recommend you.
- Cover use cases and seasons. Update bullet points and A+ content as use cases change, such as gift seasons, weather, or new applications.
- Test the assistant yourself. Ask Alexa for Shopping the best-of questions in your category and record what comes up. Repeat monthly to see whether you appear and why competitors do.
For sellers who don’t own the top of search, this may be the rare surface where rank incumbency is a weaker moat. That window may not stay open.
Amazon Is Taking Back Unit Share From Its Own Sellers
One more structural shift gets less attention than it deserves. For the first time, Amazon’s first-party retail business is gaining share from third-party sellers.
The numbers
Third-party sellers accounted for 60% of paid units sold on Amazon in Q1 2026. That’s down from 61% in Q4 2025 and 62% the quarter before. According to Marketplace Pulse, it’s the first time the metric has fallen for two consecutive quarters since Amazon started reporting it in 2004.
Two percentage points might sound small. On a marketplace Marketplace Pulse estimates at roughly $830 billion in GMV, though, every point of share is a very large number of units.
Why it matters for third-party sellers
For two decades, the story of Amazon was the steady rise of third-party sellers. A reversal, even a modest one, means Amazon’s own retail operation is competing harder for the same shoppers, the same Buy Box, and the same search placements.
Several things are happening in parallel. Amazon Haul, the direct-from-China section for items under $20, had more than 3,000 sellers by March 2026, offering a channel built to compete with Temu and Shein. Amazon Business reached $60 billion in annualized gross sales, roughly 7% of Amazon’s GMV by Marketplace Pulse estimates, up from $35 billion in 2023 and $25 billion in 2021.
Together, these show Amazon using many routes to capture demand. Third-party sellers are a big part of the system, but not the only part, and Amazon is clearly willing to compete with them directly where it makes sense.
How to respond
- Watch for 1P overlap. Check whether Amazon sells a similar product directly in your category, and how it prices. Commodity products in high-volume categories are most exposed.
- Build what Amazon retail can’t easily copy. A recognizable brand, unique designs, patents, or community-driven demand are harder for a first-party retail operation to replicate.
- Look at Amazon Business. If your products have B2B uses (office, industrial, hospitality, education), the $60 billion Amazon Business channel is a growing segment many consumer-focused sellers ignore.
The Multichannel Paradox: Amazon Becomes the Hub for Its Rivals
Diversification has been standard advice for Amazon sellers for years. In September 2026, Amazon made it easier than ever, in a way that may deepen sellers’ dependence on Amazon instead of reducing it.
What Amazon announced at Accelerate 2026
At its annual Accelerate seller conference, Amazon announced that sellers will be able to manage their eBay, Shopify, TikTok Shop, and Walmart businesses from inside Seller Central. The multichannel tools are rolling out gradually to U.S. sellers at no extra cost. According to Marketplace Pulse, they pull listings, orders, and profitability from every connected channel into one workspace:
- A seller edits a product description once, and Amazon reformats and publishes it to linked listings on eBay, Walmart, and Shopify.
- Shopify and Walmart orders appear alongside Amazon orders and can be fulfilled through Amazon in a few clicks.
- A profitability view shows what each product earns on each channel.
Five years from roadblock to hub
This is a big change in posture. Five years ago, Amazon was a roadblock to multichannel commerce. FBA charged more to ship off-Amazon orders, and unbranded packaging was still in beta. Products priced lower elsewhere could be suppressed, as they still can be today.
Then came Buy with Prime, connecting Amazon’s checkout and fulfillment to independent websites. At Accelerate 2024, Amazon said Multi-Channel Fulfillment served more than 200,000 U.S. sellers, with order volume up 70%. In 2025, it announced MCF integrations with Walmart and Shein. The 2026 tools are the next step: Amazon moves from the warehouse behind other channels to the software in front of them.
Multichannel isn’t the same as diversified
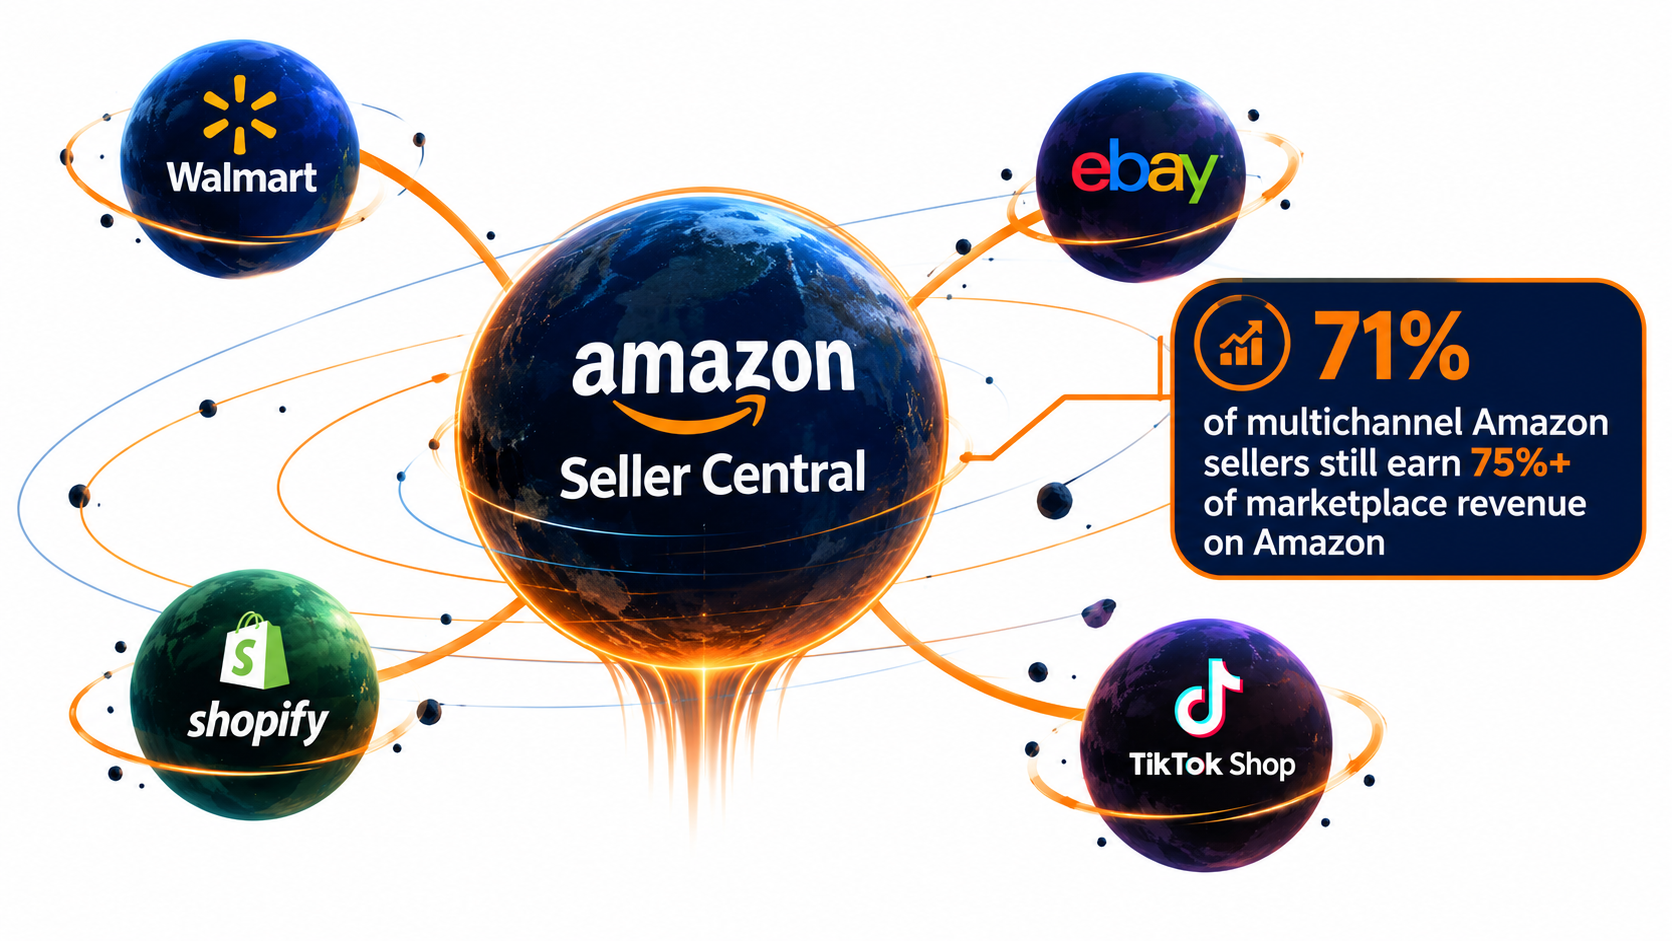
Amazon says more than 95% of its sellers sell on multiple channels. But Marketplace Pulse’s 2026 Seller Index shows that 71% of Amazon-primary sellers active on at least one other marketplace still earn three-quarters or more of their marketplace revenue from Amazon.
Having a Walmart account isn’t the same as having a Walmart business. And if your Walmart, eBay, and Shopify operations all run through Amazon software and Amazon fulfillment, your dependence on Amazon may actually be growing, even as your channel count rises.
There’s also a data point worth noting. Amazon has long tracked what its sellers charge elsewhere. With these tools, it can see how much they sell there too, though Amazon says that data won’t inform its retail business.
The other channels are growing
The alternatives are real and growing. Walmart’s U.S. third-party marketplace grew nearly 50% in Q1 of its fiscal 2027, its fastest pace in years. Walmart’s U.S. online sales rose 24% in the most recent quarter, with its advertising business up 38%.
Still, scale matters. Marketplace Pulse estimates Amazon’s U.S. third-party sales at around $300 billion, more than seven times eBay’s and roughly 20 times that of Temu, TikTok Shop, and Walmart, which compete in a $15–22 billion range.
A sensible approach
- Use the tools for efficiency, not as a diversification plan. Unified inventory and order management saves time. It doesn’t reduce platform risk.
- Measure true concentration. Track what share of total revenue, profit, and customer data depends on Amazon systems, including fulfillment and software.
- Own at least one direct customer relationship. A Shopify store with an email list gives you an asset that doesn’t disappear if an Amazon account is suspended.
TikTok Creates Demand, Amazon Settles It
Many Amazon sellers have looked at TikTok Shop as either a threat or a second channel. The data suggests a more useful way to think about it: as a demand engine whose payoff often lands on Amazon.
The one-way street
Marketplace Pulse matched its lists of the 10,000 largest sellers on Amazon and on TikTok Shop by business name. Only 498 appear on both, about 5% of either list. Among those 498, rank on one platform has almost no relationship to rank on the other.
The asymmetry is the key point. One in five of TikTok Shop’s 100 largest U.S. sellers also ranks in Amazon’s top 10,000. Only one in 25 of Amazon’s 100 largest ranks in TikTok Shop’s top 10,000. A brand that succeeds on TikTok is five times more likely to also succeed on Amazon than the other way around.

Why the flow runs one way
Two decades of Prime have made Amazon the reflexive place to complete a purchase. The card is on file, delivery is promised, returns are easy, and reviews are trusted. When shoppers see a product demonstrated on TikTok, many open Amazon, type the brand name, and buy there.
This pattern predates TikTok Shop. In 2021, a pair of leggings became Amazon’s best-selling clothing item because TikTok videos, which couldn’t even link to product pages, sent millions of users to search for it on Amazon.
The reverse almost never happens. Amazon has tried for years to become a discovery destination. Amazon Live struggled to hold a thousand viewers on a normal day. Inspire, its TikTok-style feed, launched in 2022 and was shut down in 2025.
Which products fit
Marketplace Pulse found that among the top 1,000 U.S. TikTok Shop products by lifetime sales, more than two-thirds of revenue comes from products applied to the body, taken into it, or worn on it. These are products whose results a creator can show on camera in seconds.
Most of what sells well on Amazon fails that test. Replacement charging cables, storage bins, and printer paper are searched for, not filmed. And TikTok Shop is itself heavily concentrated: 1% of sellers drive 60% of its U.S. GMV.
How Amazon sellers should use TikTok
- Ask whether the product can be filmed. If its result can be shown in 15 seconds, creator content is worth funding. If not, TikTok probably isn’t a channel for you.
- Measure TikTok by Amazon branded search. Marketplace Pulse suggests an existing Amazon seller should judge TikTok’s value by growth in Amazon branded searches, not just TikTok Shop orders. Brand Analytics search query data is the place to watch.
- Prepare the Amazon listing first. If a TikTok push works, the traffic lands on your Amazon listing. Make sure inventory, reviews, and brand-name search results are ready.
The Demand Backdrop: E-Commerce Is Growing Again, but Mostly for the Biggest
All of these shifts are happening against a demand environment that improved through 2026. That helps, but it doesn’t change who captures the growth.
The recovery in numbers
U.S. e-commerce grew 12.2% in Q2 2026, its fastest pace in five years, and reached a record 17.1% of all retail spending. It was the second straight quarter of double-digit growth after four years without one. Q1 2026 had shown 9.8% growth, nearly double each of the prior four quarters.
In 2025, by contrast, e-commerce grew around 5% a quarter. Tariffs and the end of the de minimis exemption hit the categories where online had been gaining fastest. Looking back, 2025 seems more like a pause than a settling into permanent maturity.
Price inflation flatters the figures
Marketplace Pulse cautions that prices explain part of the recovery. Total retail grew 6.7%, the fastest since 2022, and goods prices that were flat or falling through 2024 are now rising. Roughly a third of the recent acceleration comes from bigger price tags, leaving real growth near 8%, about where it ran in 2024.
The biggest platforms are capturing most of it
The largest platforms are all growing faster than the market. Amazon’s online store sales grew 15%. Shopify’s North American merchants sold 28% more. Walmart’s U.S. online sales rose 24%.
Growth above the market rate has to come from somewhere, and it comes from the rest of the market. Just as seller revenue concentrates toward the top sellers, platform revenue concentrates toward the top platforms.
The demand-side takeaway
Demand has genuinely returned, which is good news for anyone selling online. But a rising tide in 2026 is lifting the biggest boats most. For an individual Amazon seller, market growth is a tailwind, not a strategy. The cohort you’re in, your price band, and your visibility costs will decide your results far more than the overall market rate.
What Thriving Sellers Do Differently: A 2026 Operating Plan
The data in this article describes forces no single seller controls. But it also points to a set of choices that separate the 23% who are thriving from the rest. Here’s how to turn the findings into an operating plan.
1. Diagnose before you grow
Calculate revenue growth and contribution margin, after all fees, ads, and returns, for the past four quarters. Place yourself honestly in a cohort. Then decide:
- Thriving: Reinvest in the products and channels producing margin growth.
- Grinding: Pause unprofitable growth. Cut or reprice negative-margin SKUs before adding new ones.
- Distressed: Concentrate on your few best products, reduce inventory risk, and consider whether a sale or merger beats a slow decline.
2. Choose your price band on purpose
The top-100 average selling price gap ($47.62 vs. $22.03) shows where Western sellers keep their advantage. Look at every product line and ask whether it competes on cost or on something else. If it competes only on cost against factory-direct sellers, plan either to move it up-market or to accept thin margins as permanent.
3. Treat visibility as three separate budgets
Organic rank, paid placements, and the AI shelf each need their own approach:
- Organic: Protect it with strong conversion rates, steady stock, and review quality.
- Paid: Run it against TACoS targets, and split brand defense from category conquest.
- AI shelf: Invest in complete attributes, use-case content, and comparison-ready copy. Test Alexa for Shopping monthly with real best-of queries.
4. Build demand outside Amazon’s search box
Branded search is the one source of Amazon traffic that doesn’t require bidding against competitors every day. If your product can be shown on camera, creator content on TikTok and elsewhere can feed Amazon branded search. Track it in Brand Analytics and treat it as a primary metric.
5. Diversify for real, not on paper
Use Amazon’s new multichannel tools if they save time. But don’t confuse more channels with less risk. Set a target for revenue outside Amazon systems, and own at least one direct customer list.
6. Use AI beyond listings
Marketplace Pulse’s research found sellers have adopted AI broadly but narrowly, mostly for content tasks like listings and images. Since AI tools have already closed the listing-quality gap, better listings alone aren’t an advantage anymore. The next gains are in forecasting, pricing analysis, fee audits, and customer feedback analysis, where fewer sellers are competing.
7. Look beyond Amazon.com
Traffic per seller grew 40–57% in Brazil, Mexico, France, Poland, and the Netherlands, against 19% in the U.S. For sellers with proven products and the ability to handle compliance and logistics, international Amazon marketplaces may offer less crowded paths to growth.
Conclusion: The Customers Didn’t Leave, the Sellers Did
The central fact of Amazon selling in 2026 is simple: shoppers are still arriving in greater numbers, but there are far fewer sellers serving them. Active sellers fell 16% while traffic grew. Traffic per seller rose 25% in a year. Fewer than 8,000 sellers now account for half of U.S. third-party GMV.
The customers who once bought from departed sellers haven’t vanished. They’ve moved to operators who can handle rising costs, pay for visibility efficiently, and run at a higher standard. Some of those operators are factory-direct sellers winning on volume and price. Others are established brands holding the top of the marketplace with higher price points and stronger brand equity. And some of the demand is shifting back to Amazon’s own retail business.
At the same time, the ways shoppers find products are multiplying. Search rank and ads still matter enormously, but a third shelf, the AI assistant, is choosing products by different logic, at least for now. TikTok is creating demand that often resolves on Amazon. And Amazon is positioning Seller Central as the control room for selling everywhere.
Key takeaways to act on this quarter:
- Know your cohort. Compare revenue growth with contribution margin. Growth without margin is grinding, not winning.
- Audit your price bands. Products competing only on cost against factory-direct sellers need a clear plan.
- Manage three visibility budgets. Organic, paid, and AI each need their own metrics and investment.
- Test the AI shelf now. Run best-of queries in Alexa for Shopping monthly, while rank incumbency is still a weak moat there.
- Build branded demand. Treat Amazon branded search volume as a core health metric.
- Diversify in substance. Measure true dependence on Amazon systems, not just the number of channels.
The marketplace now rewards sophistication more than ever, and it punishes complacency more quickly. For sellers who can meet the standard, there has never been more customer attention per seller. The work is making sure you’re on the right side of that average.