


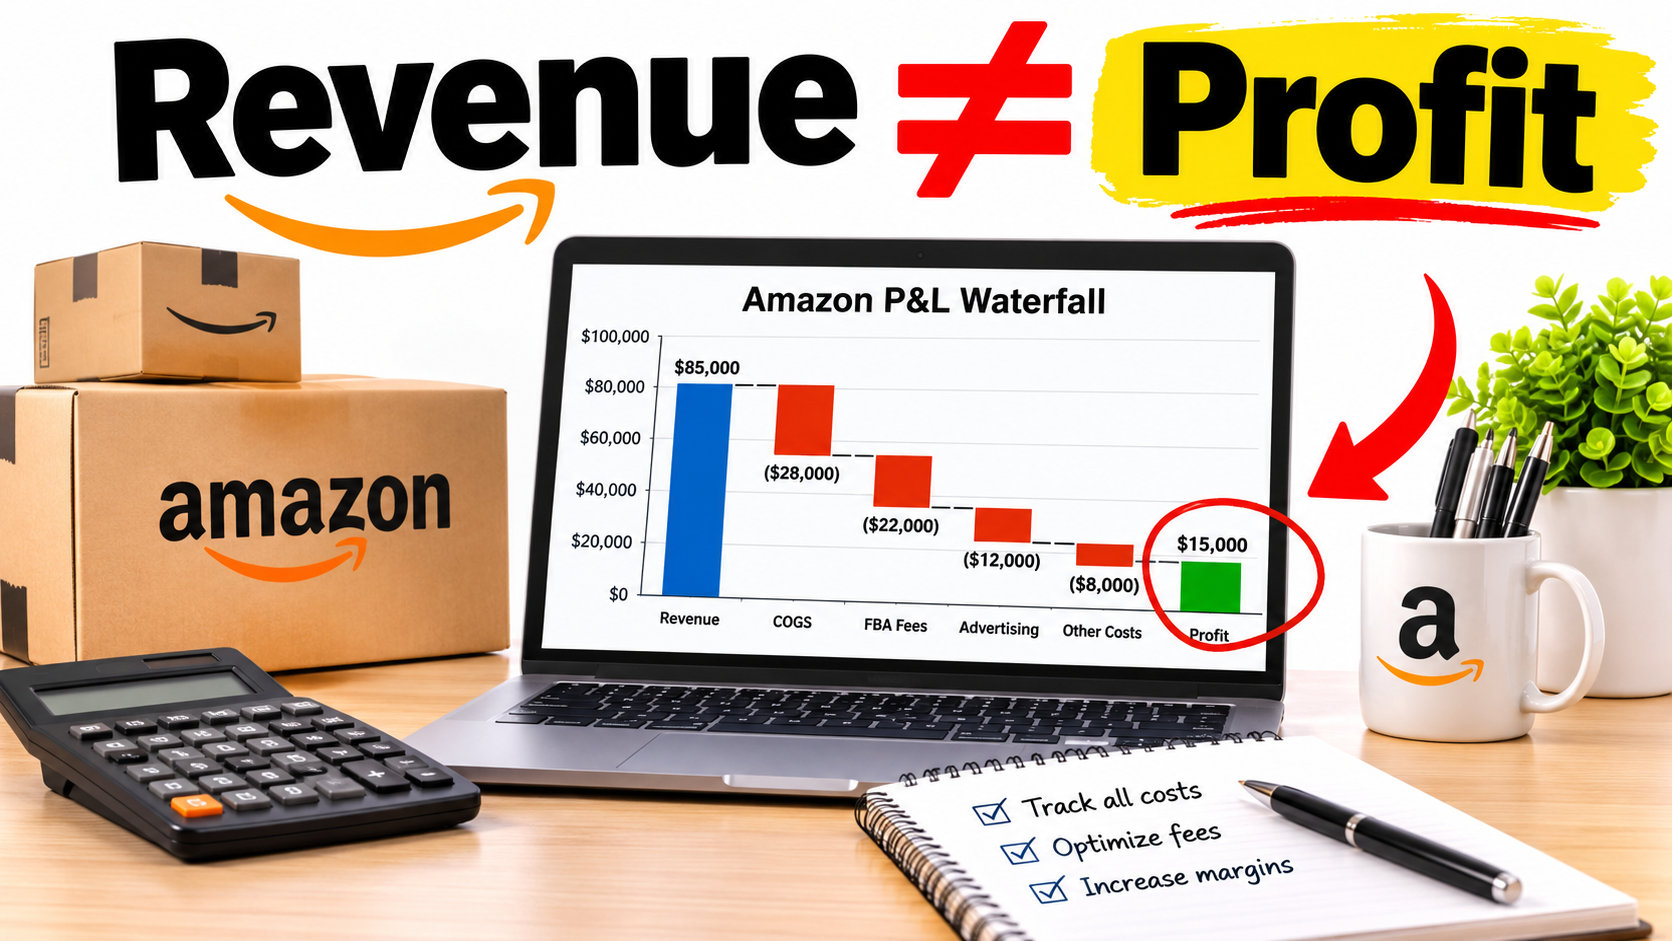

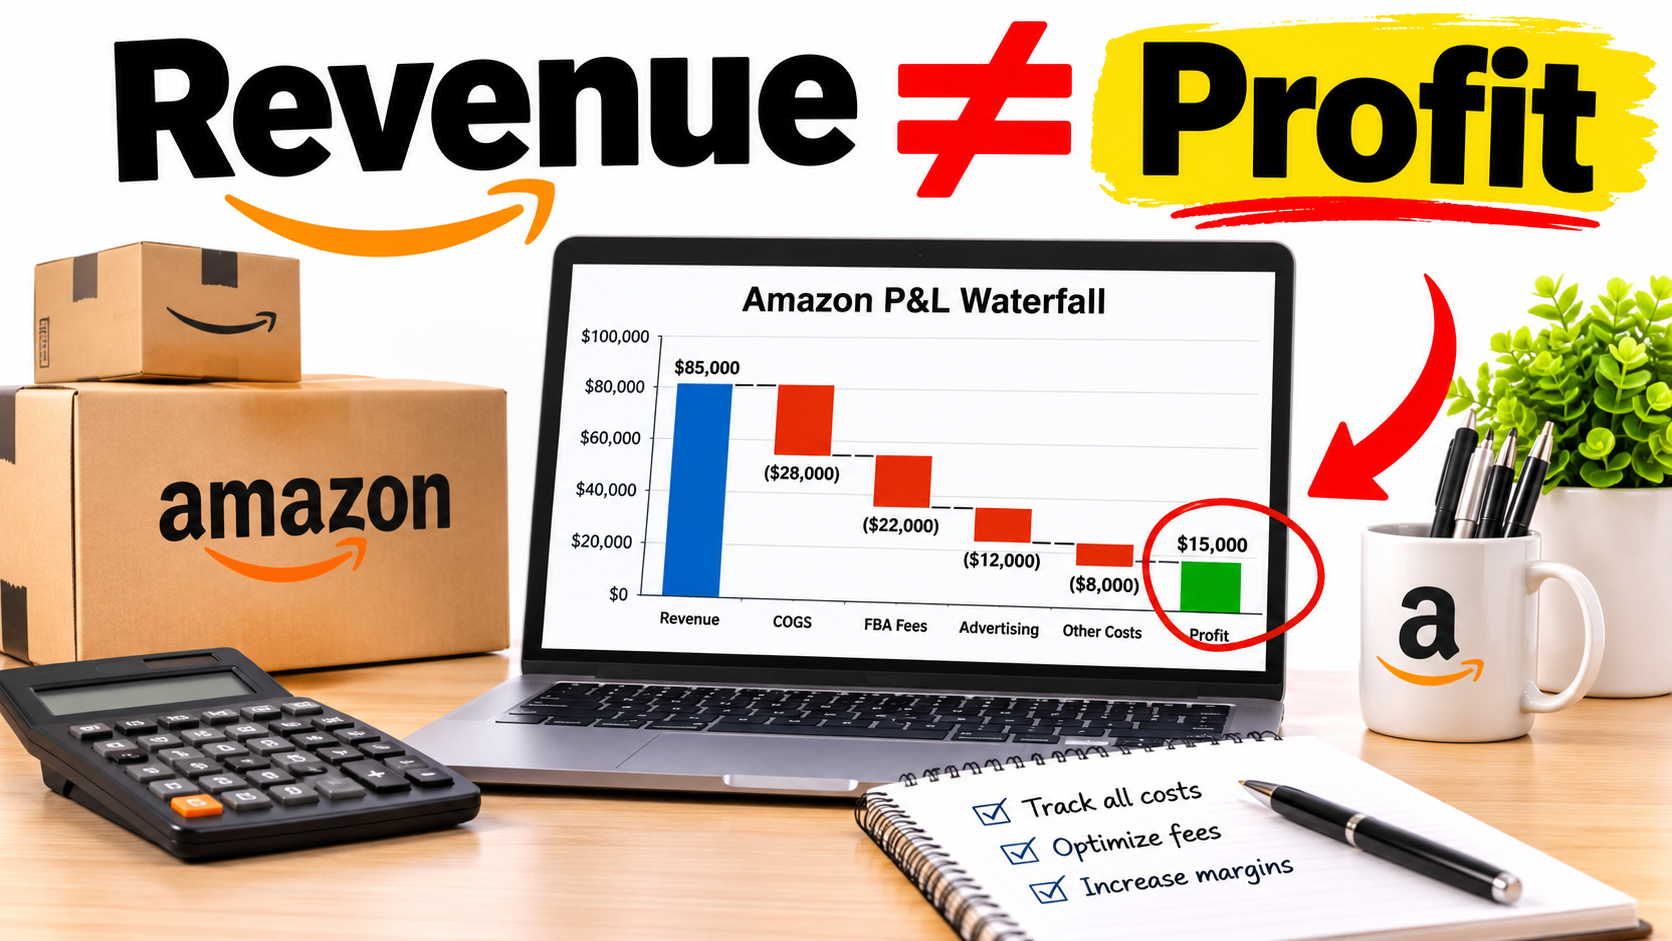
Ask ten Amazon sellers how their business is doing and most will answer with a revenue number. Very few will answer with cash left after every cost, or with how many days their money is tied up in inventory.
That gap explains why so many sellers grow sales and still feel broke. Amazon selling in 2026 is less a marketing contest and more a contest of arithmetic and timing.
This article takes a different angle from listing tactics. It treats your Amazon business as a small manufacturing-and-logistics operation with two core numbers: contribution margin per unit, and the length of your cash cycle.
A note on data: the numbers below are hypothetical examples built to show the mechanics. They are not Amazon-published figures. Fee schedules change often, so check Seller Central’s current rate cards before you plug in your own numbers.
Why Revenue Is the Wrong Scoreboard
Revenue tells you how much customers paid. It says nothing about what it cost to deliver that revenue, or when the cash actually arrives in your bank account.
Two sellers can each report $50,000 a month. One keeps $9,000 after all costs and turns inventory every 60 days. The other keeps $1,500 and turns inventory every 150 days. They look identical on a dashboard and are in completely different businesses.
The three numbers that matter more
- Contribution margin per unit: what remains after every variable cost tied to that unit.
- Cash conversion cycle: days between paying your supplier and receiving your payout.
- Inventory turns: how often your stock sells through in a year.
Everything else, including rankings, reviews and ad spend, matters because it moves one of these three.
Build the Real Per-Unit Cost Stack
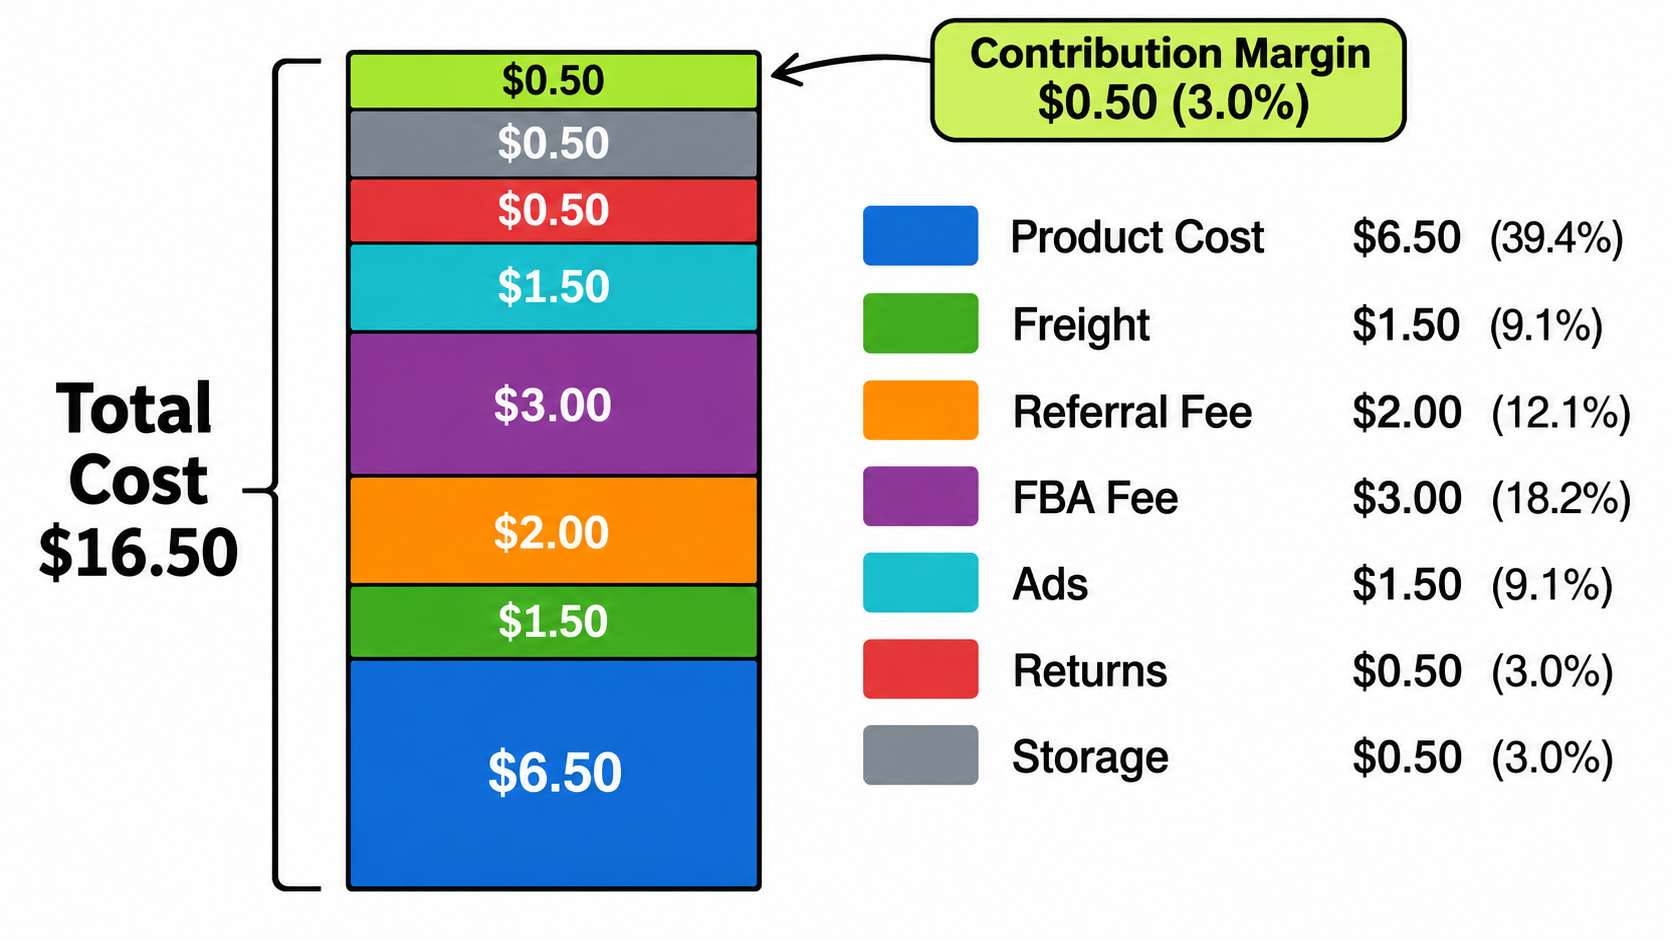
Most sellers calculate margin as price minus product cost minus the FBA fee. That leaves out several lines that quietly eat profit.
Every line you should include
- Landed product cost: unit price plus packaging, inspection, duties, and freight to the fulfillment center.
- Referral fee: Amazon’s category-based percentage of the sale price.
- Fulfillment fee: based on size tier and weight.
- Storage fees: monthly, plus any aged or excess inventory surcharges.
- Advertising: total ad spend divided by total units, not just ad-attributed units.
- Returns and unsellable units: refunds, lost resale value, and removal or disposal costs.
- Software, prep, and overhead: tools, prep centers, and your own time if you want honesty.
A hypothetical example
Imagine a product priced at $30. Landed cost is $8. The referral fee is 15%, or $4.50. The fulfillment fee is $5.50. Storage averages $0.40 per unit. Ads cost $4.50 per unit across all sales. Returns cost an average of $1.20 per unit after refunds and write-offs.
Total costs: $8 + $4.50 + $5.50 + $0.40 + $4.50 + $1.20 = $24.10. Contribution margin: $5.90, or about 20% of price.
Now note how fragile that is. A $1.50 increase in ad cost per unit and a slightly higher return rate could cut profit by almost half. That is why the stack needs to be reviewed monthly, not annually.
TACoS Beats ACoS for Judging Ads
ACoS measures ad spend against ad-attributed sales. It is useful for tuning campaigns, but it can make a weak product look fine and a strong one look bad.
TACoS, total ad spend divided by total sales, shows whether advertising is building organic momentum or just renting it. If ad spend rises and TACoS rises with no lift in organic sales, you are paying for demand you would not otherwise have.
A practical rule
Calculate your break-even ACoS from the contribution margin before ads. In the example above, margin before ads is $10.40 on a $30 price, so break-even ACoS is about 35%. Running at 35% means zero profit on ad-driven sales, which is acceptable only during a deliberate launch phase with a defined end date.
- Set a target TACoS for each product lifecycle stage: launch, growth, mature.
- Review it weekly alongside organic rank movement.
- Cut spend on products where TACoS drifts upward for 6-8 weeks without organic gains.
The Cash Conversion Cycle: Where Growth Gets Strangled
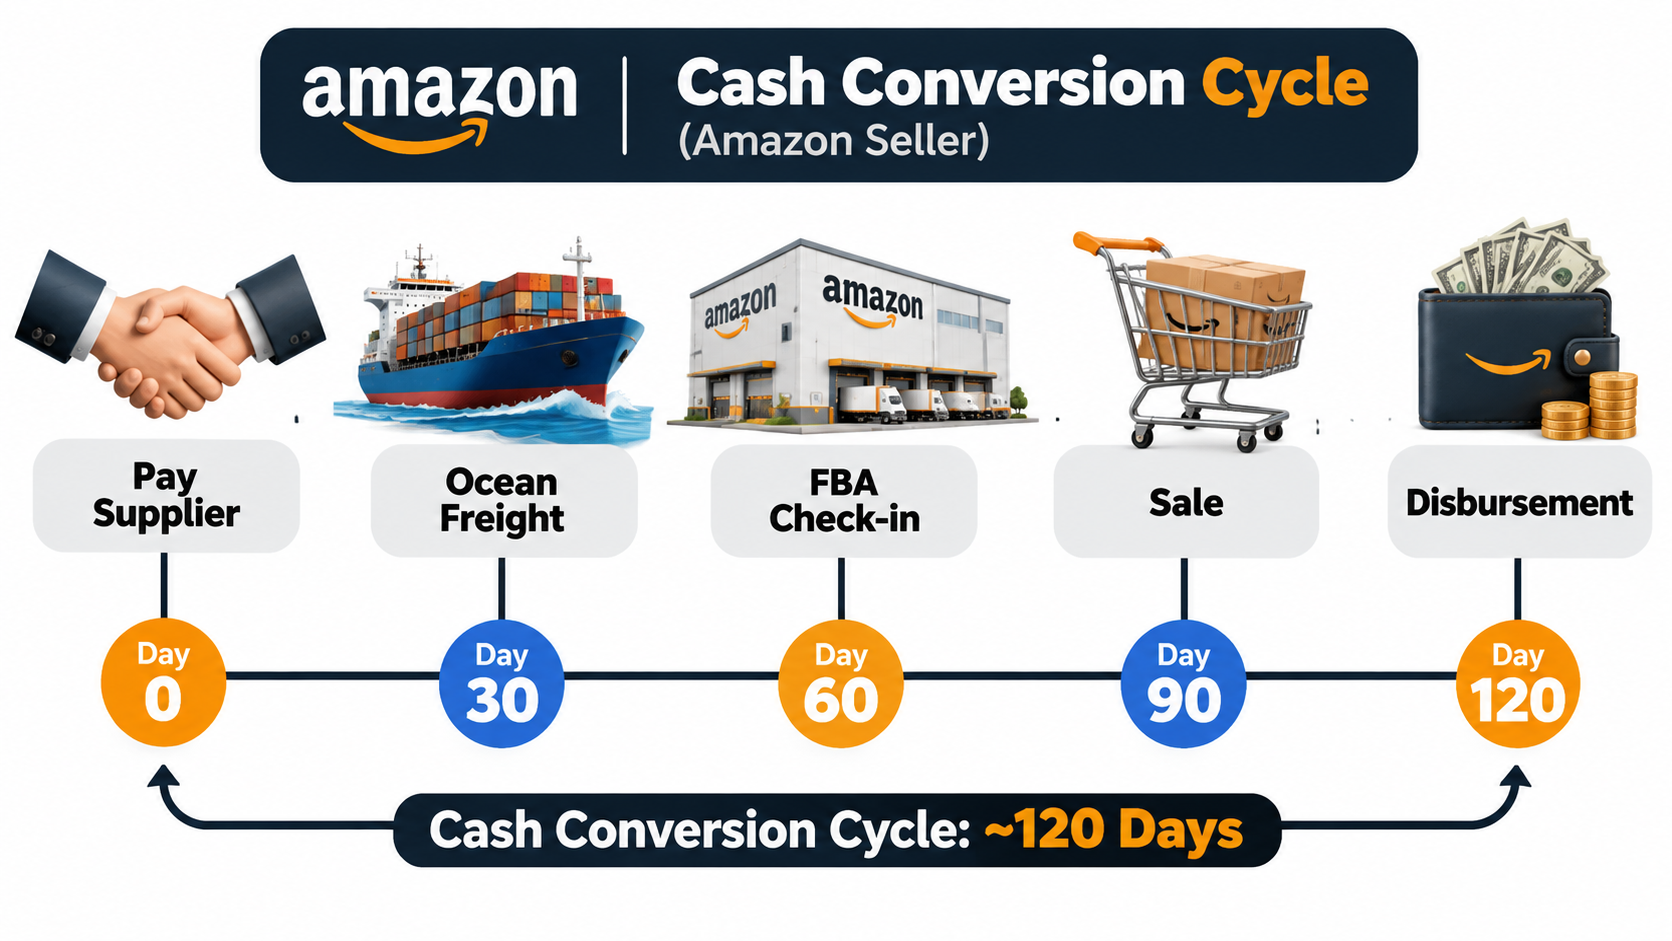
Cash goes out first and comes back much later. You pay a supplier deposit, pay the balance before shipping, pay freight, wait for transit and check-in, sell the units over weeks or months, and then wait for Amazon’s disbursement cycle.
For many private-label sellers, that loop can stretch to several months. During that time your capital is not working for you. It sits on a boat or a shelf.
Why fast growth can bankrupt a profitable product
If a product is profitable but your cycle is long, each reorder needs more cash than the last, because you need to fund bigger batches before the previous batch has fully paid back. Sellers who scale quickly often hit a cash wall right when sales look best.
Ways to shorten the cycle
- Negotiate payment terms: a smaller deposit, or balance due after inspection, reduces cash out early.
- Split shipments: air-freight a small batch for fast restock while the main shipment travels by sea.
- Ship smaller, more frequent batches: this trades slightly higher freight cost for lower capital at risk.
- Consider nearer sourcing: a higher unit cost can still win if it halves your cycle.
Compare financing carefully. A cost that looks high as an annual rate may be fine on a product that turns capital quickly, and ruinous on one that does not.
Inventory Discipline: The Quiet Profit Lever
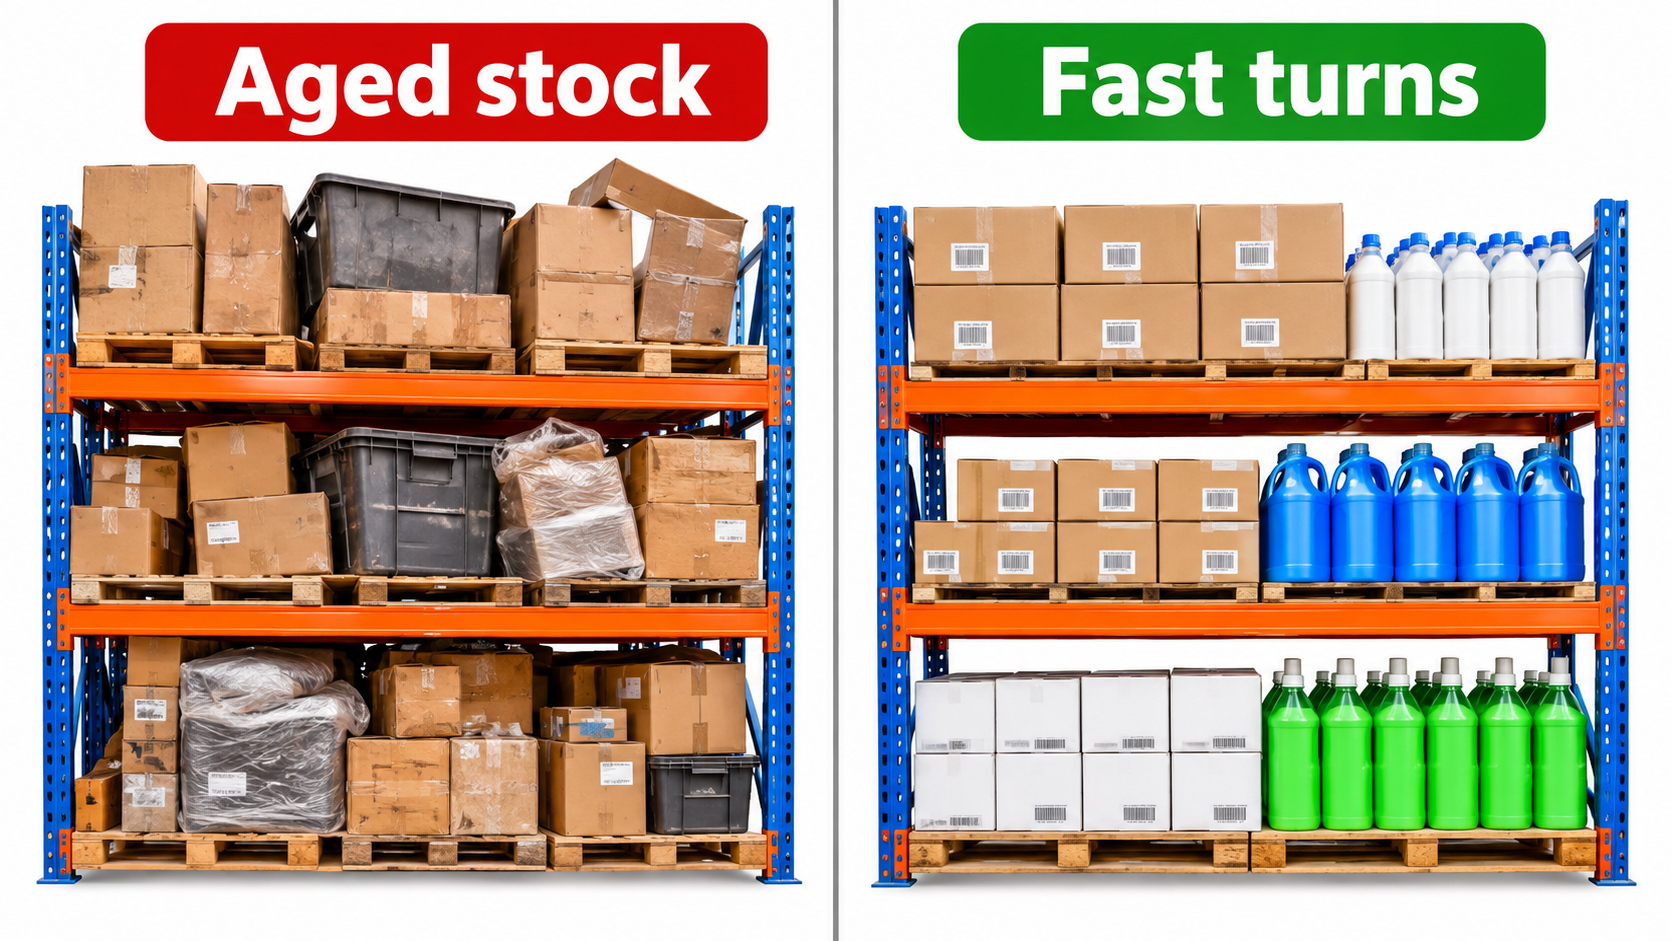
Overstock is expensive in three ways: storage fees, tied-up cash, and the risk of liquidating below cost. Understock is expensive too, because stockouts hurt rankings and hand sales to competitors.
Plan around weeks of cover
Weeks of cover is current inventory divided by average weekly unit sales. Set a target range per product, then work backward using lead time.
- Reorder point = daily sales rate × (lead time + safety buffer in days).
- Use a longer buffer for products with volatile demand or unreliable suppliers.
- Use seasonality adjustments, but only from your own sales history, not guesses.
Know your exit price before you buy
For each batch, decide in advance at what age you will discount, bundle, or remove stock. Waiting until storage surcharges bite is the most common way sellers turn a good product into a loss.
Returns Are a Product Problem, Not a Cost of Business
Many sellers accept returns as a fixed tax. Better ones treat the return reason data as free product research.
Review customer return reasons and negative reviews monthly. Look for patterns: size confusion, a part that breaks, a mismatch between listing and reality.
Fixes that often cost little
- Add a size chart or dimension image where fit is a common complaint.
- Improve packaging if damage is the repeating theme.
- Rewrite bullets that overpromise.
- Add an insert with setup instructions to cut “doesn’t work” returns.
Cutting a return rate by even a couple of points can add more to contribution margin than a price increase, and it improves reviews at the same time.
Choosing Products With Margin Headroom
Product selection decides most of your outcome before you ever write a listing. A product with a thin margin cannot absorb ad cost, fee changes, or a supplier price rise.
A simple screen
- Target a contribution margin that survives a stress test: raise ad cost, freight, and returns each by 20% and see if you still profit.
- Prefer products where size and weight keep fulfillment fees low relative to price.
- Check whether the category’s top sellers compete on price alone. If yes, margin will erode.
- Look for differentiation you can actually deliver: a better component, a bundle, or a fix for a recurring complaint in competitors’ reviews.
- Avoid products that need constant heavy ad spend to hold rank.
Tools like PickFu-style consumer polling can test which main image, title angle or variation shoppers prefer before you commit to inventory. That is cheap insurance compared with a full production run.
Listing Quality Still Matters, but as a Conversion Lever
Listings matter because conversion rate changes how much you pay for each sale. If conversion rises from 10% to 12%, the same ad click budget produces 20% more orders, so ad cost per unit falls.
View listing work through that lens. Test the main image, first bullets, price point, and A+ content one at a time, and judge each by unit economics rather than by how nice it looks.
- Main image: the biggest driver of click-through in search results.
- Price: test small steps, and measure contribution margin, not just sales.
- Reviews and rating: protect them with quality control and clear expectations.
Diversify Risk Before It Becomes an Emergency
Platform dependence is a business risk. Policy changes, listing suppressions, or account reviews can freeze revenue quickly.
Reasonable protections
- Keep documentation for suppliers, invoices, and compliance ready to produce.
- Hold a cash reserve that covers fixed costs for at least a couple of months.
- Avoid depending on a single product for most of your profit.
- Build an email list or direct channel where policy allows.
- Maintain a second supplier or at least a qualified alternative.
A Monthly Operating Rhythm
Consistency beats cleverness. A short monthly review catches problems while they are small.
- Week 1: update the per-unit cost stack with current fees, freight, and ad data.
- Week 2: review inventory cover, aged stock, and reorder points.
- Week 3: analyze returns and reviews; list fixes.
- Week 4: check cash position and plan the next purchase order against forecast payouts.
Conclusion: Run It Like an Operator
Amazon selling rewards sellers who know their numbers. The platform makes revenue easy to see and profit hard to see, so you have to build that visibility yourself.
Actionable takeaways
- Calculate contribution margin per unit including ads, returns, and storage.
- Track TACoS and break-even ACoS for each product, with a defined launch budget.
- Measure your cash conversion cycle and look for ways to shorten it.
- Manage inventory by weeks of cover and set an exit plan per batch.
- Mine returns and reviews for product fixes.
- Stress-test new products with 20% worse costs before buying.
- Keep a cash reserve and avoid single-product dependence.
Do these consistently and growth stops being a gamble. You will know which products deserve more capital, which deserve less, and when to walk away.