
For most of Amazon’s history, the story of selling on it was one of endless supply. Each year brought more sellers, more listings, and more competition fighting over roughly the same shoppers. That story has now flipped, and most commentary hasn’t caught up.
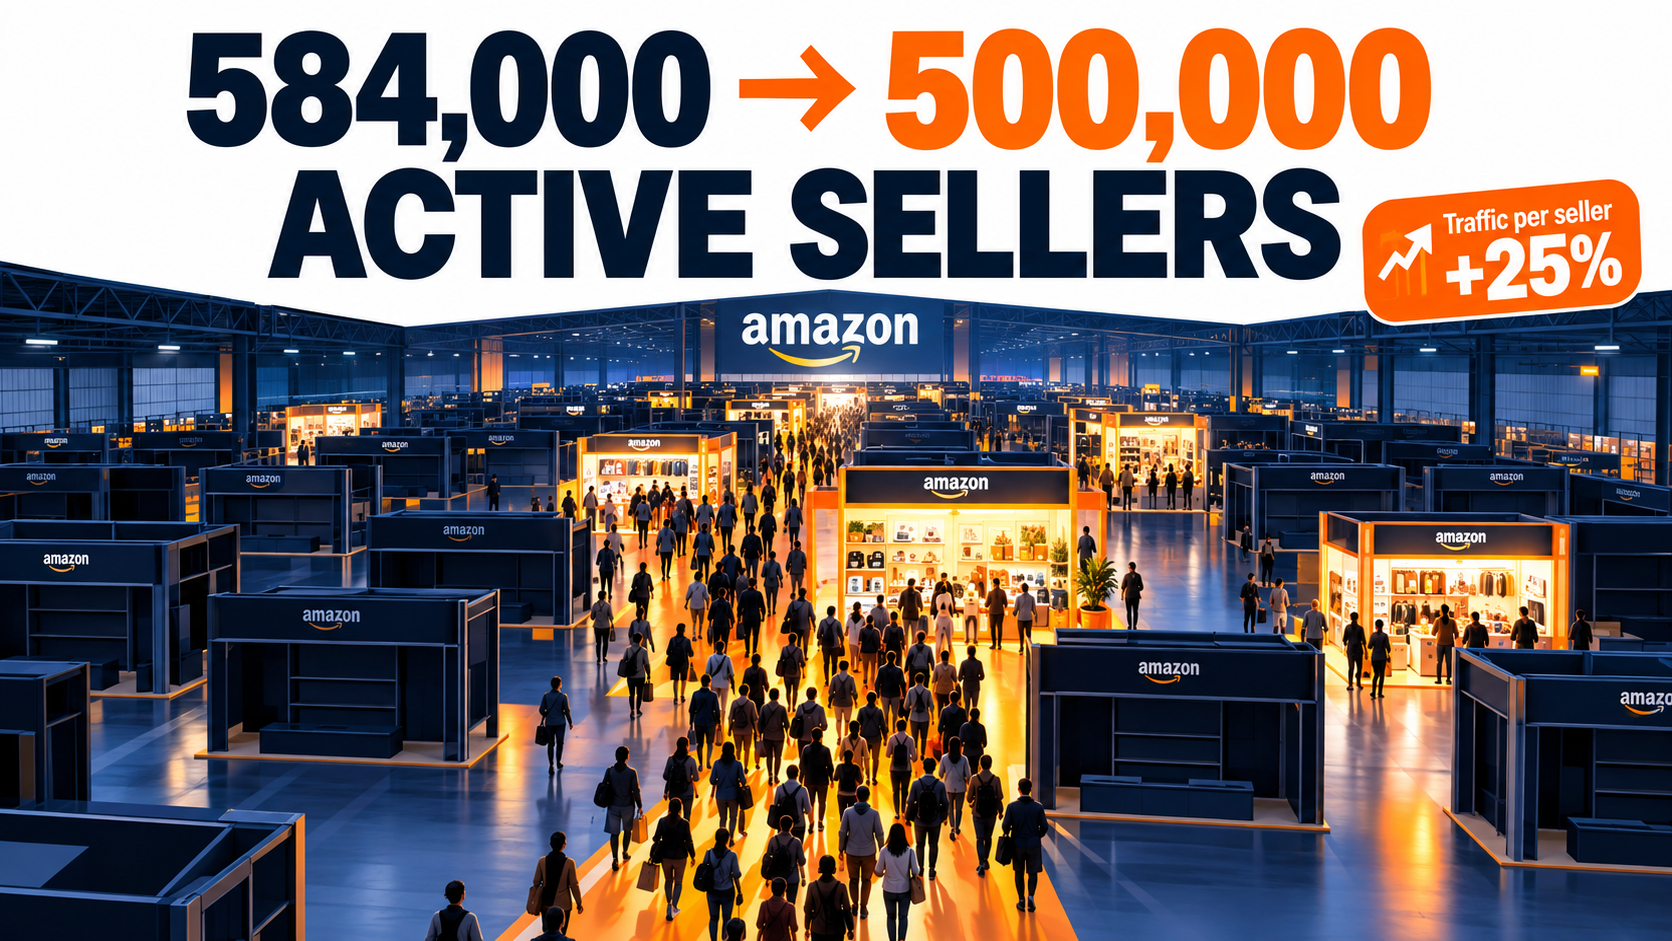
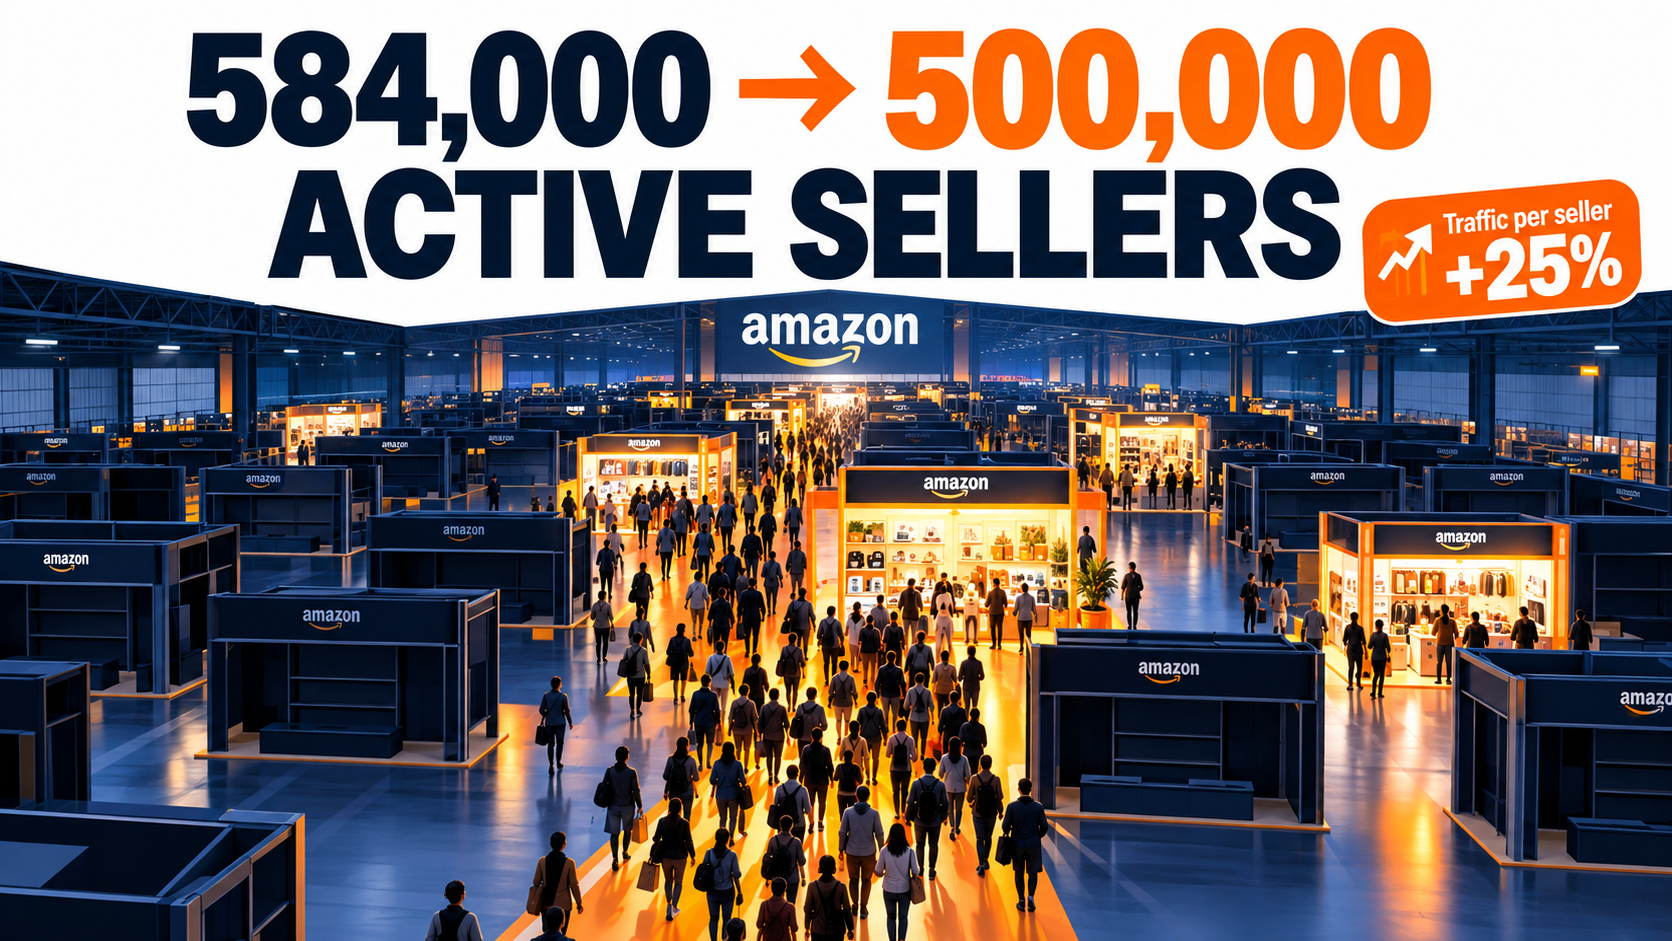
According to Marketplace Pulse, the number of active sellers on Amazon.com fell from 584,000 in January 2025 to 500,000 in March 2026, a drop of about 84,000 in fourteen months. Over the same period, shopper traffic kept growing. Fewer sellers are now splitting a bigger pool of demand.
That sounds like good news for whoever is left, and in part it is. But the details are messier. The demand isn’t spreading evenly among the survivors. It is piling up with a small group of operators, moving toward sellers based in China, flowing into an AI shopping assistant that largely ignores search rank, and increasingly going to places many sellers never think about, such as B2B procurement and smaller international marketplaces.
This article follows the demand. Rather than repeating the usual list-building and PPC advice, it looks at the structural data from 2026: who left, who gained, which new surfaces are taking shopper attention, and what the numbers say about where a seller should put limited time and money over the next year.
Most of the data comes from Marketplace Pulse’s 2026 research and its Seller Index survey of 181 marketplace sellers with more than $2 billion in combined annual revenue, along with Amazon’s own earnings disclosures and Jungle Scout’s 2026 benchmark work. Where a figure comes from a single study or an early snapshot, that is noted.
The Shrinking-Seller Paradox: Less Competition, Harder Business
Start with the headline numbers. SimilarWeb data cited by Marketplace Pulse shows combined web traffic across all 23 Amazon marketplaces grew nearly 5% to 5.5 billion monthly visits. Meanwhile, active sellers worldwide (those who received at least one feedback in the past year) fell 16% to fewer than 1.56 million.
The result is a sharp rise in attention per seller. Average traffic per active seller rose 25% in one year to 3,544 monthly visits. Over the previous four years combined, that metric had grown only 31%.
Why sellers are leaving when demand is growing
If demand is rising, why are sellers leaving? Marketplace Pulse points to several pressures hitting at once:
- Cost of goods volatility. Tariffs and inflation have made landed costs harder to predict over the past year.
- Price competition from China-based sellers, who now make up more than half of Amazon’s active sellers worldwide.
- A higher operational bar. AI tools have raised baseline listing quality, and established sellers are using them to extend their lead.
- Platform costs. Marketplace fees are the top margin concern among Amazon sellers, with advertising close behind.
Put simply, the marketplace hasn’t lost customers. It has lost the sellers who could no longer make the math work.
What “less competitive” actually means
Being careful here matters. Fewer sellers doesn’t mean less competition for any particular search term. Jungle Scout’s 2026 benchmark analysis found rising cost-per-click and fragmented category structures, meaning demand is “becoming more expensive and more competitive to capture.” It also found unit growth outpacing revenue growth across categories. Demand is expanding, but sellers have little pricing power.
So the paradox works like this: there is more attention per seller on average, yet each individual click costs more. That only fits together once you see how unevenly the attention is spread, which the next section covers.
The takeaway for operators
Marketplace Pulse’s summary is blunt: “For sellers capable of executing at the standard the platform now demands, the share of customer attention available to each seller has never been greater.” The key word is “capable.” The departures are a filter, not a handout. A seller thinking about entering or expanding in 2026 should read the data as “the average got easier and the minimum got harder.”
The Concentration Curve: 8,000 Sellers, Half the Money
The clearest single statistic about Amazon selling in 2026 is this one: fewer than 8,000 sellers now generate half of Amazon’s estimated $300 billion in U.S. third-party GMV. Less than three years ago, it took about 15,000 sellers to make up that half.
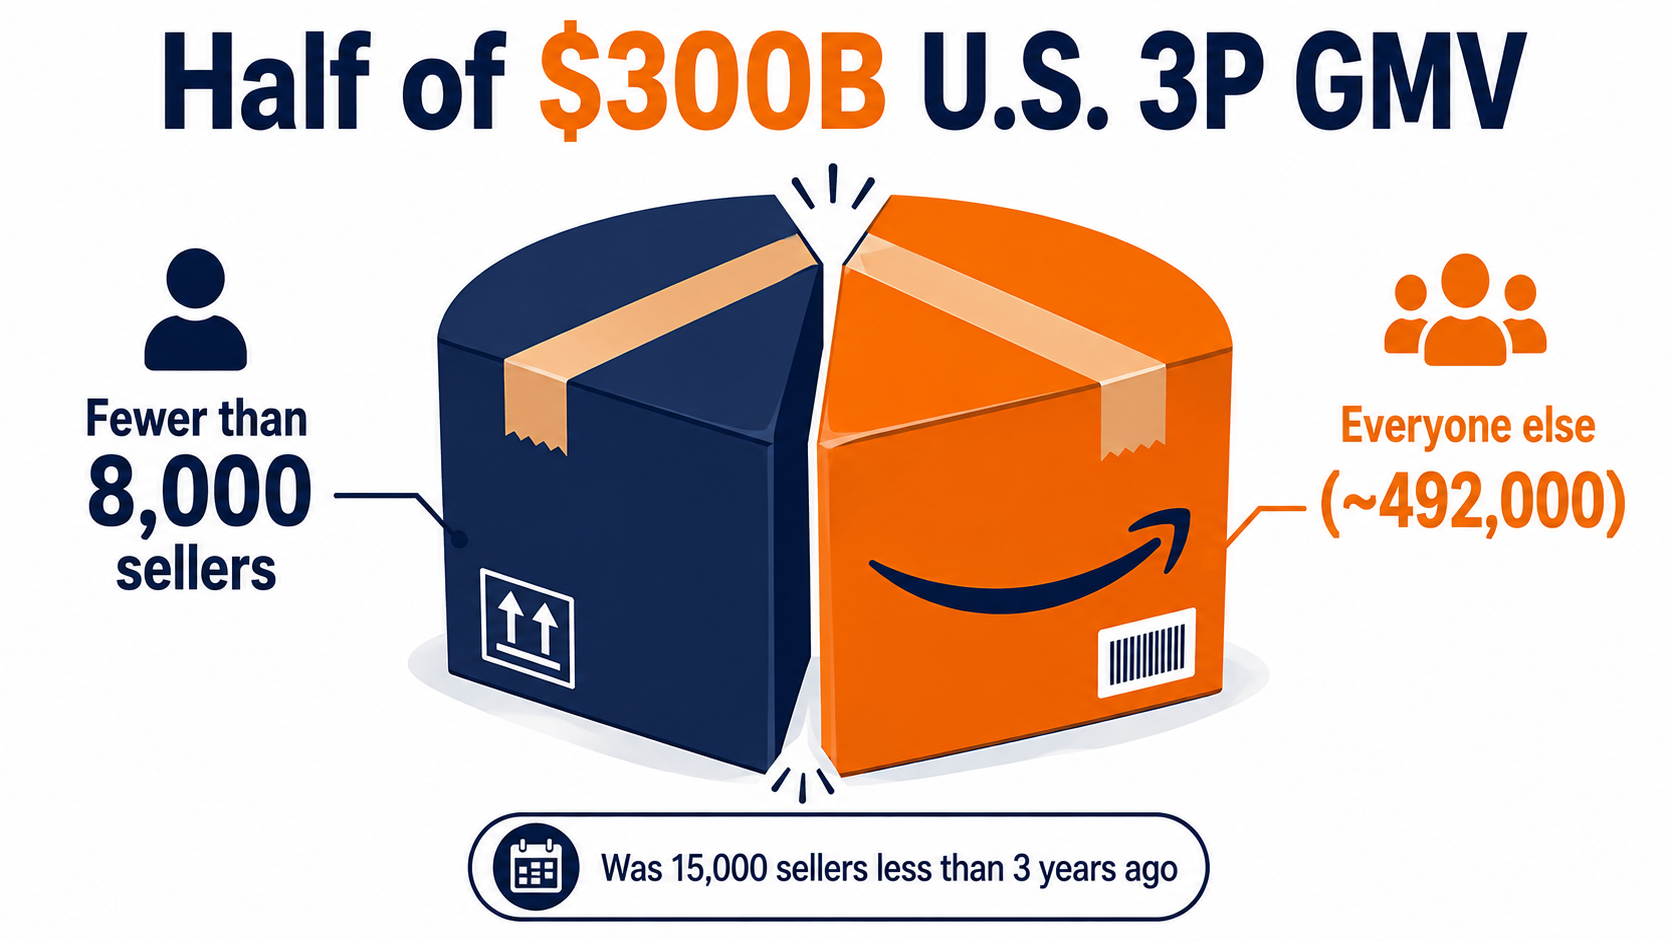
In other words, the group of sellers who matter to Amazon’s revenue has roughly halved in size while the revenue grew. The extra traffic per seller from the previous section isn’t reaching the typical seller. It is going mostly to this top tier.
Why concentration accelerates
Concentration on Amazon tends to reinforce itself for three reasons:
- Ad budgets buy sales velocity, and velocity earns organic rank. Marketplace Pulse describes rank as something “earned slowly through the sales velocity that ad budgets are spent to manufacture.” Sellers with bigger budgets manufacture more of it.
- Fixed costs spread better at scale. Tooling, compliance, creative production, and account management cost about the same whether a seller does $2 million or $20 million a year.
- AI adoption follows revenue. Seller Index data shows sellers under $500K average 2.42 AI use cases, while sellers over $5M average 3.67.
Staying power at the top
Being at the top has also become more durable. Among the top 10,000 Amazon.com sellers, 68.6% held that position a year earlier, compared with 67% in 2019. Nearly half (49.6%) were already there three years ago, up from 41% in 2019.
Marketplace Pulse concluded back in 2019 that “it takes years to build a lasting business on Amazon, but once built, sellers can maintain it for years.” The 2026 data still supports the first half of that. The second half needs an update: time on the platform still helps, “but less of it, and for fewer sellers.”
What this means if you’re not in the top 8,000
For a mid-sized seller, the concentration data argues against trying to beat category leaders head-on through the auction. The leaders can outspend you on the exact keywords you both want. The better options are surfaces where incumbency counts for less, which is exactly what the AI shelf, B2B, and international sections below cover.
Who Replaced the Sellers Who Left: The China/U.S. Split
Turnover at the top of Amazon runs at about the same rate it did seven years ago. What has changed is who takes the open spots.
Since July 2020, China-based sellers have gained 1,342 positions in the top 10,000, and U.S.-based sellers have lost 1,320. Chinese sellers made up 42.5% of that group in 2020 and 55.9% in 2026. U.S. sellers fell from 53.7% to 40.5%. In the last twelve months alone, 3.8 percentage points of share moved.
Headcount vs. revenue: two different pictures
Count and value tell very different stories. U.S. sellers still hold 65.3% of the GMV produced by the top 10,000, against 28.6% for Chinese sellers. That is the reverse of the headcount split.
The gap is widest at the very top. U.S. sellers make up 81.4% of the top 100 and produce 93.2% of its GMV. In the 5,001 to 10,000 band, they are only 34%. Average selling price also differs at every rank, most sharply in the top 100: $47.62 for U.S. sellers versus $22.03 for Chinese sellers.
Why factory-direct sellers are winning the middle
Marketplace Pulse lists the advantages newer China-based sellers bring: manufacturing proximity, direct factory relationships, export subsidies, and AI tools that “erased the listing-quality gap once protecting domestic sellers.” They are also entering a marketplace where organic real estate has given way to sponsored placement, and factory-direct sellers working on thinner product margins can outbid veterans for it.
The tenure data shows the pressure on older cohorts. Half of today’s top sellers registered before 2019, down from more than 60% a year ago. The weakest cohort is sellers who registered in 2019 to 2021, at 17.5% of the top 10,000. That group entered at the pandemic peak and has been squeezed from both directions since.
The strategic read
The data points to a practical split:
- Competing on price in commodity sub-$25 categories puts you directly against sellers with structural cost advantages. That is a hard fight to win from a Western cost base.
- Competing on brand, higher price points, and differentiation is where U.S. sellers still dominate the most valuable ranks. The $47.62 vs. $22.03 ASP gap is the clearest signal of where the defensible ground is.
Amazon itself is formalizing the low-price, direct-from-China lane. Amazon Haul, its section for items under $20, passed 3,000 sellers by early 2026, according to Marketplace Pulse. If you’re competing in that price range, you’re now up against a dedicated Amazon program, not just individual sellers.
The Four Kinds of Amazon Seller in 2026
Platform-level numbers show growth: U.S. e-commerce grew 12.2% in Q2 2026, its fastest pace in five years, and reached a record 17.1% of all retail spending. But the aggregate hides a very uneven seller experience.
The Marketplace Pulse 2026 Seller Index sorted respondents into four groups by revenue and margin trends:
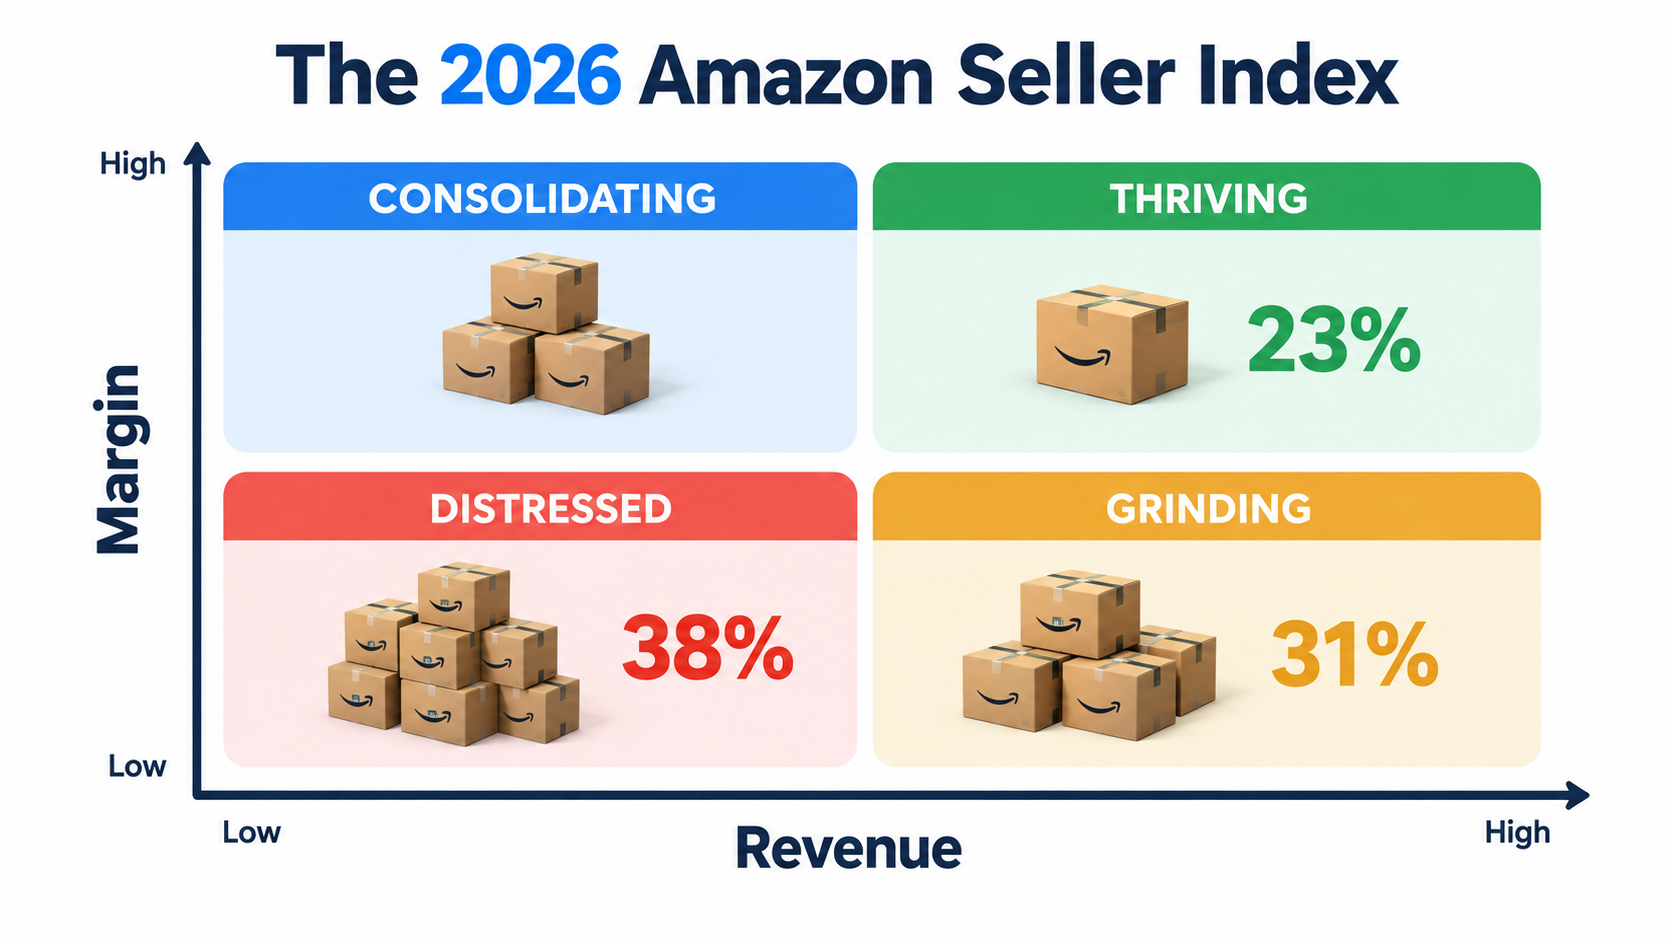
- Thriving (23%): revenue up and margins up.
- Grinding (31%): revenue up, margins flat or down.
- Consolidating: revenue flat or down, margins up.
- Distressed (38%): Marketplace Pulse describes this group as having “at best, no growth in sight,” and at worst both revenue and margins falling.
Across the survey, 47% of sellers reported a year-over-year margin decline.
The grinding trap
The grinding group deserves the most attention because it’s the easiest to misread from the inside. Revenue is growing, dashboards look healthy, and the business feels like it’s working. But if every extra dollar of revenue arrives at a lower margin, usually because it was bought through advertising, the business is running on a treadmill. Marketplace Pulse calls it “potentially unsustainable.”
A practical test: if your TACoS (total advertising cost of sale) has risen faster than your revenue for three quarters in a row, you’re probably grinding, whatever the top line says.
Consolidating is a legitimate strategy
Sellers often treat flat revenue as failure. The consolidating group shows another option: cut unprofitable SKUs, pull back ad spend on low-margin keywords, and accept a smaller business that makes more money. In a year when 47% of sellers saw margins fall, deliberately trading revenue for margin is a reasonable choice, not a retreat.
Diagnosing your own cohort
Before choosing any tactic, work out which group you belong to using contribution margin after ads, not gross margin. The right plan is very different for each:
- Thriving: reinvest in new surfaces (AI shelf, B2B, international) while you have margin to spare.
- Grinding: audit ad efficiency and SKU-level profitability before chasing more growth.
- Consolidating: protect margin and look for demand you don’t have to buy at auction.
- Distressed: focus on cash preservation, inventory liquidation, and a hard look at which SKUs deserve to survive.
The Fee and Float Squeeze: Why Cash Flow Is the New Margin
Ask sellers what hurts most and the answer is consistent. In the 2026 Seller Index, 49% named marketplace fees as their primary margin concern, and 46% named advertising spend. Both are costs Amazon controls.
Amazon’s own numbers show how much these costs have grown. Its advertising business brought in $68.6 billion in 2025, up 22%. Marketplace Pulse estimates that third-party seller fees and advertising together now make up roughly a third of Amazon’s total company revenue.
Three changes that hit working capital
Early in 2026, three policy changes squeezed sellers in a way headline fee percentages don’t show. Marketplace Pulse reported:
- A 3.5% fuel surcharge.
- Automatic deduction of ad costs from seller proceeds, which removed the credit card cash-back many sellers earned by paying ad bills on cards.
- DD+7 disbursement terms, which hold payment until seven days after delivery.
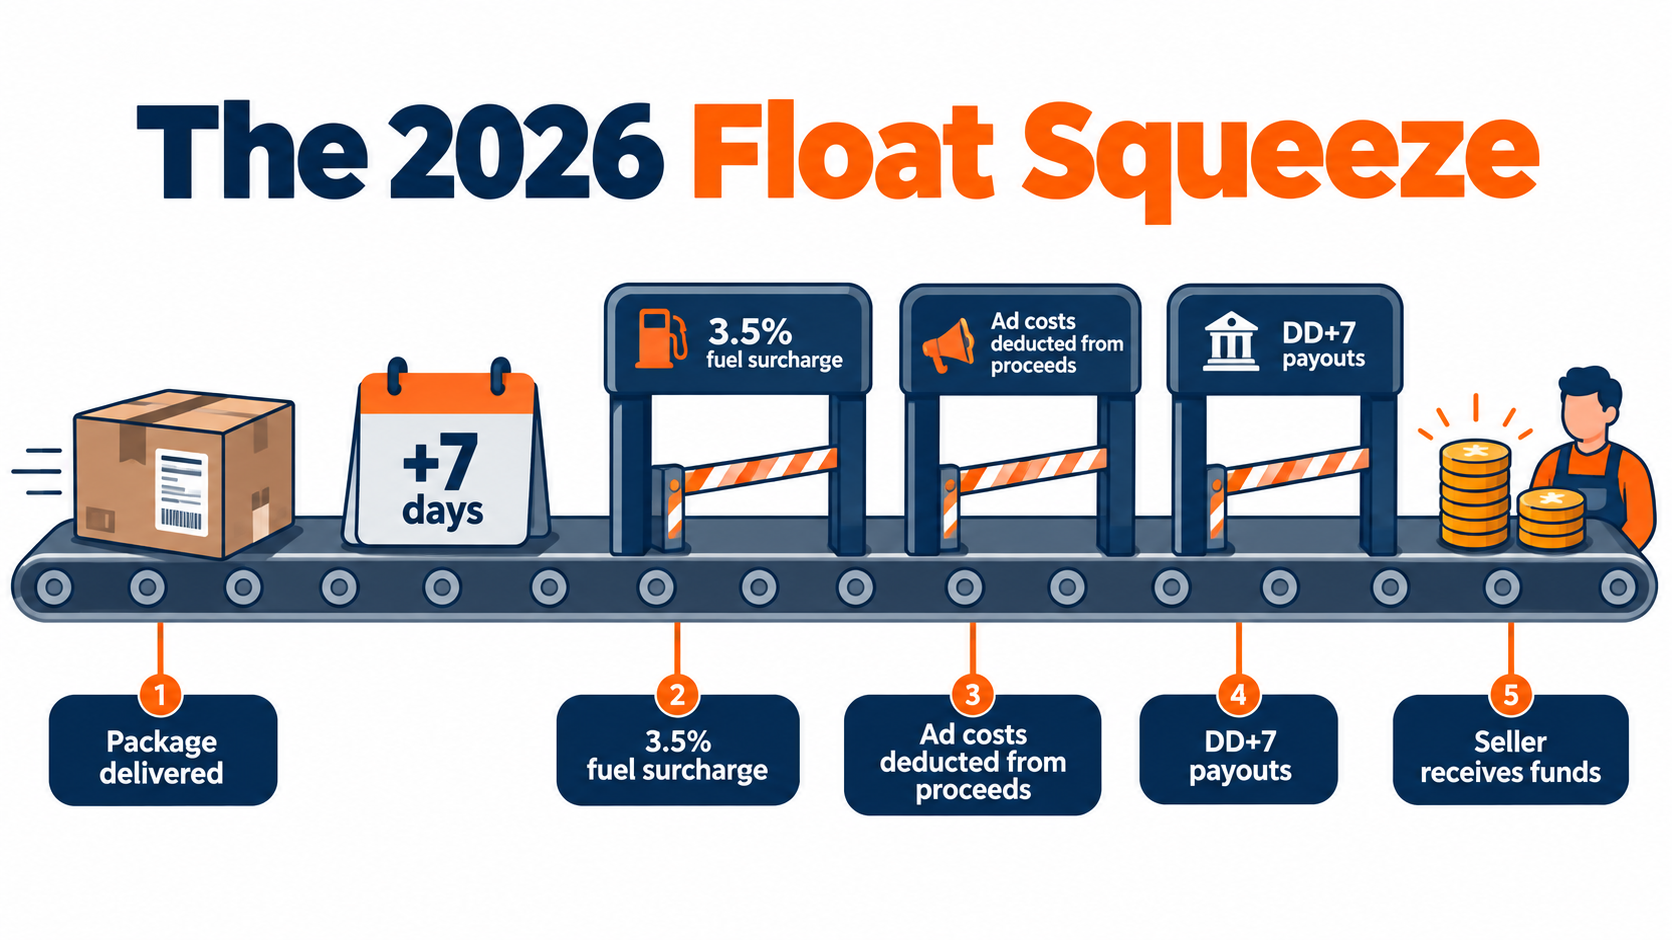
Together, these removed the financial float that sellers with shrinking margins had been relying on. Some sellers organized an advertising boycott for April 15. Amazon rolled back the ad payment change the day before and pushed it to August. Sellers should check the current status of that change in Seller Central instead of assuming the rollback still applies.
Why the boycott math matters
Marketplace Pulse estimated that even if 1,000 high-volume sellers ($10 million in annual revenue each, spending 10% on ads) boycotted for a full day, the impact would be about $3 million. That’s less than 2% of a typical day’s ad revenue. Its conclusion was that the rollback had more to do with regulatory optics during the FTC antitrust case, and with managing sentiment among a shrinking seller base, than with lost revenue.
The lesson for sellers: collective pressure can shift timing and optics, but it isn’t a reliable way to reverse Amazon policy. Plan your business assuming platform costs keep going up.
Practical responses to the float squeeze
- Model cash conversion, not just margin. Add DD+7 timing to your cash forecast and work out how many extra days of working capital you need at peak season.
- Re-run your ad payment economics. If you relied on card rewards to offset ad costs, that offset may be gone. Update your true ad cost per sale.
- Load the fuel surcharge into landed cost. A 3.5% surcharge on fulfillment is small per unit, but it can push low-price SKUs from marginal to unprofitable.
- Arrange financing before you need it. Sellers who line up inventory credit during calm months get better terms than those scrambling in Q4.
The dependence problem
Despite the frustration, sellers aren’t leaving. Among sellers most frustrated with fees, only 24% are reducing Amazon’s share of their revenue, while 42% are growing it. Amazon holds 36% of U.S. e-commerce and 70% of marketplace commerce. Marketplace Pulse calls the relationship “high-stakes mutual dependence.” Amazon relies on a concentrated seller base that produces about 69% of its GMV, and sellers rely on an audience no one else can match.
The Third Shelf: Amazon’s AI Assistant Doesn’t Follow Search Rank
This is the most important strategic development in Amazon selling this year, and most sellers are still optimizing (in the dashboard sense) only for the first two shelves.
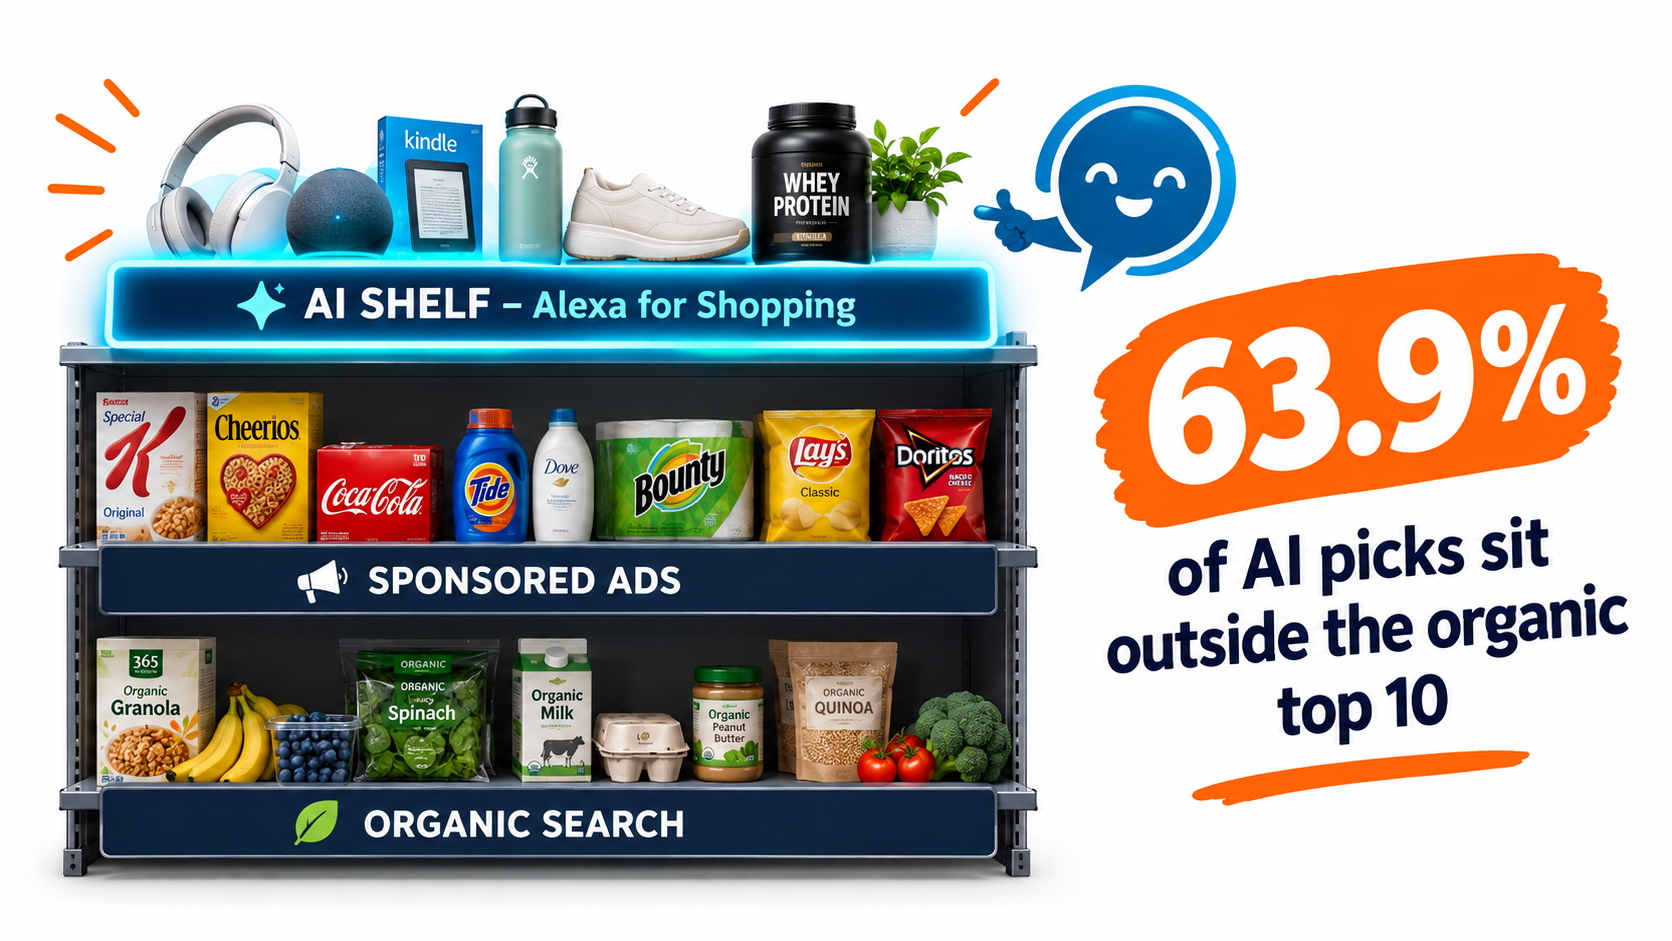
In May 2026, Amazon renamed Rufus as Alexa for Shopping, folding its recommendation engine into a broader assistant. That summer, Autopilotbrand.com, a vendor of AI discovery tools, ran one of the first large-scale studies of what the assistant actually recommends: 1,963 non-branded queries and 12,810 recommendations captured in May and June.
What the study found
The researchers asked the assistant “best of” questions (for example, “what is the best queen mattress?”) and compared its picks with the plain category search (“queen mattress”). As reported by Marketplace Pulse:
- 63.9% of the assistant’s picks fell outside the organic top 10 for the matching search term.
- 40.9% never appeared on the visible search results page at all.
- Only 14.3% of picks were products running a sponsored listing on that search page, and 83% of those already ranked organically anyway.
Marketplace Pulse summarized it this way: rank and ads, the two routes to visibility in search, “neither appears to shape AI discovery yet.”
Why this matters more than any listing tweak
For years, the Amazon playbook has been: buy velocity with ads, turn velocity into rank, turn rank into organic sales. Everything in the concentration section above follows from that loop, and it favors incumbents.
The AI shelf breaks the loop, at least for now. Autopilotbrand’s CEO Christian Umbach put it like this: “Brands cannot simply buy or rank their way onto it; they need to give Amazon’s AI Alexa enough context to understand when and why their product is the right recommendation.” He added: “For products that do not yet own the top of search, this creates an entirely new path to compete.”
Important caveats
Marketplace Pulse is clear that this is a single snapshot from one U.S. account, captured early, and the study was run by a vendor that sells AI-discovery services. Treat the numbers as directional. The broader trend, an assistant that no longer just reprints search results, fits with how Rufus developed over the previous two years.
How to give the assistant “enough context”
Nobody outside Amazon knows exactly how the assistant selects products. But the study’s framing (intent-based questions answered with deeper-catalog products) suggests some sensible practices:
- Write for use cases, not just keywords. An assistant answering “best mattress for a hot sleeper” needs listing content that explicitly says who the product is for and why.
- Fill every structured attribute. Backend attributes, compatibility fields, materials, and dimensions give an AI system machine-readable facts to reason with.
- Answer the questions shoppers ask. Review your customer Q&A and reviews for recurring questions, and answer them directly in bullets and A+ content.
- State differentiators clearly. “Better quality” gives an assistant nothing to work with. “Double-stitched seams tested to 50 kg” does.
- Update seasonally. Umbach specifically mentions “continuous updates as seasonal use cases and product differentiators evolve.”
- Test it yourself. Ask Alexa for Shopping the “best X for Y” questions your customers would ask, and record which products come up. This costs nothing and is the most direct signal available.
The Window Is Closing: Ads Are Coming to the AI Shelf
The AI shelf is valuable because ad spend doesn’t yet dominate it. That won’t last, and Amazon’s disclosures show how quickly it is changing.
The scale of Amazon’s assistant
Amazon has shared unusually specific numbers about its shopping assistant:
- Andy Jassy credited Rufus with $12 billion in incremental sales in Amazon’s 2025 results.
- In Q1 2026, Rufus monthly active users were up 115% year over year, and engagement was up nearly 400%.
- Amazon launched Sponsored Products and Brand Prompts inside Rufus that quarter.
- Amazon said nearly 20% of shoppers who interact with a sponsored brand prompt continue the conversation about that brand. Jassy noted that “it is early,” and the metric measures continued engagement, not purchases.
The rest of the industry is converging on ads too
For a while, it seemed that agentic commerce might follow a different model. ChatGPT’s Instant Checkout charged merchants a 4% transaction fee and offered discovery that didn’t depend on ads. That option is gone. According to Marketplace Pulse, OpenAI launched ChatGPT ads in February, dropped Instant Checkout in March, and then opened its ads manager to all U.S. advertisers with no $50,000 minimum.
Marketplace Pulse’s conclusion: “agentic commerce is settling into an ad-supported model.” McKinsey and ICSC forecast U.S. agentic commerce reaching $1 trillion by 2030, citing 68% of consumers who used at least one AI tool for shopping in the previous three months.
Consumer behavior is changing faster than seller behavior
Adobe Digital Insights reported a 393% year-over-year increase in AI-referred retail traffic in Q1 2026. AI-referred visitors now convert 42% better than non-AI traffic, reversing the pattern of a year earlier when they converted at roughly half the rate. Revenue per AI visit is 37% higher.
Not every data point agrees. Walmart reported that in-chat purchases converted at a third of the rate of click-throughs to its website. The overall direction is still clear: shoppers are adopting AI discovery quickly, and it is turning into valuable traffic.
What to do before the ad load arrives
Marketplace Pulse makes the comparison directly: “Search looked like that once too, before the ad load found it.” Sellers who got into Sponsored Products early paid lower CPCs and built rank before prices went up. The AI shelf is probably at a similar point now.
- Build your organic AI presence now, while catalog quality, not budget, decides placement.
- Test Sponsored Prompts in small amounts to learn how they perform before competition raises prices.
- Track AI recommendations as a KPI next to organic rank and share of voice. The sellers who “notice the day that changes,” in Marketplace Pulse’s words, will be the ones already measuring it.
How Sellers Actually Use AI (And Why a Quarter See No Results)
There is a gap between how platforms use AI and how sellers use it. Platforms are rebuilding discovery around AI, while most sellers are using it to write bullet points.
Adoption is broad but shallow
According to the 2026 Seller Index, 83.4% of marketplace sellers use AI somewhere in their business, averaging 3.2 use cases each. But usage is concentrated in content:
- Listing copy and listing improvements: 63.5%
- Image and video creation: 49.2%
- Advertising management, competitive intelligence, pricing, and inventory forecasting: well behind
The most common answer about impact was that no area had delivered measurable results yet: 25.4%, more than any specific win.
Scale brings breadth, not better outcomes
Larger sellers use more AI tools, but the share reporting no measurable impact barely changes across revenue bands. Marketplace Pulse notes that “scale is bringing breadth, not better outcomes, at least not yet.”
The clearer divide is seller health. In the thriving and grinding groups, about 16% report no measurable AI impact. In the consolidating and distressed groups, that figure is roughly double. Whether AI drives growth or growing sellers simply have more capacity to get value from it is, as Marketplace Pulse says, an open question.
Why content-only AI underdelivers
There’s a structural reason content-focused AI often shows no measurable return. When everyone uses AI to write polished listings, polished listings stop being an advantage. Marketplace Pulse noted that AI tools “erased the listing-quality gap once protecting domestic sellers.” A tool that raises everyone’s baseline can’t give anyone an edge.
The less crowded uses are the ones sellers adopt least:
- Inventory forecasting, which directly affects storage fees, stockouts, and the cash-flow squeeze described above.
- Pricing analysis in a market where Jungle Scout found little pricing power. Precision matters more when margins are thin.
- Ad bid and budget analysis, addressing one of the two biggest margin concerns.
- Competitive monitoring across the AI shelf, not just search rank.
Marketplace Pulse also reports that some nine-figure sellers are building their own internal AI tools, going well beyond “prompting ChatGPT for ad copy.” Its conclusion: AI is “increasingly becoming the operating layer and the channel itself.”
A practical audit
List every AI use case in your business. For each one, write down the metric it should move and whether that metric has actually changed. Anything that can’t be tied to a metric is a cost, not an investment. Move time away from content generation and toward operational decisions where errors cost real money.
The Overlooked Channel: Amazon Business at $60 Billion
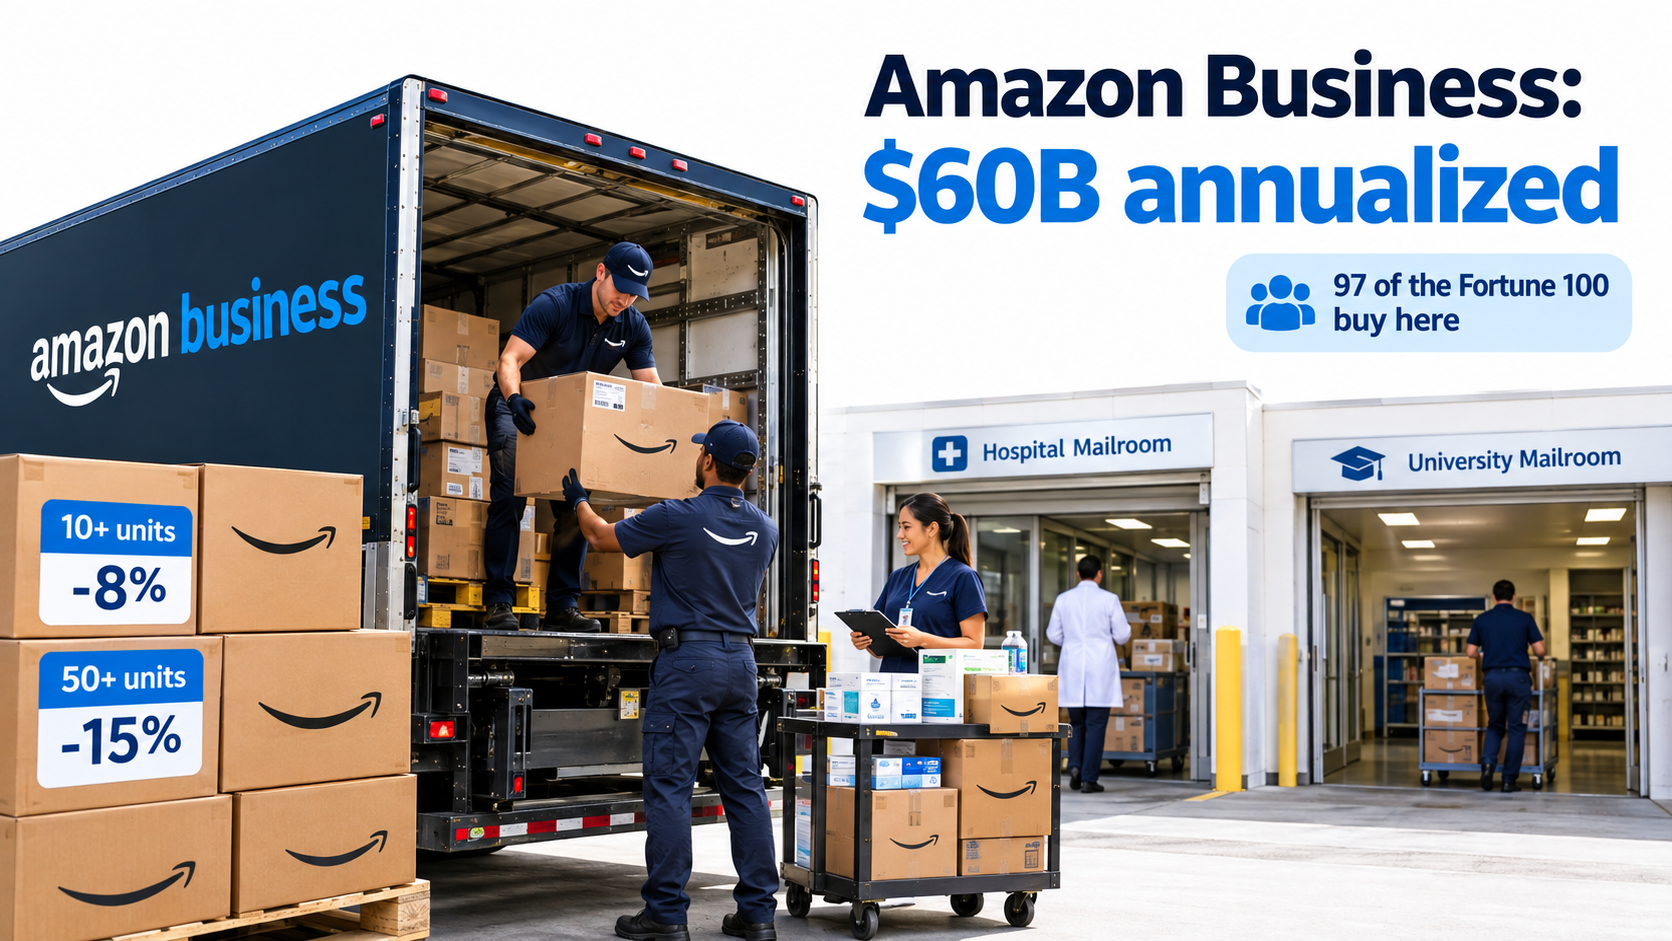
While most sellers compete for consumer clicks, a large channel grows quietly next to them. Amazon Business has reached $60 billion in annualized gross sales, up from $35 billion in 2023 and $25 billion in 2021.
The size of the opportunity
Marketplace Pulse estimates Amazon Business accounts for about 7% of the $830 billion Amazon and its sellers sold in 2025. Amazon has said more than half of Amazon Business sales come from third-party sellers, which puts roughly $30 billion of it in sellers’ hands.
Growth has been steady at about 18% a year from 2021 to 2023 and again from 2023 to 2026. That’s roughly double the 9% growth in Amazon’s overall GMV last year. On this trajectory, Marketplace Pulse expects it to pass $100 billion before the end of the decade.
Why B2B demand is different
Amazon Business customers include hospitals, universities, government agencies, and 97 of the Fortune 100. These buyers tend to have higher average order values and more repeat purchasing than typical consumers.
Marketplace Pulse points out an imbalance. Nearly everything Amazon announced alongside the $60 billion milestone was aimed at buyers: an account assistant, Savings Insights for bulk discounts, Spend Anomaly Monitoring, dedicated delivery trucks in 13 states, and Prime Business bundles. The seller-side tools have “changed little”:
- Business-only pricing visible to verified buyers
- Tiered quantity discounts
- Business-only listings
- Responding to custom quote requests
Why this is a margin play, not just a revenue play
Remember that 49% of sellers say fees are their top margin concern and 46% say advertising. Marketplace Pulse draws the connection directly: “Incremental demand captured through quantity discounts on existing inventory is a different proposition than incremental demand bought through an ad auction.”
B2B demand comes through listings you already maintain. You aren’t buying it one click at a time.
Getting started with B2B
- Enroll in the Amazon Business seller program and set business pricing on products that businesses plausibly buy: office supplies, cleaning products, tools, packaging, breakroom items, lab consumables, and IT accessories.
- Build quantity discount tiers that reflect your real per-unit savings when shipping multiples.
- Respond to quote requests quickly. Procurement buyers compare offers, and response time is a differentiator.
- Offer case packs or multi-packs that match how institutions order.
- Make tax and compliance documentation easy to find, since B2B buyers often need it to get purchases approved.
The International Arbitrage: Where Traffic Per Seller Is Growing Fastest
The U.S. remains the strongest market in absolute terms. Marketplace Pulse finds revenue per seller there is more than $200,000 above the next-largest marketplace. But the U.S. is no longer where attention per seller is growing fastest.
The growth is happening elsewhere
U.S. traffic per seller grew 19% over the past year, the smallest gain among Amazon’s top ten marketplaces. Elsewhere:
- Brazil: Amazon.com.br added 36 million monthly visits while active sellers fell 23%, raising visits per seller 57%.
- Mexico: a similar gain.
- France, the Netherlands, and Poland: increases in visits per seller above 40%.
- India: comparable growth, though FDI rules largely limit the marketplace to locally registered sellers.
Special cases worth knowing
Saudi Arabia leads on traffic per seller, at 9,980 visits. Consumer demand carried over from Amazon’s 2020 Souq transition has outpaced seller adoption. Marketplace Pulse warns that the low absolute traffic ceiling limits which categories can support a real business there.
Australia is the only Amazon marketplace where the number of active sellers grew in the past year. That makes it the exception to the broader consolidation trend.
Overall, Amazon’s top ten marketplaces still account for 92% of both global traffic and active sellers, so the platform’s shape hasn’t changed. But the U.S. share of global Amazon marketplace traffic slipped from 46% to 45%, a small change that reflects much faster growth in the rest of the network.
How to evaluate an international expansion
High traffic per seller is a signal, not a decision. Before expanding, work through these questions:
- Does your category have enough absolute demand in that market, not just favorable ratios?
- What are the compliance costs? EU markets involve VAT registration, product safety rules, and packaging obligations that can outweigh the traffic advantage for small catalogs.
- Can you localize properly? Machine translation has improved, but AI assistants reading your catalog in Portuguese or Polish need accurate, specific content just as much as the U.S. assistant does.
- Does fulfillment make sense? Check whether FBA is available and affordable for your product size in the target market.
For sellers stuck in a crowded U.S. category, a well-chosen international market can offer something the U.S. increasingly doesn’t: fewer competitors per shopper.
Amazon Is Taking Units Back: The 1P Shift
One more structural change completes the picture. For the first time since Amazon started reporting the metric in 2004, the third-party share of paid units has fallen for two quarters in a row.
Third-party sellers accounted for 60% of paid units in Q1 2026, down from 61% in Q4 2025 and 62% the quarter before. It’s a small move, but after two decades of steady 3P gains, the direction is notable.
Why this matters to third-party sellers
Amazon’s first-party retail business competes with sellers for the same buy boxes, search placements, and shopper attention. Combined with Amazon Haul’s low-price push, the 1P shift suggests Amazon is actively rebalancing its catalog, and sellers should expect Amazon to compete directly in categories where it sees opportunity.
That said, the dependence runs both ways. Sellers still produce about 69% of Amazon’s GMV by Marketplace Pulse estimates. Amazon can’t replace them, but it can shape which categories stay attractive to third parties.
Reducing 1P exposure
- Own your brand and product design. Amazon’s 1P business finds it easier to compete with generic, easily sourced products than with differentiated, brand-registered ones.
- Watch your buy box share on high-volume ASINs for signs of Amazon Retail entering.
- Spread demand sources. Marketplace Pulse reports Walmart’s U.S. marketplace grew nearly 50% in Q1 of its fiscal 2027, and its ad business grew 46% in 2025. It’s still far smaller than Amazon but growing fast from a small base.
The cross-platform reality check
Diversification is harder than it sounds. Marketplace Pulse found that only one in twenty-five of Amazon’s hundred largest sellers ranks among the top 10,000 on TikTok Shop, and one in five of TikTok Shop’s top hundred ranks among Amazon’s top 10,000. Winning on one platform doesn’t carry over easily to another. Each channel needs its own skills, and sellers should budget for that instead of expecting Amazon success to transfer automatically.
A 90-Day Operating Plan for the New Shape of Amazon
The data points to a clear set of priorities. Here is how to turn them into a quarter’s work.
Days 1–30: Diagnose
- Identify your cohort. Calculate trailing four-quarter revenue and contribution margin after ads. Are you thriving, grinding, consolidating, or distressed?
- Rebuild your cash model. Include DD+7 disbursement timing, the 3.5% fuel surcharge, and your current ad payment method. Work out peak-season working capital needs.
- Rank SKUs by true profitability. Identify the bottom 20% by contribution margin and decide whether to fix, reprice, or discontinue each one.
- Run an AI shelf baseline. Ask Alexa for Shopping 20 to 30 “best X for Y” questions in your category. Note which products are recommended and whether yours are among them.
Days 31–60: Reposition
- Rewrite your top ten listings for intent. Add explicit use cases, specific differentiators, complete structured attributes, and direct answers to recurring customer questions.
- Enroll in Amazon Business and set quantity discount tiers on products businesses plausibly buy.
- Audit your AI tools. Drop or reduce anything that isn’t tied to a measurable metric. Put that time toward forecasting, pricing, or ad analysis.
- Check your price positioning. If your products compete in sub-$25 commodity lanes against factory-direct sellers or Amazon Haul, consider moving toward differentiation and higher price points.
Days 61–90: Expand carefully
- Re-run the AI shelf test and compare it with your baseline. Did the listing changes affect recommendations?
- Test Sponsored Prompts on a small budget to understand costs before competition raises them.
- Evaluate one international market using the four questions above: absolute demand, compliance cost, localization ability, and fulfillment economics.
- Set new KPIs: AI recommendation presence, B2B revenue share, and cash conversion cycle, alongside organic rank and TACoS.
Conclusion: The Math Still Works, for Fewer People and in New Places
The 2026 data on Amazon selling contains a tension that’s easy to miss. The marketplace is growing: more traffic, record e-commerce share, and an AI assistant producing billions in incremental sales. At the same time, it’s getting much harder to operate: 84,000 fewer active U.S. sellers, 47% of surveyed sellers reporting margin declines, and fewer than 8,000 sellers taking half the revenue.
Both are true because the demand hasn’t disappeared. It has moved:
- To the top tier, where ad budgets turn into rank and rank turns into lasting positions.
- To factory-direct sellers in price-sensitive middle ranks, while U.S. brands keep the higher-priced summit.
- To the AI shelf, where, for now, catalog context matters more than rank or ad spend.
- To B2B procurement, a $60 billion channel growing twice as fast as overall GMV with little seller competition for attention.
- To international marketplaces, where traffic per seller is growing two to three times faster than in the U.S.
The most actionable finding is also the most time-sensitive. Early evidence suggests Amazon’s AI assistant recommends products that search rank and ad spend don’t favor. That is one of the few places in 2026 where a mid-sized seller can appear next to or ahead of a category leader. Sponsored Prompts have already launched, ChatGPT has moved to ads, and history suggests the ad load will eventually reach this shelf too.
Sellers who study how the assistant chooses products, build intent-rich catalog data, add B2B pricing to inventory they already hold, and manage cash as carefully as margin are the ones most likely to be in the “thriving” group when the next Seller Index comes out. The rest will keep competing harder for the same clicks at higher prices.
Sources: Marketplace Pulse 2026 research and Seller Index (181 sellers, $2B+ combined revenue); Amazon Q1 2026 earnings disclosures as reported by Marketplace Pulse; Autopilotbrand.com Alexa for Shopping study (May–June 2026) as reported by Marketplace Pulse; Adobe Digital Insights; Jungle Scout Amazon Benchmark Report 2026.