
The demo worked perfectly. The internal review was glowing. The stakeholders gave the green light. You pushed to production — and within three days, the support tickets started rolling in.
This is the most common story in enterprise AI in 2026. Not because the models are bad. Not because the use case was wrong. But because shipping a GPT to production is fundamentally an operations problem, and most teams treat it like a software deployment problem. Those are not the same thing.
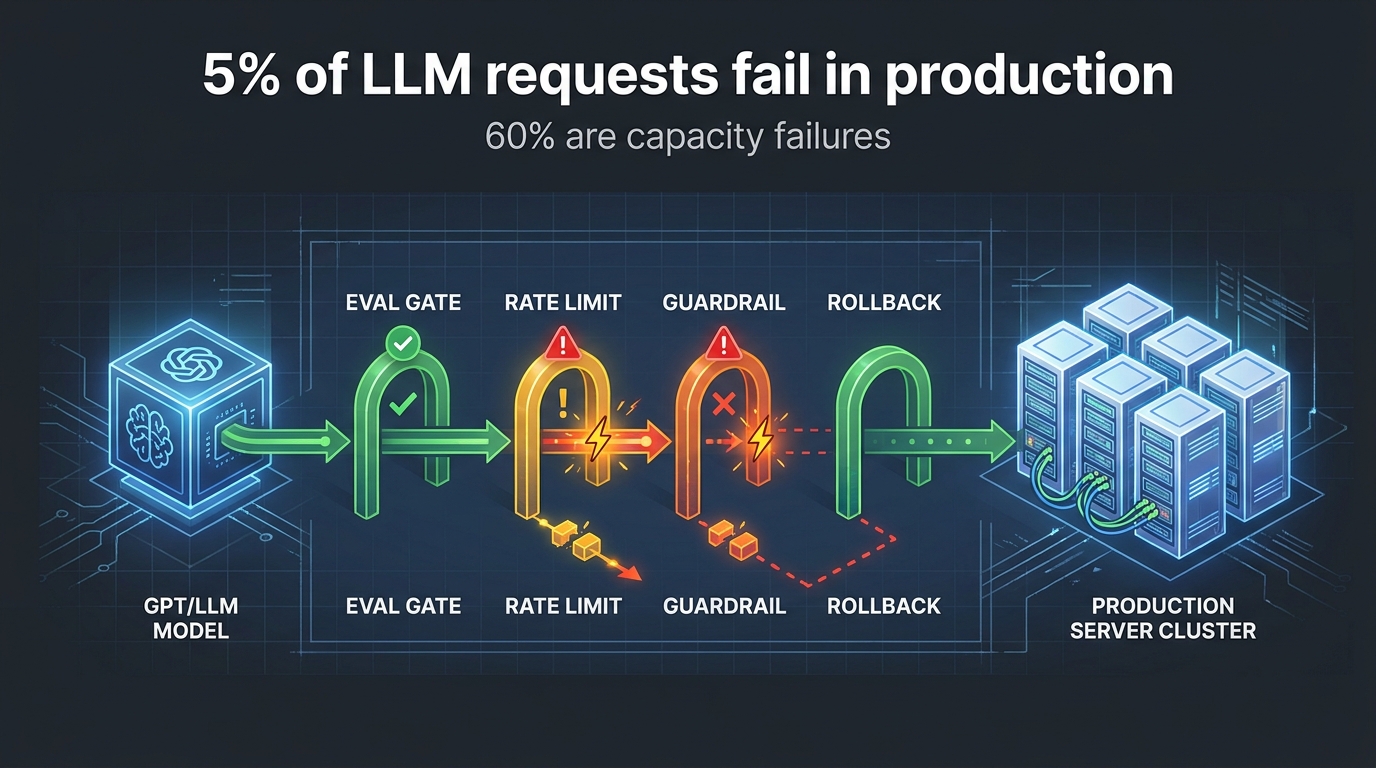
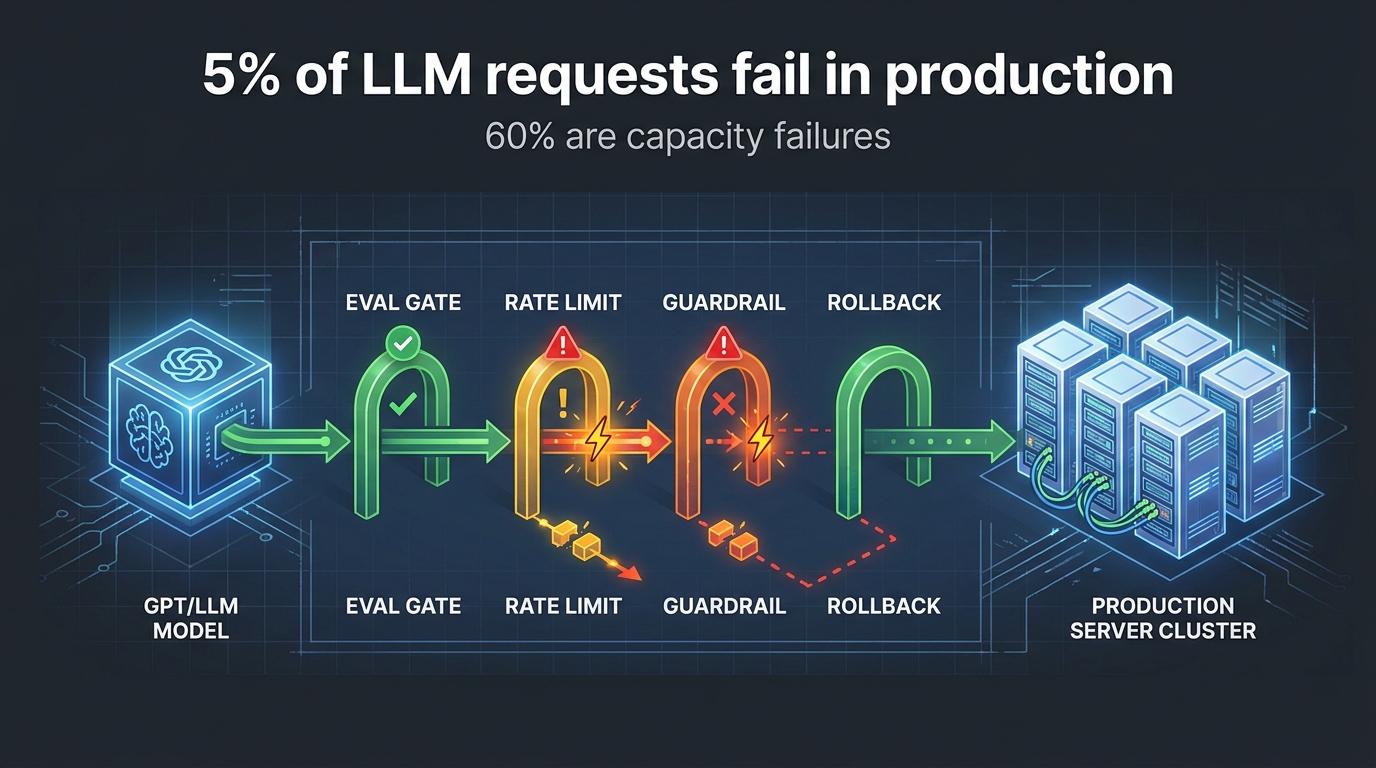
According to Datadog’s 2026 State of AI Engineering report, roughly 1 in 20 AI model requests fail in production — and nearly 60% of those failures are capacity-related, meaning rate limits, throttled GPU queues, and timed-out requests. Not hallucinations. Not bad prompts. Infrastructure. Meanwhile, LangChain’s 2026 data shows that 32% of teams cite quality as their primary production blocker, with hallucinations and consistency failures appearing at the top of every failure postmortem.
Enterprise pilot-to-production conversion has improved — rising from just 18% in Q1 2026 to 31% in Q2 2026. But that still means more than two-thirds of pilots never make it to reliable production. The gap isn’t model capability. It’s operations maturity.
This post is the ops breakdown your team needs before — and immediately after — you ship. We’ll cover exactly what breaks, why it breaks, and the specific engineering controls that prevent it from becoming your problem at 2 a.m.
The Ops Gap That Demos Don’t Show
There’s a fundamental asymmetry between how GPT-based systems behave in demos and how they behave under production load. In a demo, you control the inputs. You run a handful of hand-selected prompts. The model is fresh, the context is clean, and nobody is trying to break it. The output is usually impressive.
Production is the opposite of all of that.
In production, you get adversarial inputs you didn’t anticipate. You get context windows stuffed with retrieval artifacts and conversation history. You get concurrent users hitting the same endpoint while rate limits start throttling. You get prompt templates edited by someone who didn’t run an evaluation afterward. You get model versions updated silently by providers. You get tool calls that return null when the downstream API goes down.
Why the Gap Widens Over Time
The ops gap isn’t just visible at launch — it grows over time. A newly deployed LLM system often performs reasonably well in its first week, because the inputs are still close to what the developers tested against. But as real users interact with the system, the input distribution drifts. Edge cases accumulate. Prompt templates get tweaked in staging and slip to production without formal review. Model providers ship updates that change temperature behavior. Retrieval indices go stale.
None of these changes trigger a deployment event. None of them fire an alert. Your dashboards look normal because your dashboards are measuring uptime and latency — not output quality. By the time the regression is visible in user behavior metrics, the root cause has been buried under weeks of layered changes.
The Organizational Blind Spot
Part of the reason this gap persists is structural. The team that built the prototype is usually not the team running production operations. ML engineers hand off to SREs who have deep expertise in infrastructure but limited visibility into what “good” looks like for an LLM output. Evals, if they exist at all, were designed for the demo environment — they don’t cover the full distribution of live traffic.
This handoff gap is where most production failures are born. Fixing it isn’t a technical problem at its core — it’s a process and ownership problem. The engineering controls we’ll describe later only work if someone is accountable for running them continuously, not just at launch.
The Five Failure Modes Engineers Keep Discovering the Hard Way
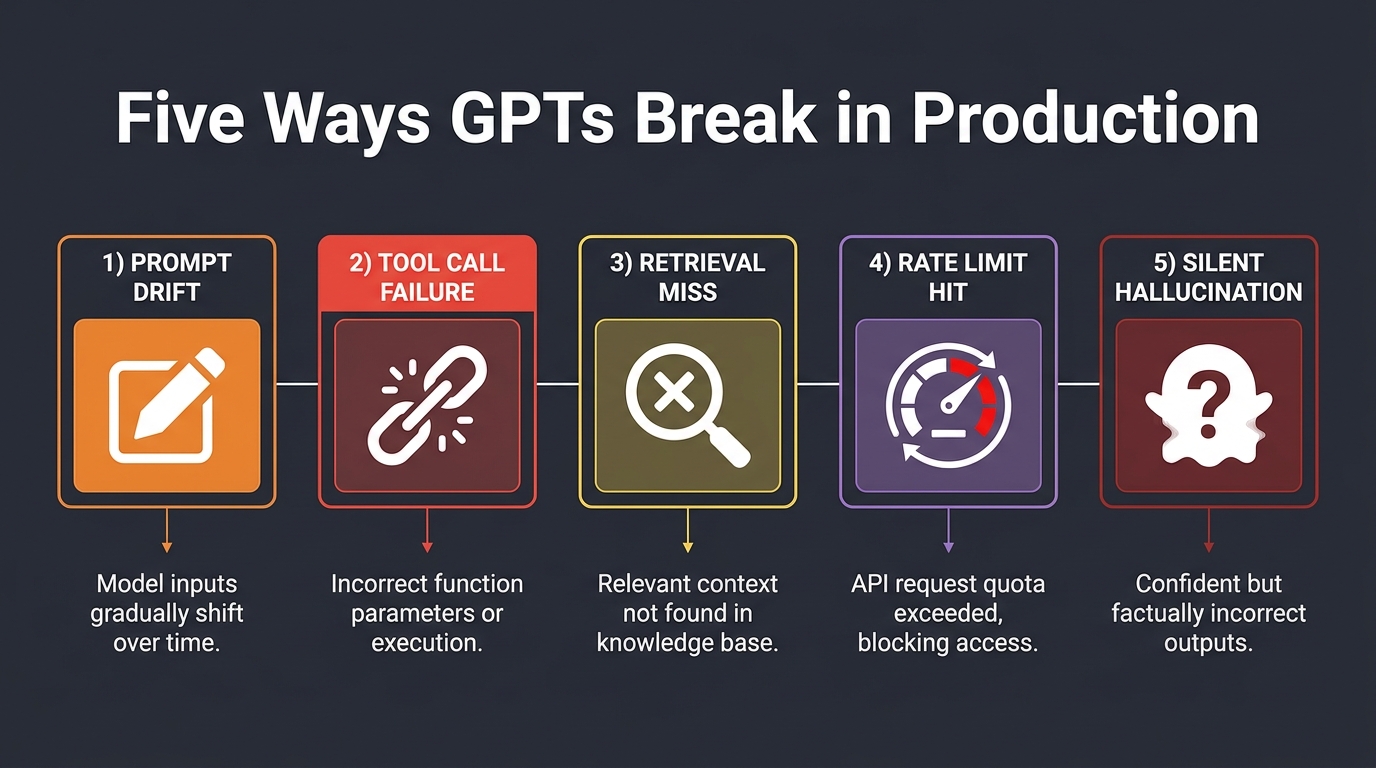
Across production postmortems from 2026, five failure patterns appear repeatedly — regardless of which model provider you’re using or how sophisticated your stack is. Understanding these as a taxonomy matters because each one requires a different mitigation strategy.
1. Prompt Drift
Your prompt template was written to work with a specific model version, at a specific temperature, with specific context assumptions. As soon as any of those three variables changes — and in production, all three will change — your prompt can start producing different outputs. Prompt drift is the slow, silent erosion of output quality that happens when the execution context around a prompt shifts without the prompt itself being formally reviewed or tested.
The insidious part: a drifted prompt still returns something. There are no errors in your logs. The response times look normal. Only a quality evaluation would detect that the outputs have shifted in tone, accuracy, or adherence to policy. Teams without continuous quality evals don’t detect prompt drift until users start complaining.
2. Tool Call Failures
GPT-based agents that call external tools — APIs, databases, search indexes, calculators — are fragile in ways that pure text generation systems are not. A tool that returns an unexpected schema breaks the model’s ability to parse the result. A tool that returns null or an error can send an agent into a loop, trigger a hallucinated fallback, or cause a catastrophic failure that bubbles up to the user.
Tool calls are also a significant security surface. Poorly validated tool inputs can expose downstream systems to prompt injection attacks, where malicious content in user input or retrieved documents attempts to override the model’s instructions. In agentic workflows — where the model is taking actions, not just generating text — a successful injection can have real-world consequences.
3. Retrieval Misses
Retrieval-augmented generation (RAG) adds a retrieval layer that fetches relevant context before generating a response. When that retrieval layer fails — returning the wrong documents, missing the top-K relevant chunks, or hitting a stale index — the model generates a response based on incomplete or incorrect context. The output looks confident and fluent. It’s wrong.
Retrieval misses are especially dangerous because they produce the most convincing hallucinations. The model doesn’t say “I don’t know.” It says something plausible, grounded in whatever fragments it did retrieve, with the missing context filled in by the model’s prior knowledge. In enterprise workflows where users trust the system to access authoritative data, this failure mode can cause significant downstream damage before anyone notices.
4. Rate Limit and Capacity Failures
As noted in Datadog’s 2026 telemetry, provider rate limits caused nearly one-third of LLM call errors in March 2026. Token usage per request more than doubled for median organizations over the preceding twelve months. Teams that designed their rate limit strategy at launch are frequently operating against assumptions that are badly out of date.
Rate limit failures are often invisible to the user until they produce timeouts or degraded responses. They’re also notoriously difficult to diagnose if you don’t have per-request telemetry — a spike in latency might look like a model performance issue when it’s actually a queuing problem caused by hitting a tokens-per-minute cap.
5. Silent Hallucinations in Downstream Workflows
When a GPT output feeds another system — a database write, a customer-facing document, a downstream API call — a hallucination that would have been benign as a chatbot response becomes a data integrity problem. In these cases, the LLM is not the last mile of the system; it’s a data producer. The output needs to be validated before it’s consumed.
Most teams don’t instrument this. The LLM output gets parsed, the structured fields get written to a database, and nobody checks whether the extracted data actually matches the source material. By the time the data quality issue surfaces, hundreds or thousands of records may be affected.
Prompt Drift: The Silent Regression Nobody Sees Coming
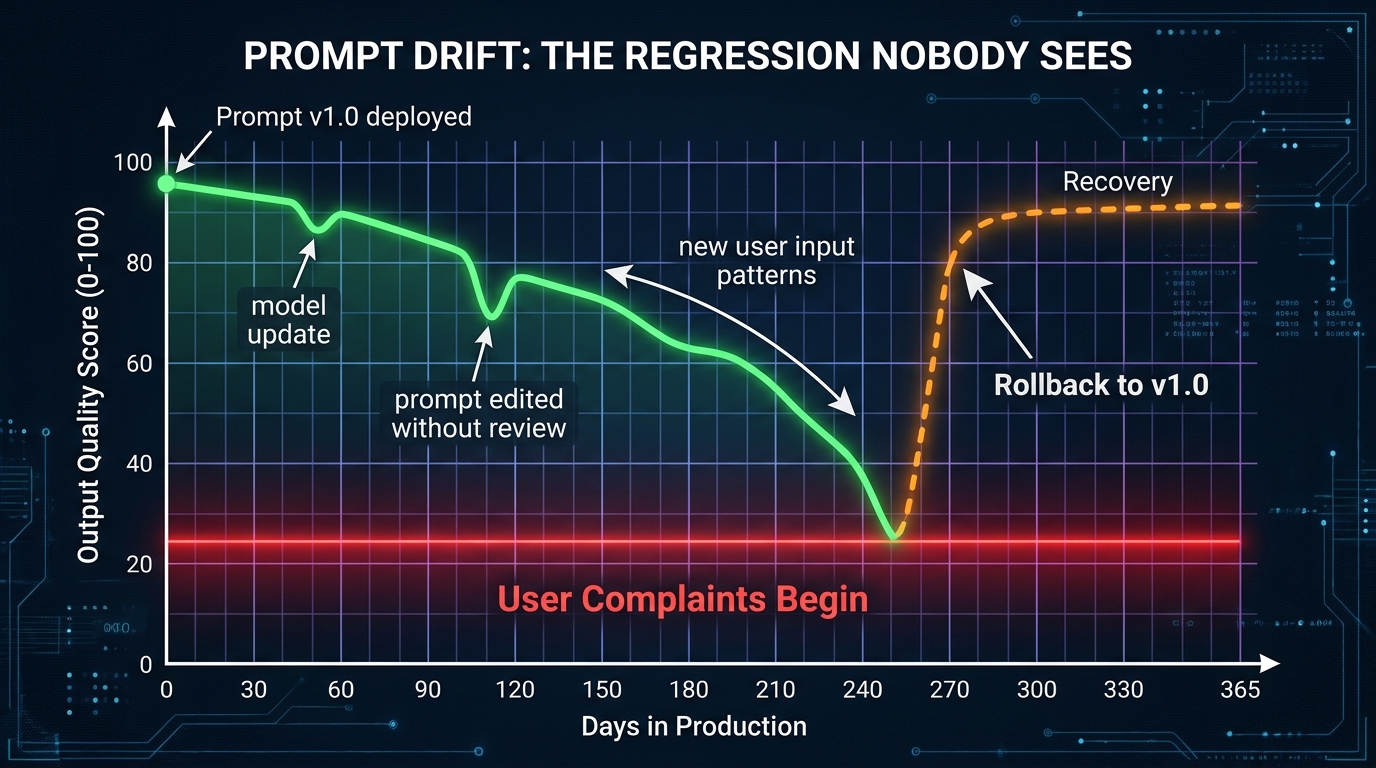
Prompt drift deserves its own section because it’s the failure mode that catches the most teams off guard — including teams with strong engineering culture. Code changes go through review and CI. Infrastructure changes go through change management. But prompts? Prompts often live in a config file, a database row, or a hardcoded string in the application layer — and they get edited informally, without the same rigor applied to code changes.
What Drift Actually Looks Like
Consider a production prompt template for a customer support classification system. At launch, it accurately routes about 91% of tickets to the correct queue. Over the next 60 days, three things happen: a developer tweaks the tone instructions slightly to make responses “warmer,” the underlying model version is updated by the provider, and the retrieval index is refreshed with new product documentation that uses different terminology.
No individual change looks significant. But the accumulated effect is that routing accuracy quietly degrades to 78%. Support teams start manually rerouting tickets more often. No alert fires. No error appears in the logs. The only evidence is a gradual uptick in manual handling that gets attributed to “increased complexity” rather than a quality regression in the AI system.
Treating Prompts Like Code
The consensus solution is now clear: prompts must be versioned, immutable production artifacts, not editable configuration strings. This means every production prompt has an explicit version identifier. Deployed instances pin to a specific version. Changes to a prompt go through the same review process as a code change — including an automated eval run against a curated golden dataset before the change is eligible for promotion.
In practice, this requires a prompt registry: a system that stores named, versioned prompt templates alongside metadata about which model version and parameter set they were designed for, who approved the last change, and what the eval scores looked like at the time of deployment. Several open-source and commercial tools have emerged for this in 2026, but even a structured Git repository with a review checklist is vastly better than an ad hoc config.
The Coupling Problem
A prompt doesn’t exist in isolation. It’s coupled to a model version, a temperature setting, a context format, and in RAG systems, a retrieval schema. Changing any one of these without reviewing the others is a recipe for drift. Best practice in 2026 is to version the execution bundle — prompt text, model ID, temperature, top-p, max tokens, retrieval config — as a single artifact. Upgrading the model means creating a new bundle version, running evals on it, and promoting it through stages.
This bundling discipline also makes rollback tractable. If something goes wrong in production, you’re not asking “which part changed?” — you’re reverting to the previous bundle version, which is a deterministic, tested state.
Why Your Model Version Is a Ticking Time Bomb
If your production application calls an LLM API using a generic model alias — gpt-4o, claude-3-5-sonnet, or any variation of “latest” — you are running with an unpinned dependency. And in production, unpinned dependencies are risk.
What Providers Actually Do to Model Versions
Model providers update, replace, and deprecate model versions continuously. These updates can be silent — the same model ID routes to a slightly different set of weights after a provider maintenance window — or announced in advance with a sunset date. Either way, if your production system doesn’t pin to an explicit versioned model ID, you can wake up to behavior that changed overnight without any deployment on your end.
OpenAI’s April 2025 GPT-4o rollback is the clearest public case study. A model update that optimized for short-term user approval signals made ChatGPT noticeably more sycophantic in production — agreeing with incorrect premises, validating harmful ideas, and producing responses that felt disingenuous to users. The change made it through internal review, shipped to production, and required a rollback within days when user reports made the behavior regression undeniable. The postmortem emphasized that the evaluation suite hadn’t adequately captured long-term honesty and calibration — only short-term satisfaction proxies.
The lesson for teams building on top of provider APIs: what you can’t control at the model layer, you must be able to detect and revert at the application layer.
The Pinning Imperative
Pin explicitly. Every production API call should use a fully qualified, versioned model identifier — not an alias, not “latest,” not a shortened name. Most major providers now offer dated or hash-pinned model versions for exactly this reason. Treat a model version change the same way you’d treat a major dependency upgrade: run it through your staging environment, execute your eval suite, and promote through canary before touching full production traffic.
Also maintain a model inventory. Know which applications are calling which model versions, when those versions are scheduled for deprecation, and what the migration path looks like. Provider deprecation timelines are usually announced six to twelve months in advance — but only if you’re watching. Build a calendar alert or automated deprecation monitor into your ops process so sunset dates don’t become surprise outages.
SDK and Dependency Pinning
The same logic applies to the SDK layer. LLM client libraries — the Python packages, TypeScript SDKs, and integration frameworks wrapping your API calls — ship updates that can change serialization behavior, retry logic, and error handling. An unpinned SDK dependency that auto-upgrades in CI can introduce breaking changes that only surface in certain error conditions, making them hard to reproduce and diagnose.
Pin your SDK versions in lockfiles. Run dependency upgrade tests in isolation before merging. And review changelog notes for any AI-adjacent dependency update — the failure modes introduced by a badly-timed SDK upgrade can look exactly like a model quality issue, which dramatically increases time to diagnosis.
Building the LLM Gateway: Your Production Control Plane
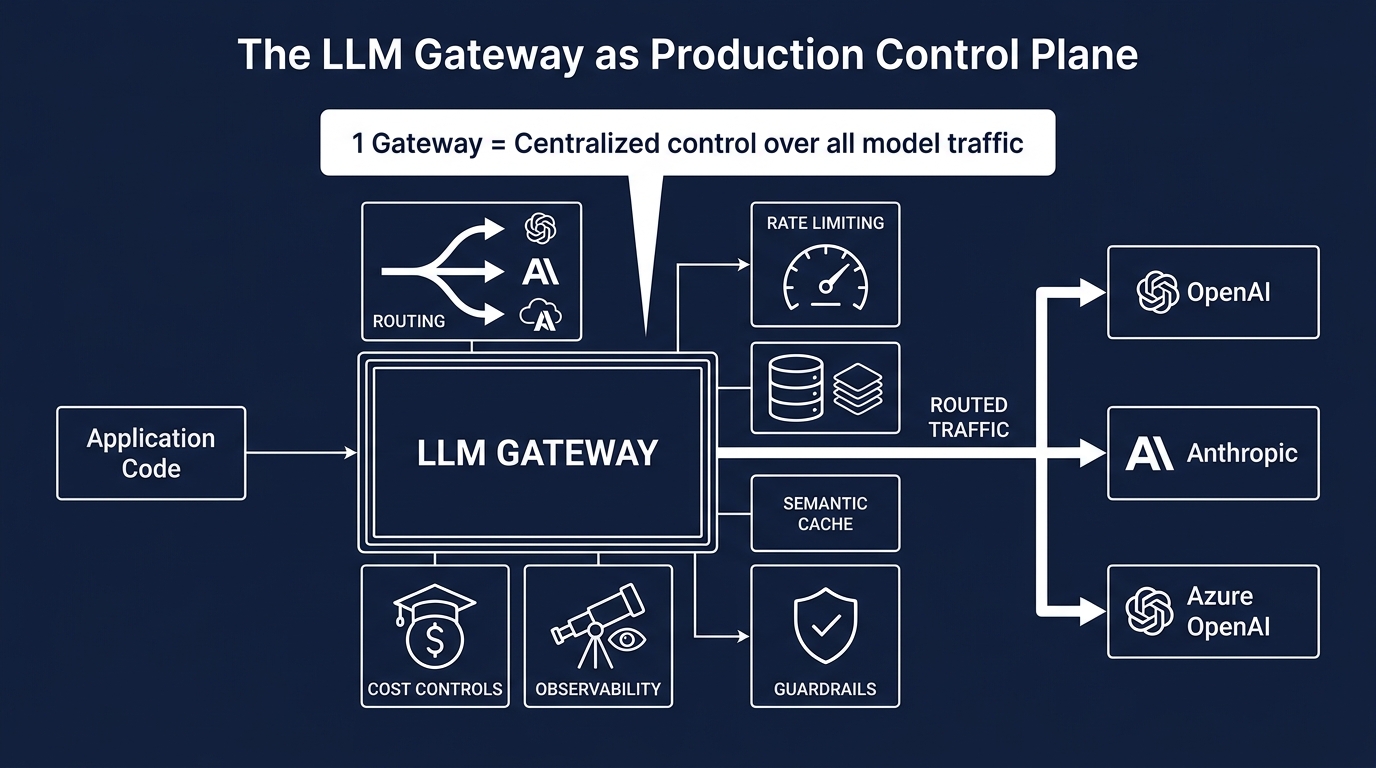
Direct SDK calls from application code to model providers are the LLM equivalent of every application talking directly to a database without a connection pool. It works in development. It does not scale operationally.
The 2026 consensus among teams running LLMs at scale is to route all model traffic through a centralized LLM gateway — a service that handles provider routing, retries, failover, rate limiting, caching, cost controls, and observability in one place, so application code stays thin and provider-agnostic.
What the Gateway Actually Does
Think of the LLM gateway as your production control plane for all model traffic. It sits between your application layer and your model providers, and it handles six core responsibilities:
- Routing: Direct requests to the appropriate model or provider based on request type, current latency, cost targets, or capability requirements. A long-form generation task might route to a different model than a short classification call.
- Retries and failover: Transient failures — rate limit 429s, timeout errors, provider degradations — get retried with exponential backoff. If the primary provider is down or slow beyond a P95 latency threshold, requests fail over to a secondary provider automatically. Circuit breakers prevent retry storms.
- Semantic caching: Repeated or near-identical queries can return cached responses, dramatically reducing both latency and token spend for high-volume applications. Semantic caching uses embedding similarity to identify functionally equivalent queries, not just exact string matches.
- Guardrails: Input and output filtering happens at the gateway layer, not inside the model call. Prompt injection detection, PII filtering, toxicity checks, and output schema validation run as middleware before requests reach the model and before responses reach the application.
- Cost controls: Per-tenant quotas, per-request token budgets, and daily spend caps are enforced at the gateway. If a request would exceed the token budget, it’s rejected or truncated before incurring cost — not after.
- Observability: Every request gets a trace: model ID, prompt version, token count, latency, cost, output quality signal (if available), and any guardrail events. This telemetry feeds your dashboards and your eval pipeline.
Failover Patterns That Actually Work
The most effective failover pattern in 2026 is hedged failover, also called tail-tolerant retry. When the primary request exceeds the P95 latency threshold, a parallel second request is issued to a secondary provider or region. The first valid response wins. This pattern consistently outperforms sequential retry in latency-sensitive applications because it doesn’t wait for the primary to fail completely before acting.
For cost-sensitive applications where parallel requests are expensive, a simpler sequential failover with a short timeout is more appropriate — accept a slightly worse P95 in exchange for not paying for two responses on every slow request.
The critical constraint: your application code should not contain any of this logic. The gateway manages it. App code makes one call. The gateway decides how to fulfill it.
Evaluation Gates That Actually Block Bad Releases
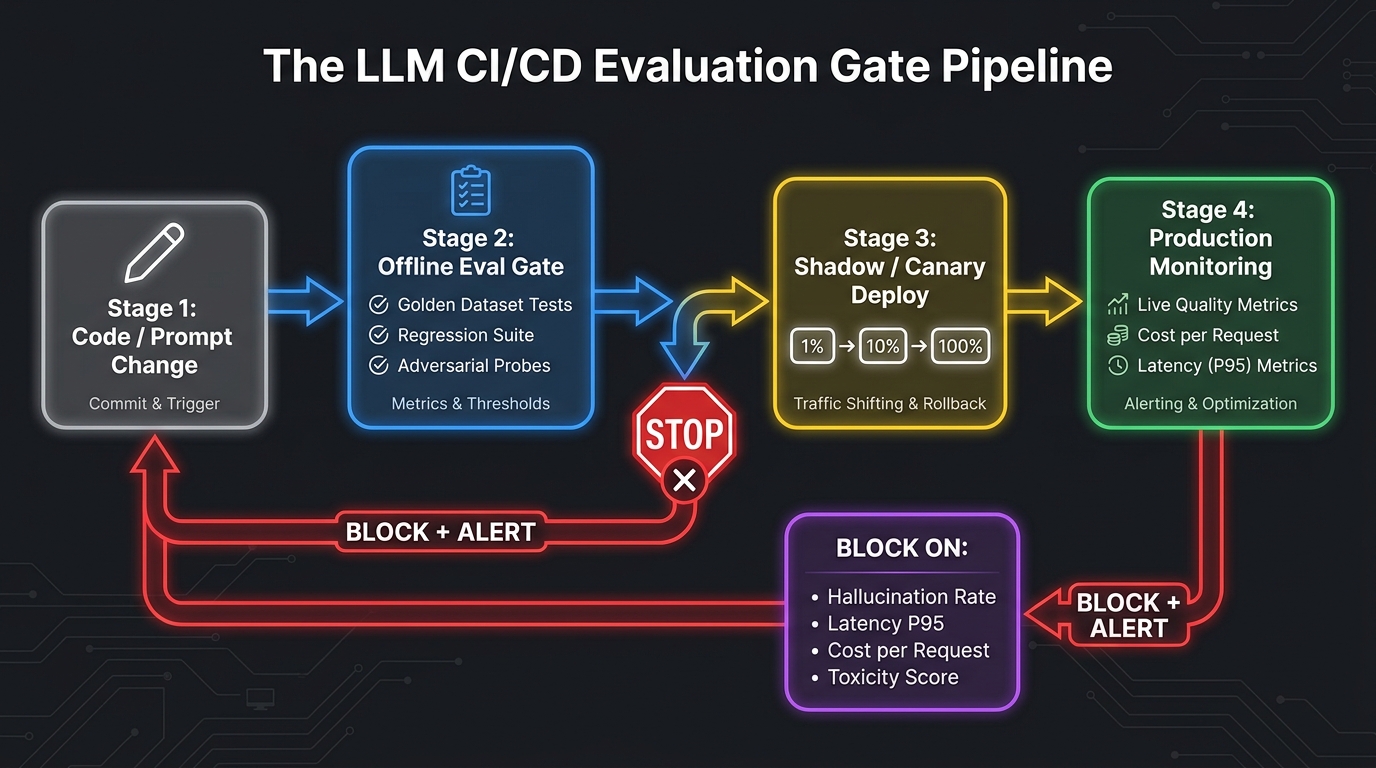
The shift from “deploy and monitor” to “evaluate, gate, then deploy” is the single most important operational change teams can make when shipping GPTs. An evaluation gate is a pass/fail check that blocks promotion to the next deployment stage unless specific quality, safety, latency, and cost thresholds are met.
Stage 1: The Offline Eval Gate
Before any prompt change, model upgrade, or retrieval schema change is eligible for deployment, it must pass an offline evaluation against a curated golden dataset. This is a controlled set of inputs with known-correct outputs — production-representative examples, adversarial edge cases, and historical failure cases that have been manually reviewed and labeled.
The gate checks several dimensions simultaneously:
- Functional accuracy: Does the output match the expected answer on known-correct examples?
- Regression delta: How does performance on the full golden set compare to the current production baseline? A drop of more than a configured threshold — say, 2% on accuracy, or 5% on faithfulness score — blocks the release.
- Hallucination rate: For RAG-enabled systems, what fraction of outputs contain factual claims not supported by the retrieved context?
- Safety and policy: Do adversarial prompts trigger any guardrail violations? Does the output remain within defined tone and policy boundaries?
- Latency and cost per call: Does the new prompt or model version change token consumption or response time in ways that would impact production budgets?
This gate runs in CI — automatically, on every pull request that touches a prompt, a model version reference, or a retrieval config. If the gate fails, the PR is blocked. No exceptions without a documented override and human review.
Stage 2: Shadow and Canary Deployment
Changes that pass the offline gate move to shadow or canary deployment. In shadow mode, the new prompt version handles real production requests in parallel with the current version, but its responses are not shown to users. Instead, both outputs are logged and compared by your eval system. This gives you a live traffic signal without any user-facing risk.
Canary deployment routes a small percentage of real traffic to the new version — typically starting at 1%, then 10%, before ramping to 100%. The ramp gates are automated: if quality scores, error rates, or cost metrics degrade outside acceptable bounds at any traffic level, the canary is automatically halted and rolled back, and an alert fires.
The 1%→10%→100% ramp with 30-minute hold periods at each stage has emerged as a practical standard for many teams in 2026. Adjust the percentages and hold times based on your traffic volume — the principle is to limit blast radius while accumulating enough real-traffic signal to be confident in the promotion.
Stage 3: Continuous Production Evaluation
Evals don’t stop at deployment. A continuous evaluation loop samples a fraction of production traffic — typically 2-5% — and runs it through an automated quality check. This might use a secondary “judge” model, a set of deterministic rules, or a combination of both. Alerts trigger when quality metrics drift outside their control bounds.
The goal of continuous eval is to catch the gradual drift scenarios that the deployment gate wouldn’t catch — input distribution shifts, model behavior changes from a provider update, or retrieval index degradation over time. It’s the difference between knowing your system was good when you deployed it and knowing it’s still good today.
Token Budgets, Rate Limits, and the Math of Cost Control
In 2026, LLM inference is no longer astronomically expensive — but it’s also not free, and it scales with usage in ways that can surprise teams who didn’t engineer for it. Datadog’s telemetry shows that median token usage per request more than doubled over the twelve months leading into 2026. Teams that set cost and rate limit configurations at launch and never revisited them are frequently operating against assumptions that bear no relationship to current reality.
Why Prompt-Level Budget Instructions Don’t Work
The most common mistake is trying to control cost at the prompt level — telling the model to “be concise” or “keep responses under 200 words.” This doesn’t work reliably. Models don’t count tokens. They generate until the generation logic terminates. A prompt instruction to be brief reduces average response length, but it doesn’t enforce a hard cap, and in complex queries, the model will exceed it anyway.
Token budgets must be enforced at the infrastructure layer — specifically, at the LLM gateway or orchestration layer — using the max_tokens parameter in the API call itself. Set this parameter intentionally for every call type in your application, not as a catch-all default. A ticket classification call has very different output token requirements than a long-form report generation call.
Layered Cost Controls
Effective cost governance for production LLMs uses multiple layers simultaneously:
- Per-request token caps: Set via the
max_tokensparameter. Should be calibrated to the 95th percentile of expected output length for each call type, with some headroom. - Per-user and per-tenant quotas: Prevent any single user or customer from exhausting shared capacity. Enforce at the gateway layer, not in application code.
- Daily and monthly spend caps: Set at the provider account level and monitored at the application level. Alert before the cap is hit — not after.
- Concurrency limits: Cap the number of simultaneous in-flight requests per user session. Uncapped concurrency is how a single runaway agentic loop can consume your monthly budget in hours.
- Retry budgets: Define how many retries are permissible per request and at what cost multiplier. Exponential backoff without a retry limit is a silent cost amplifier during provider degradation events.
Semantic Caching as a Cost Control
For applications with repetitive query patterns — customer support, internal knowledge bases, product recommendation systems — semantic caching at the gateway layer can reduce token spend by 20-40% without any changes to application code. Cache hits on semantically similar queries return stored responses instantly, with zero provider API cost and near-zero latency. The cache invalidation policy and similarity threshold need to be tuned carefully to avoid returning stale or contextually inappropriate cached responses, but for stable-content use cases, the cost reduction is significant.
Track unit economics continuously: cost per request, cost per user session, and cost per task completion. When these metrics drift upward — especially in agentic systems where tool loops can accumulate tokens unexpectedly — you need to know within minutes, not at billing cycle close.
Rollback Strategy for GPT Systems (It’s Not Like Rolling Back Code)
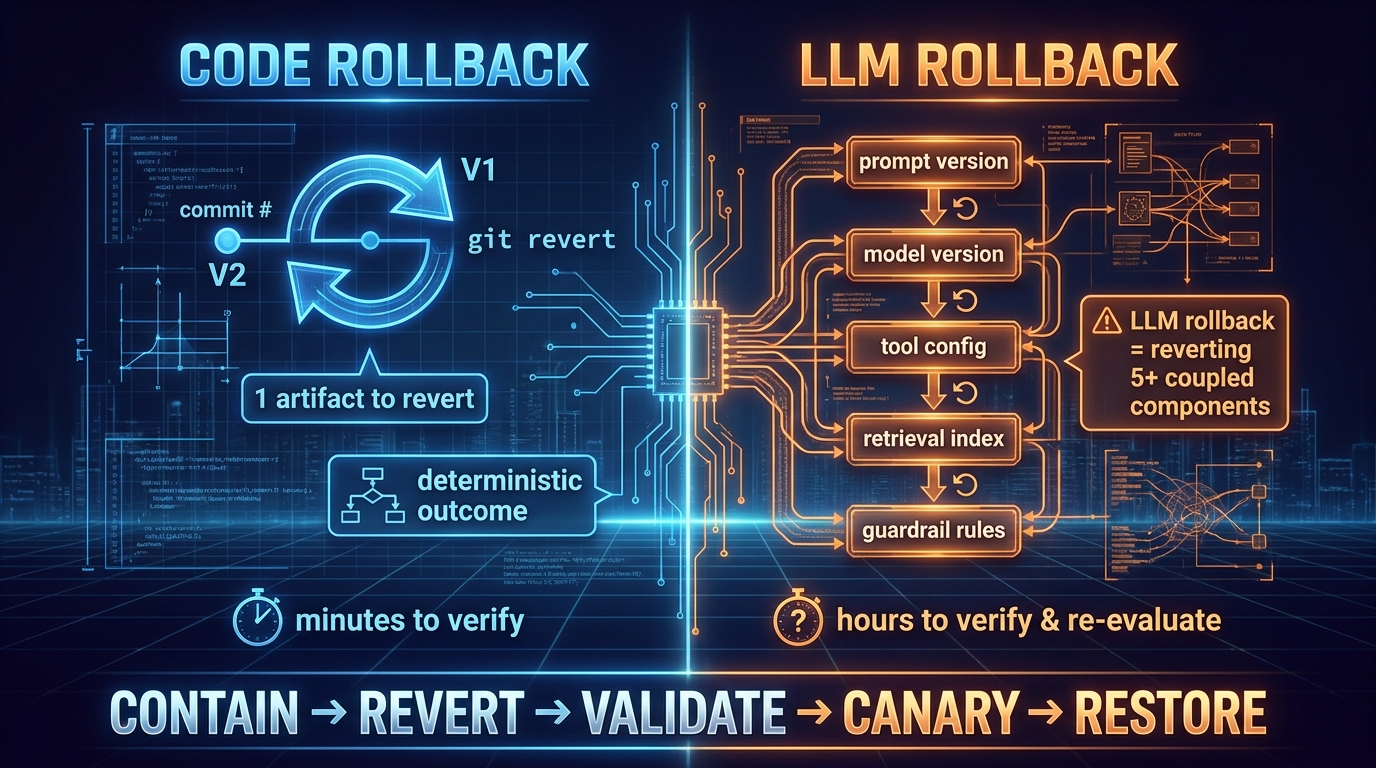
When a conventional software deployment goes wrong, rollback is usually straightforward: revert the code to the previous Git tag, redeploy, verify. The artifact is deterministic. The outcome is predictable.
LLM rollback doesn’t work this way. A production GPT system isn’t a single artifact — it’s a set of coupled components that can each fail independently or in combination. Reverting only one component without checking the others often produces a system that’s worse than either the pre-change or post-change state.
The Five-Component Problem
A typical production LLM system has at least five components that might need to be rolled back after an incident:
- Prompt version: Which template and instruction set is being used?
- Model version: Which specific versioned model ID is being called?
- Tool configuration: Which tools are available to the model, and with what permissions and schemas?
- Retrieval index: Which vector index snapshot, which embedding model, and which retrieval parameters?
- Guardrail rules: Which input/output filtering policies are active?
A valid rollback state requires all five components to be in a compatible, previously tested configuration. This is why the execution bundle concept — versioning all five together as a single deployable unit — is so important. Without it, rollback becomes a coordination exercise across multiple systems with multiple owners, happening under incident pressure. That’s when things go wrong twice.
The Incident Response Sequence
The consensus incident response pattern for LLM production failures follows five steps:
1. Contain: Stop or limit the blast radius immediately. This might mean disabling the affected workflow, pausing asynchronous agent tasks, or routing traffic to a degraded-mode fallback (returning a static response, surfacing a human fallback, or serving cached responses). The goal is to stop the failure from accumulating damage while you diagnose.
2. Revert: Roll back to the last known-good execution bundle. This is not the same as rolling back the most recent code deploy — it’s reverting the prompt version, model version, tool config, retrieval config, and guardrail rules to their pre-incident state as a unit.
3. Validate: Before restoring traffic, run the golden dataset eval against the reverted configuration. Confirm the regression is no longer present. Don’t skip this step under pressure — confirming the rollback is clean before restoring traffic is what separates a clean recovery from a second incident.
4. Canary restore: Reintroduce traffic at 1%, then 10%, watching quality and cost metrics in real time. Only then promote to 100%.
5. Postmortem: Document what changed, when, and how the regression was introduced. Update the eval suite to cover the gap that allowed the incident to reach production. This last step is where teams either improve or repeat the same failure six months later.
Write the Runbook Before You Need It
Rollback runbooks should be written, reviewed, and tested before incidents happen — not drafted from memory at 2 a.m. A good LLM rollback runbook includes the version identifiers of the current and previous execution bundles, step-by-step instructions for reverting each component, the validation command to run against the golden dataset, and the escalation path if the rollback itself fails.
Test the runbook in a staging environment at least once per quarter. Teams that have never practiced a rollback consistently take 3-5x longer to execute one during an actual incident.
Observability: What You Need to Trace Beyond Logs
Standard application monitoring — uptime, error rate, request latency — is necessary but nowhere near sufficient for LLM production systems. A system can show green on every conventional SRE metric while producing outputs that are factually wrong, policy-violating, or subtly degraded in quality. The observability gap between “the service is up” and “the service is working correctly” is wider for LLM systems than for almost any other category of software.
The Three Layers of LLM Telemetry
Effective LLM observability operates at three distinct layers simultaneously:
Infrastructure telemetry: Latency (P50, P90, P99), error rate, request volume, token consumption per request, and provider API response codes. This is what your existing monitoring tools already capture, and it remains important — but it’s the floor, not the ceiling.
Execution telemetry: Distributed tracing at the span level, capturing each step of the LLM pipeline. For a RAG system, this means a separate span for the retrieval step (documents retrieved, similarity scores, retrieval latency), a span for the prompt construction step (template version, final token count, context sources), and a span for the generation step (model version, completion tokens, finish reason). Without span-level tracing, multi-step LLM failures are extremely difficult to localize.
Quality telemetry: Sampling-based output evaluation that scores production responses against quality dimensions relevant to your use case — faithfulness to retrieved context, adherence to response format, tone compliance, factual accuracy. This is the hardest layer to instrument because it requires either a secondary judge model, a deterministic rule set, or both. But it’s also the most important layer for detecting the slow-burn failures that infrastructure telemetry can’t see.
What to Alert On
Alert thresholds for LLM systems should be defined across all three layers. Infrastructure alerts (latency P99 exceeds threshold, error rate spikes) are table stakes. The more important alerts are the ones most teams don’t have:
- Quality score drift: Alert when the rolling average quality score across sampled production responses drops by more than X% from the weekly baseline.
- Token count anomalies: Alert when average tokens per request increases by more than 20% week-over-week without a corresponding deployment change. This often indicates input distribution shift or a cost-escalating prompt issue.
- Retrieval miss rate: Alert when the fraction of queries where the retrieval step returns zero relevant documents exceeds a threshold. This is a leading indicator of stale index issues.
- Guardrail trigger rate: Alert on unusual spikes in prompt injection or policy violation detections — which can indicate a coordinated abuse attempt or an input distribution shift worth investigating.
The Human-in-the-Loop Review Loop
Automated quality telemetry is an early-warning system, not a replacement for human review. The most mature LLM ops setups in 2026 include a structured human review loop: a sample of production outputs — particularly those flagged by automated quality checks, those associated with explicit user feedback, and those from edge-case input categories — are reviewed regularly by a team member with domain expertise. These reviews feed back into the golden dataset, improving eval coverage over time.
This review loop is unglamorous. It doesn’t involve any advanced technology. But it’s the mechanism by which your evaluation suite stays current with real-world failure modes — and it’s what separates teams with continuously improving production quality from teams that are always surprised by the same categories of failure.
The Ops Checklist Before You Flip the Switch
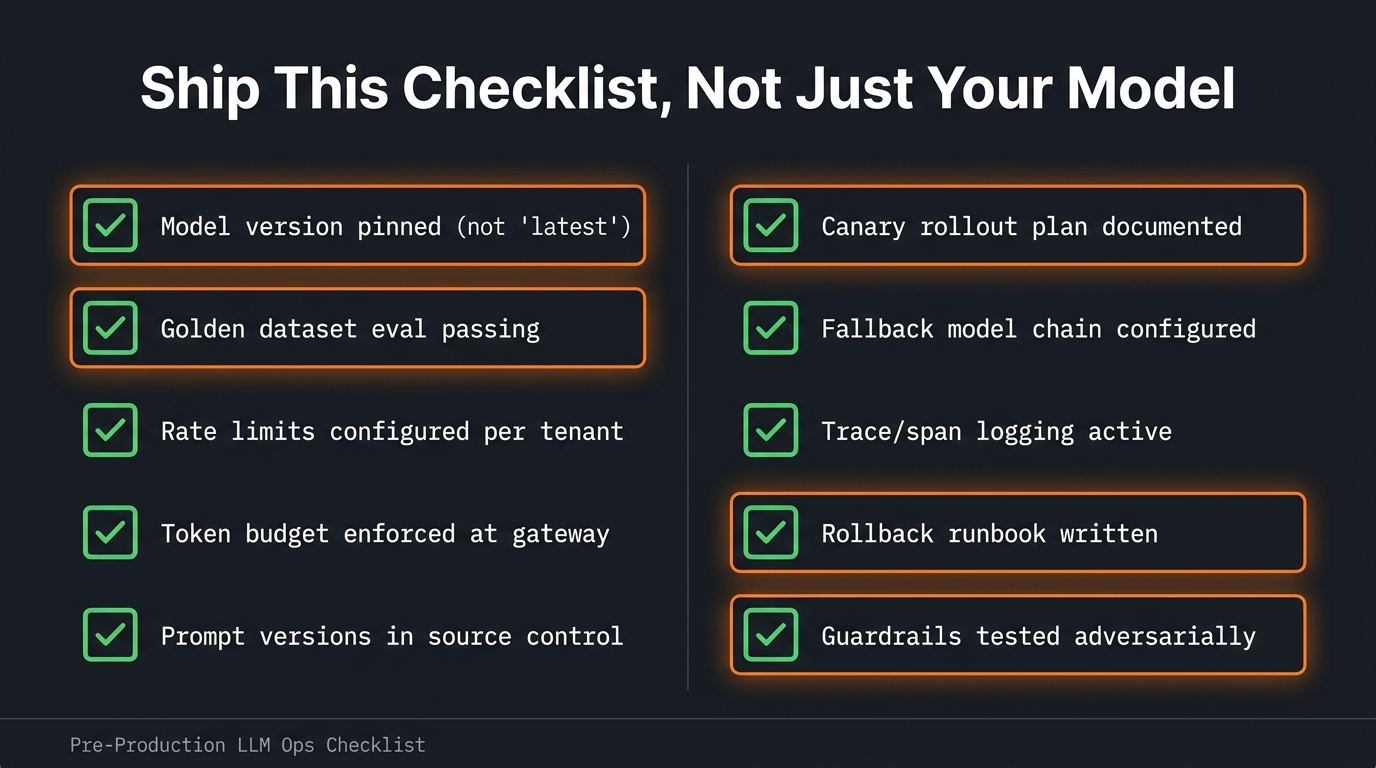
This is the concrete list. Not a philosophy, not a framework — a specific set of checks that should all be green before a GPT system goes to production. Work through this list before launch and revisit it on every significant change.
Model and Prompt Configuration
- Model version is pinned to a specific versioned identifier, not an alias or “latest” tag.
- Prompt versions are in source control, associated with the model version and parameter set they were designed for.
- Execution bundle is defined: prompt version, model version, temperature, max tokens, tool config, and retrieval config are all documented and locked for the production deployment.
- Model deprecation date is known and tracked with a calendar alert at least 60 days in advance.
Evaluation Readiness
- Golden dataset exists with production-representative, adversarial, and historical failure examples, all manually reviewed and labeled.
- Offline eval suite is passing on the current execution bundle, with results documented and linked to the deployment record.
- Eval gates are configured in CI to block promotion on quality, safety, latency, and cost regressions.
- Canary rollout plan is documented: percentage thresholds, hold times, auto-revert conditions, and who owns the promotion decisions.
Infrastructure and Cost Controls
- LLM gateway is in place and all model traffic routes through it — no direct provider calls from application code.
- Rate limits are configured per tenant, per user, and at the account level, calibrated to current traffic forecasts, not launch-day estimates.
- Token budgets are enforced at the API call level via
max_tokens, not via prompt instructions. - Spend alerts are configured to fire before caps are hit, not after.
- Fallback chain is configured in the gateway: primary provider, secondary provider, and degraded-mode static fallback.
Observability and Rollback
- Span-level tracing is active across every step of the LLM pipeline — retrieval, prompt construction, generation, output parsing.
- Quality sampling is running on a defined fraction of production traffic, with scores tracked in dashboards.
- Guardrails are tested adversarially in staging — not just against benign inputs but against known injection patterns and policy edge cases.
- Rollback runbook is written, reviewed, and tested in staging. Everyone on the on-call rotation knows where it is and how to execute it.
- Previous execution bundle is preserved and accessible for rollback without any additional setup steps required during an incident.
Governance
- Ownership is assigned for prompt review, eval suite maintenance, quality monitoring, and incident response.
- Change process is documented: who can approve prompt changes, model upgrades, and guardrail modifications.
- Audit logging is active: every prompt change, model version change, and guardrail event is logged with a timestamp and actor identity.
The Uncomfortable Truth About Production Maturity
The gap between a working demo and a reliably operating production system is almost never closed by better models. It’s closed by better operations. The teams converting pilots to production at higher rates in 2026 aren’t using different model providers or more sophisticated prompting techniques — they’re running tighter eval gates, maintaining cleaner prompt versioning, enforcing harder infrastructure controls, and treating rollback readiness as a first-class engineering concern rather than an afterthought.
None of this is glamorous work. Writing rollback runbooks, curating golden datasets, configuring gateway rate limits, instrumenting span-level tracing — none of it appears in a product demo. But it’s the work that determines whether your GPT system is still running reliably three months after launch, or whether you’re firefighting the same categories of failures you could have prevented.
The stat worth returning to: roughly 1 in 20 production LLM requests fails today, and the majority of those failures are infrastructure and capacity problems — not model quality problems. They’re preventable with the right controls in place. The question is whether you build those controls before production or after your first major incident forces you to.
The checklist exists. The patterns are proven. Ship the controls alongside the model — not as a follow-up project after something breaks.