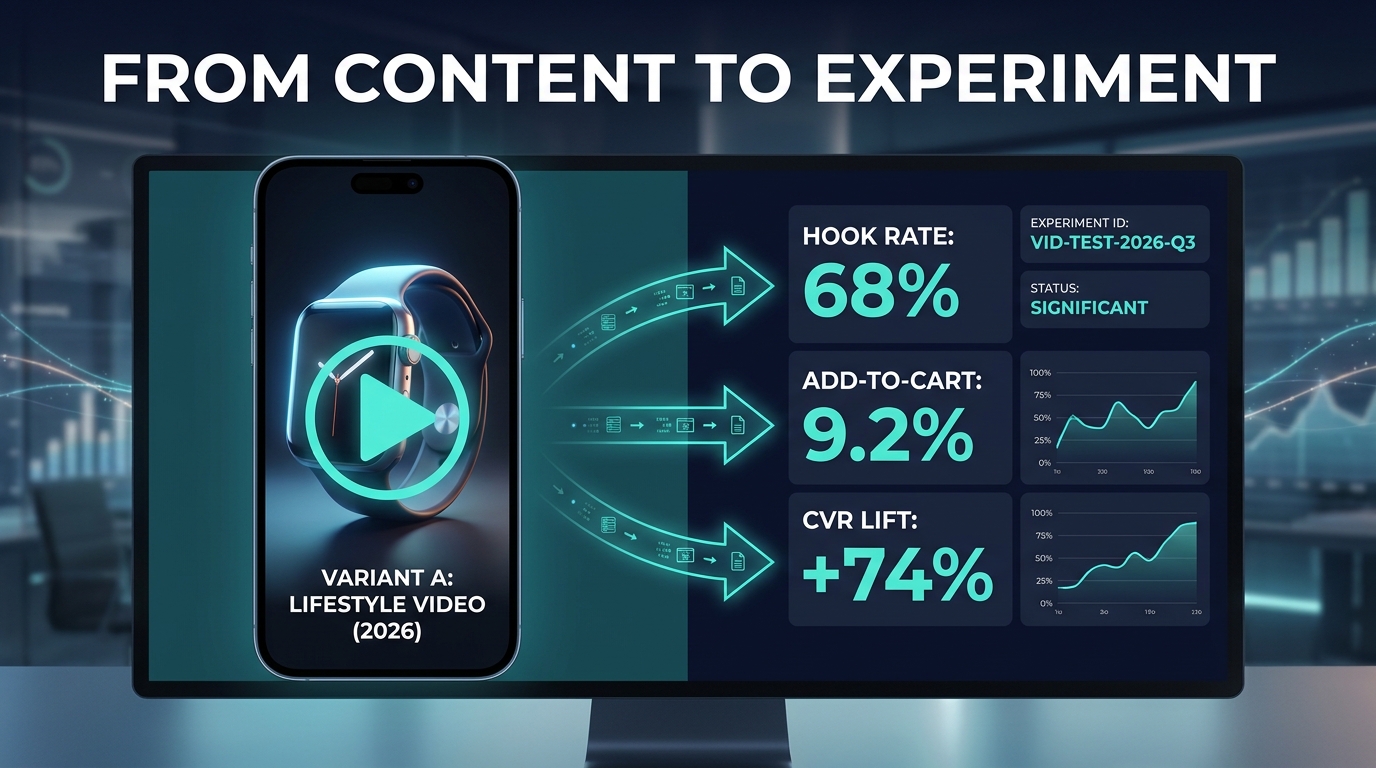

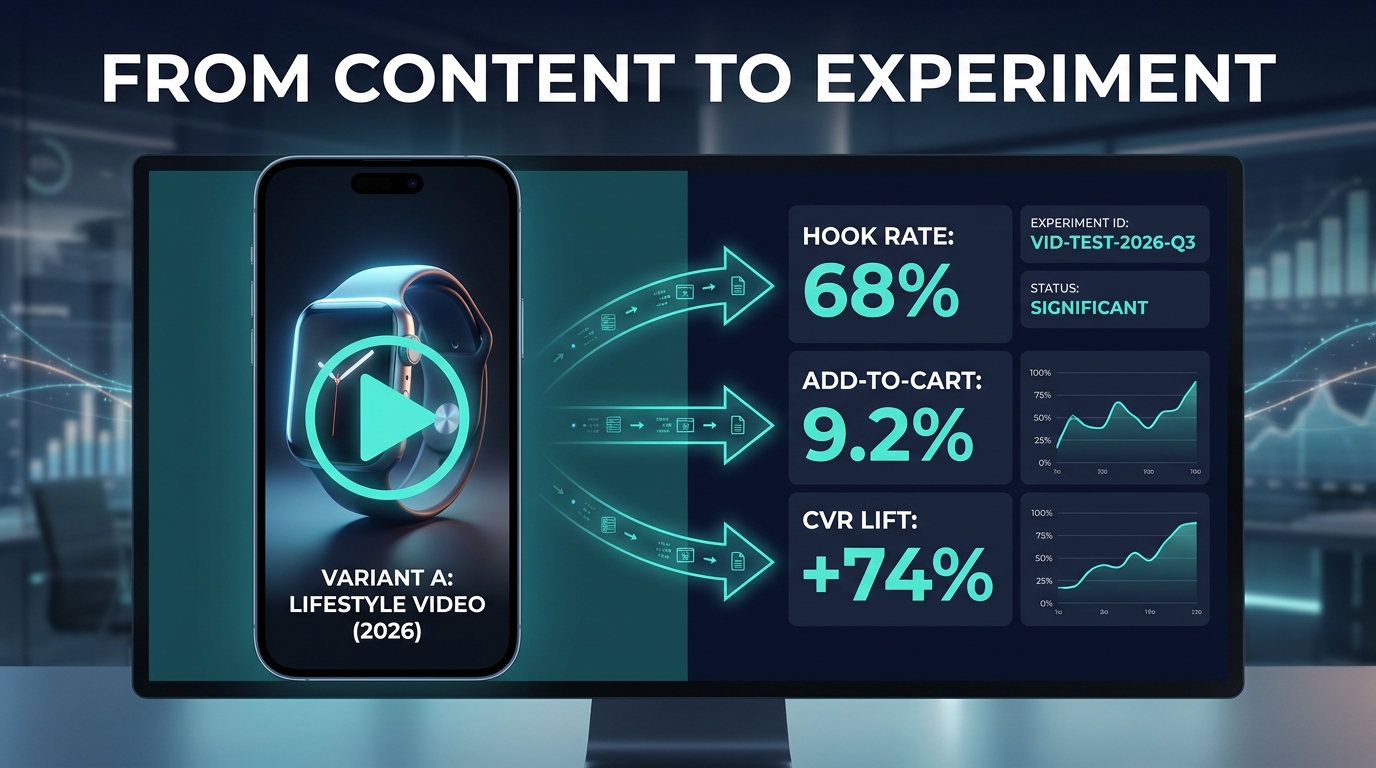
Most brands treat product video as a creative event. There’s a shoot, a review cycle, a launch — and then the video just lives on the product page, or runs as an ad, or gets posted to social. Performance is checked occasionally. Conclusions are drawn loosely. And the next video gets made with roughly the same assumptions as the last one.
That process works fine if your goal is to have videos. It doesn’t work if your goal is to use video to systematically grow conversion rates.
The difference between brands that extract real return from product video and those that don’t is almost never production quality. It’s rarely budget. It’s almost always whether the team treats video as a testable hypothesis or a finished creative asset. Those are fundamentally different operating modes — and they produce fundamentally different outcomes.
This post is a practical framework for the testing mode. It covers what the conversion data actually says, which variables move the needle and in what order you should test them, which metrics genuinely predict purchase behavior (and which ones flatter you without translating to sales), how often to iterate, and how to build a learning system so each test makes the next one smarter. It also addresses the increasingly relevant question of when AI-generated video makes sense versus human UGC — because the answer in 2026 is more nuanced than either camp would have you believe.
The goal is a repeatable operation, not a one-time win.
The Conversion Math Most Brands Underestimate
Before diving into testing methodology, it’s worth grounding the conversation in what the underlying data actually shows — not to justify video as a category, but to calibrate the scale of the opportunity and understand where the biggest gains are still being left on the table.
The Baseline Numbers
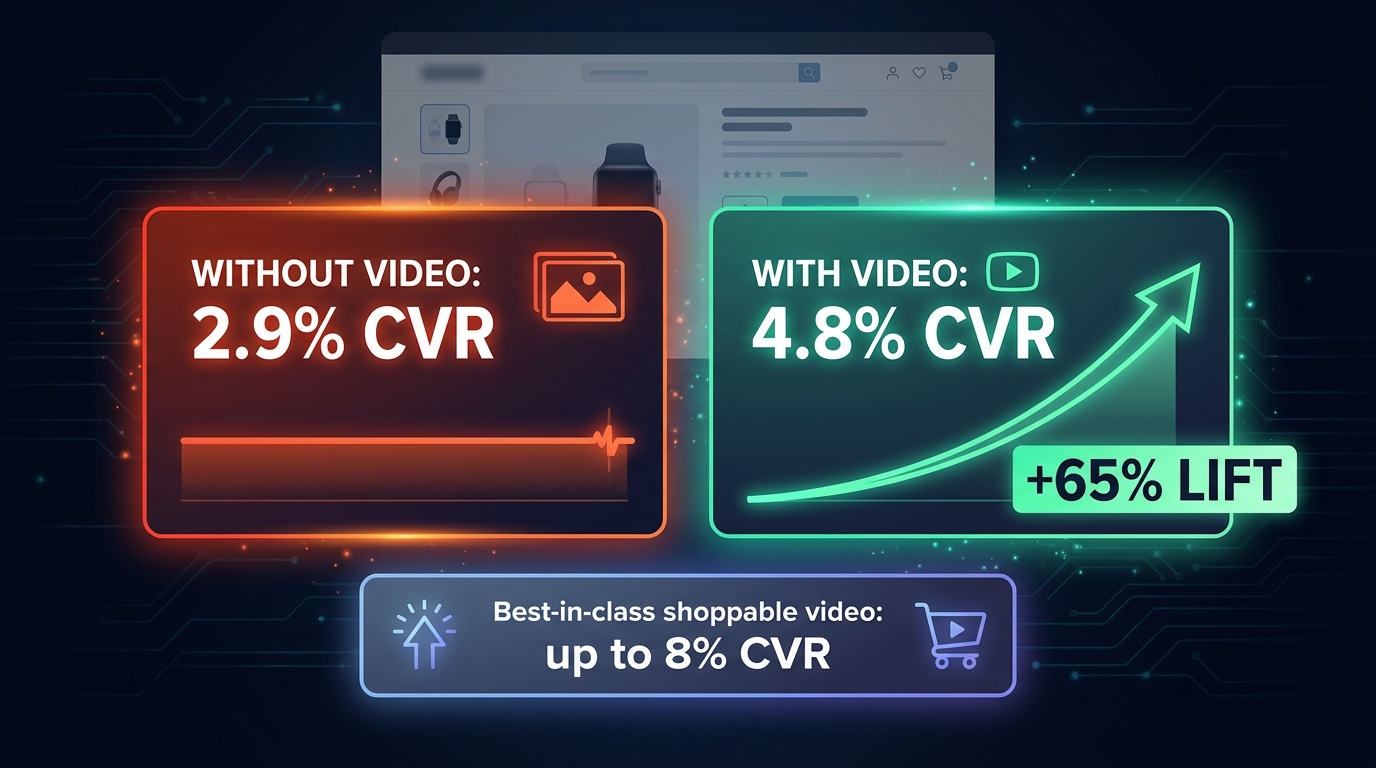
The average ecommerce conversion rate across industries in 2026 sits at approximately 2.5%. That number has remained stubbornly flat for nearly a decade despite enormous advances in UX, personalization, and checkout friction reduction. Product pages with video, however, average closer to 4.8% conversion versus 2.9% for pages without video — a gap of roughly 65%. In best-in-class implementations, particularly shoppable video formats that allow direct in-video purchasing, conversion rates reach 8% or higher.
Those aren’t edge cases or vendor-published vanity numbers. They represent a consistent, documented spread across independent studies and platform data. A 65% conversion lift against a 2.5% baseline is worth roughly one additional sale for every 55 sessions that would have otherwise converted only on text and images.
Where the Range Comes From
The variation between a modest 20% lift and an 86% lift — both of which appear in 2026 research — comes down to execution quality, video type, product category, and placement. A poorly shot, poorly edited auto-playing video buried below the fold will not move the needle much. A short, problem-first video placed prominently at the top of a product detail page, properly tested and iterated, routinely delivers the higher end of that range.
This is the core insight: video is not a monolithic lever. It is a collection of variables. Some of those variables respond dramatically to small changes. The brands capturing outsized returns aren’t necessarily making better-looking videos — they’re making more carefully structured decisions about which variables to change, testing those decisions in isolation, and scaling what works.
The Live Shopping Premium
A separate but increasingly relevant data point: live shopping video formats are consistently outperforming standard on-page video by wide margins. Platforms reporting on live commerce performance cite conversion lifts of +89% and engagement lifts of +180% compared to standard video experiences. This is partly a function of urgency and social context, but it’s also a signal that interaction — not just passive viewing — is where the highest-yield video formats are evolving.
For brands not yet operating in live commerce, this creates an important strategic question: is your current video strategy a ceiling, or a foundation? The testing framework in this post applies to both standard and live video formats, though the implementation specifics differ.
Treating Video as a Hypothesis, Not a Finished Asset
The mental model shift that separates high-performing video programs from average ones is conceptually simple but practically difficult to sustain: every video is a hypothesis, not a deliverable.
When a video is a deliverable, the job ends at launch. The team ships the asset, the campaign goes live, and performance is evaluated qualitatively or in aggregate. Creative decisions in the next round are informed by gut feeling, stakeholder preferences, and platform trends — not structured evidence.
When a video is a hypothesis, launch is the beginning of the process. The hypothesis has a specific, falsifiable structure: “If we open with a customer pain statement rather than a product feature, our 3-second hook rate will increase and add-to-cart rate will improve by at least 10%.” The test is designed to confirm or refute that specific claim. The result — regardless of outcome — becomes documented evidence that informs the brief for the next production cycle.
What a Testable Brief Looks Like
A hypothesis-driven video brief contains six elements:
- The specific variable being tested — one thing, clearly defined. Hook opening, CTA placement, presenter type, video duration, or message angle. Not a general “try something different.”
- The control version — what currently exists or what the baseline will be. Without a control, there is no experiment.
- The predicted direction of change — not just “we think this will perform better” but “we expect hook rate to increase by X% because of Y audience insight.”
- The primary measurement metric — one metric tied to a business outcome, established before launch. Add-to-cart rate, video-attributed purchase rate, or CPA from video traffic. Not views.
- The minimum threshold for declaring a winner — how many conversions, at what confidence level, over what time window. This prevents premature optimization and prevents dragging underperforming concepts longer than they deserve.
- The learning to be documented — regardless of outcome, what will the team record about why this test was run and what the result means for future production decisions?
This structure takes more upfront effort than simply briefing a new video. It also produces compounding returns over time, because each test generates documented intelligence rather than isolated results.
The “One Variable” Discipline
The single most common failure mode in video testing is changing too many things at once. A team produces a “new version” of their product video that has a different hook, a different presenter, a new CTA, and an edited middle section — and then finds it performs 40% better. That result is genuinely useful for the immediate campaign, but it teaches nothing actionable for the next brief.
Disciplined variable isolation feels inefficient when you’re confident about your creative instincts. It isn’t. The compounding value of documented single-variable learnings over a 12-month testing roadmap consistently outperforms intuition-led creative development, even when the intuition is sophisticated.
The Hook Unit: Why the First Three Seconds Need Their Own Testing Sprint
If you only have bandwidth to test one element of your product videos right now, test the hook. The research on this is consistent across platforms and formats: the first three seconds of a video determine whether anything else in the video gets seen.
The Data on Early Attention
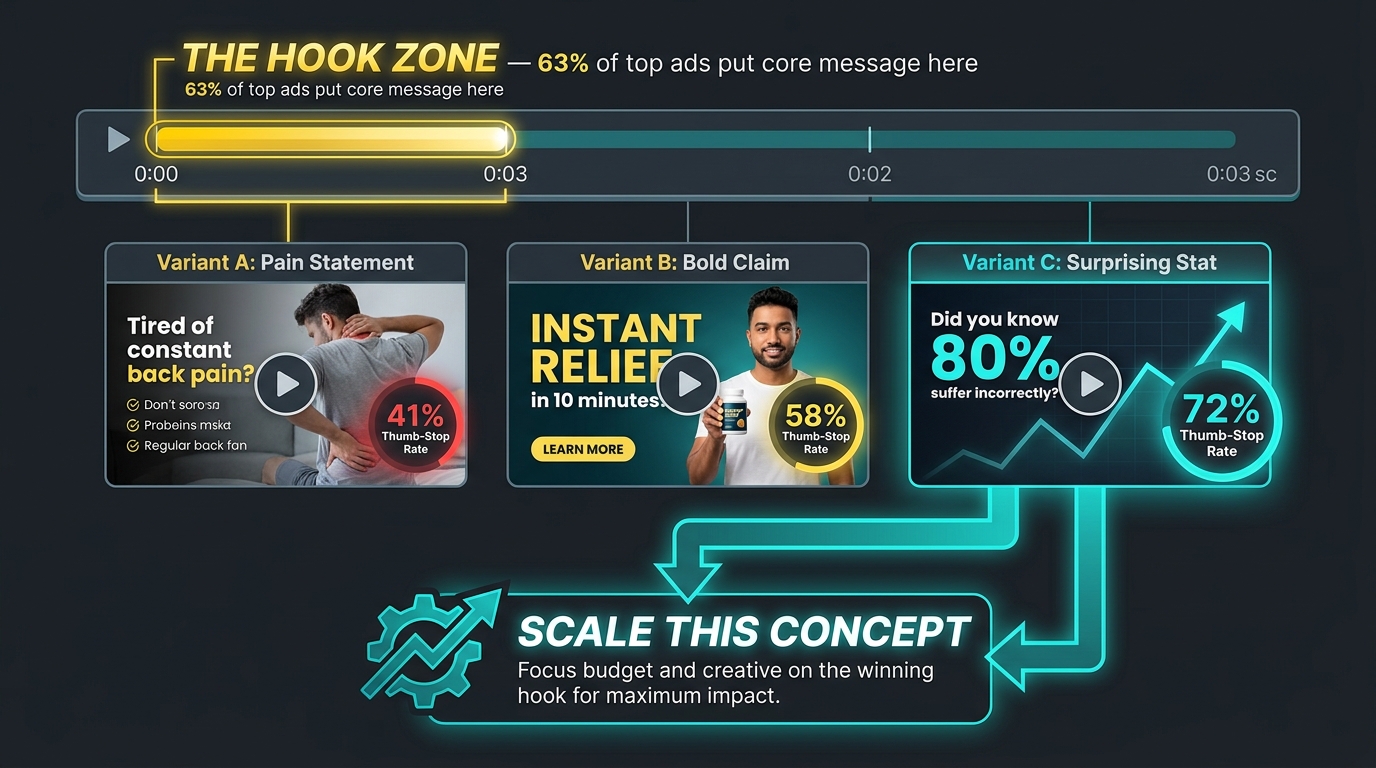
Across TikTok ad performance data and broader short-form video research, 63% of the highest-performing ads deliver their core message within the first three seconds. Platform algorithms on both TikTok and Meta make distribution decisions partly based on early retention signals — if a video loses the audience immediately, it gets throttled before it can reach the users who might have converted.
Approximately 90% of ad recall is determined within the first six seconds. After the first three, you’ve either captured attention or lost it. The rest of the video — your proof points, your product demo, your CTA — exists in service of those opening seconds. If the hook fails, the investment in the rest is wasted.
Running a Hook-First Testing Sprint
The practical implementation is straightforward: produce multiple versions of the first three seconds for the same video body. Keep everything after the three-second mark identical across variants. Run them simultaneously to the same audience, and read results on hook rate (also called thumb-stop rate or 3-second retention) and hold rate (what percentage of viewers who passed the hook made it to the midpoint) within 24 to 72 hours.
The hook types that are consistently testable — and consistently produce meaningful variance in results — include:
- Pain statement: Open by naming a specific, relatable frustration your customer has before they found your product. “You’ve tried four different solutions and none of them actually held up.”
- Bold claim: Lead with your product’s most striking performance claim, stated as fact. “This lasts 3x longer than anything else in this category.”
- Surprising statistic: Open with a counterintuitive number that reframes the problem your product solves. “85% of people using this type of product are doing it wrong.”
- Outcome first: Show the result before explaining the product. Let the viewer see what their life looks like after — and make them curious about the path to get there.
- Pattern interrupt: Use an unexpected visual, a direct-to-camera address that breaks conventions, or movement that contrasts with the surrounding feed. This is a format-level hook rather than a message-level one, and it often works best when paired with a strong verbal opening.
These are not interchangeable. Different product categories, different audience segments, and different platforms consistently favor different hook types. There is no universal winner — which is exactly why testing them systematically is more valuable than picking based on preference.
What to Do With the Winner
Once a hook variant shows meaningfully higher hook rate and downstream hold rate, it becomes the control. The next sprint tests the video body. The test after that tests the CTA. The hook test doesn’t resolve what to say forever — it resolves what opening resonates with this audience right now, which informs the brief for the next concept iteration when fatigue eventually sets in.
What to Test and In What Order
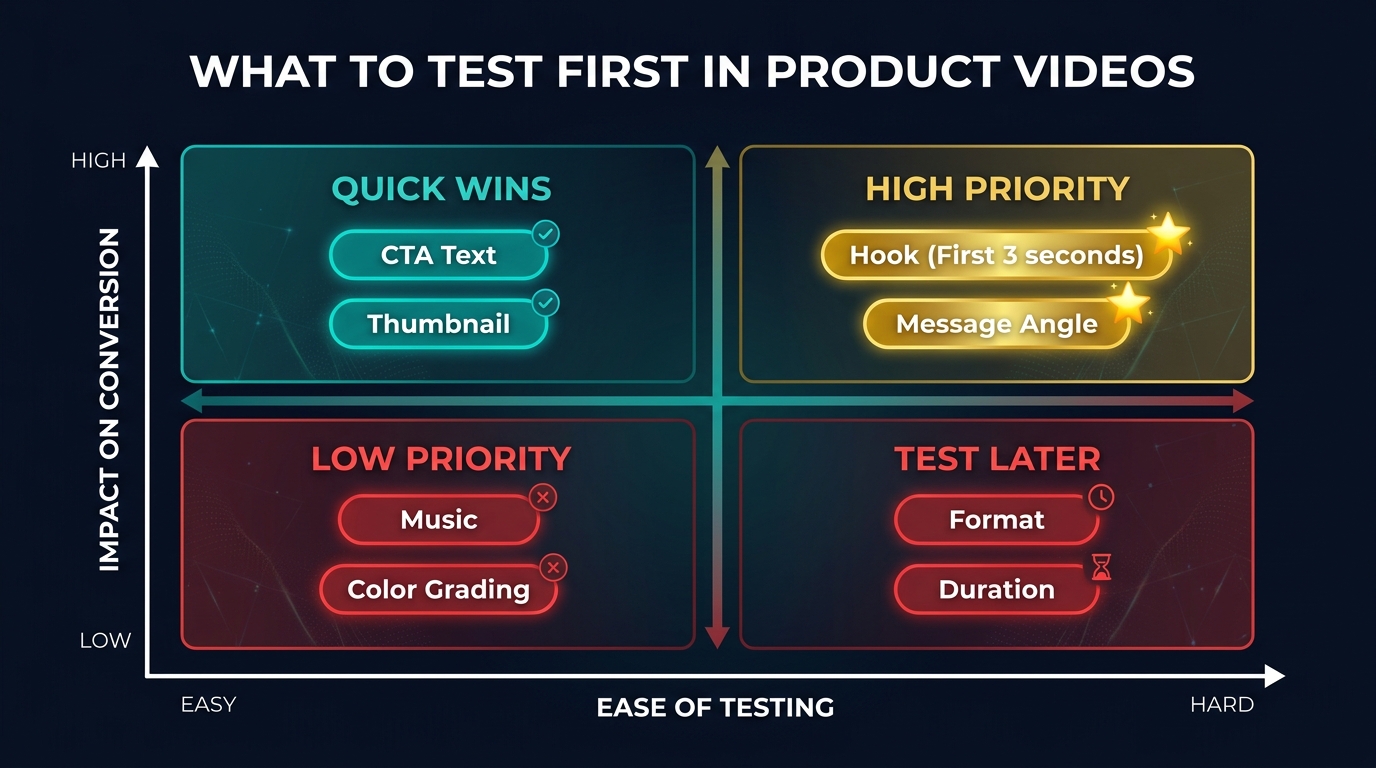
The sequence in which you test creative variables matters as much as the fact that you’re testing at all. Testing secondary variables before resolving the primary ones wastes cycles and produces ambiguous results. Here’s the recommended sequence, grounded in which variables produce the largest consistent impact on downstream conversion.
Tier One: Hook and Message Angle
These are the highest-leverage variables and should be resolved first. Hook covers the first three seconds as described above. Message angle is the framing of the product’s value proposition throughout the video — are you selling on convenience, on outcome, on social proof, on price efficiency, on exclusivity, or on problem relief? Different angles resonate differently across audience segments, and finding the angle that speaks to your highest-intent buyers is foundational to everything else.
Message angle tests require slightly longer run windows than hook tests because they affect mid-video retention and downstream conversion rather than the immediate thumb-stop signal. Expect to need 7 to 10 days of data and 50+ conversions per variant before drawing conclusions.
Tier Two: Format and Structure
Once you’ve established a working hook type and message angle, test the format. The main format variables in product video are:
- Talking head vs. voiceover with B-roll — human face on camera creates more immediate connection; voiceover with product footage creates a more controlled visual experience.
- UGC style vs. produced style — casual, slightly imperfect footage often outperforms polished production in social feed contexts because it reads as more authentic. This is heavily category and brand dependent.
- Problem-solution structure vs. feature-led structure — leading with the customer’s experience versus leading with the product’s specifications.
- Testimonial format vs. demonstration format — social proof through a customer voice versus proof through product performance on screen.
Format tests typically require more production than hook tests, which is why they come after the angle is established. You don’t want to invest in multiple format variants before knowing which message they should carry.
Tier Three: CTA and Duration
Call-to-action testing is more impactful than most teams expect, and it’s also one of the easier tests to run because CTA changes can often be made in post-production without reshooting. The variables worth testing include CTA placement (at the end vs. mid-video), CTA language (“Shop Now” vs. “See How It Works” vs. “Get Yours”), and CTA format (text overlay vs. spoken vs. both).
Duration testing — comparing a 15-second version against a 30-second or 60-second version of the same concept — is a legitimate test but belongs in the later tiers. Duration should be determined by how much proof the audience needs to convert, which varies by product complexity, price point, and audience familiarity with the category. For new products in unfamiliar categories, longer often converts better; for commoditized or visually obvious products, shorter almost always wins.
What Not to Prioritize Early
Music selection, color grading, and production polish are elements that teams spend disproportionate creative energy on relative to their impact on conversion. These are finishing decisions — they matter for brand coherence but rarely move conversion rates meaningfully when tested in isolation. Save them for after the structural variables are resolved.
Which Metrics Actually Predict Purchase Rate
The metric problem in video marketing is real, pervasive, and quietly expensive. Teams optimize for the numbers they can see most easily — views, completion rates, watch time — rather than the numbers that most reliably predict whether someone buys. Understanding the difference changes how you interpret test results and where you focus ongoing attention.
The Metric Hierarchy
In 2026, the metrics that most reliably predict purchase behavior from product video break down as follows:
Primary (directly tied to purchase intent):
- Video-attributed add-to-cart rate — the percentage of video viewers who add a product to cart from the video or within the same session after viewing. This is the strongest leading indicator of purchase available from video data.
- Checkout proximity rate — how far into the checkout flow video-attributed sessions reach. A viewer who watches the video and reaches checkout step 3 before abandoning is qualitatively different from one who bounces to the homepage.
- Video-attributed revenue per session — the most complete downstream metric. Requires proper attribution setup but tells you definitively what the video is worth.
Secondary (strong diagnostic signals, weaker purchase predictors):
- Hook rate / 3-second retention — predicts whether the video will get watched, not whether it will convert. Essential for creative diagnostics but should never be the only metric you optimize for.
- Hold rate / completion rate — tells you whether the video body is holding attention. Low completion combined with high hook rate indicates the opening promise isn’t being delivered. High completion combined with low add-to-cart means the video entertained without motivating action.
- Click-through rate to product page — useful as an early-funnel indicator in paid social contexts, but heavily influenced by CTA placement and offer framing, not just video quality.
Vanity (monitor but don’t optimize for):
- View count — a distribution metric, not a conversion metric. High view counts on a video that doesn’t convert means you’ve created reach without return.
- Shares and saves — useful for understanding viral potential and top-of-funnel discovery but have a notoriously weak correlation with purchase intent.
- Average watch time (in isolation) — a product demo that gets watched completely but doesn’t prompt any purchase action has not succeeded at its job.
Building the Right Attribution Setup
Getting accurate video-attributed conversion data requires intentional technical setup. On-page product videos should have session-level tagging that distinguishes video-engaged sessions from non-video sessions. This allows you to compare conversion rates for visitors who played the video versus those who didn’t — which is the most direct measurement of whether the video is actually driving the lift the data suggests.
For paid video ads, platform attribution windows significantly affect how results appear. Be consistent with your attribution window across tests — 7-day click is standard for purchase-based products, 1-day view is useful for impulse categories. Mixing windows between variants produces incomparable data.
The Completion-Conversion Disconnect
One of the most commonly misunderstood patterns in video analytics is high completion paired with low conversion. When this appears, the instinct is often to conclude the video is good but the product isn’t compelling. That’s sometimes true. But more often, a high-completion, low-conversion video is delivering entertainment without motivation. The viewer watched the whole thing because it was engaging — and then didn’t buy because the video never gave them a clear, urgent reason to act.
The fix is usually not a better product. It’s a stronger CTA, clearer outcome framing, or an earlier proof point that moves the viewer from interested to convinced before the end of the video.
Creative Cadence and the Reality of Fatigue
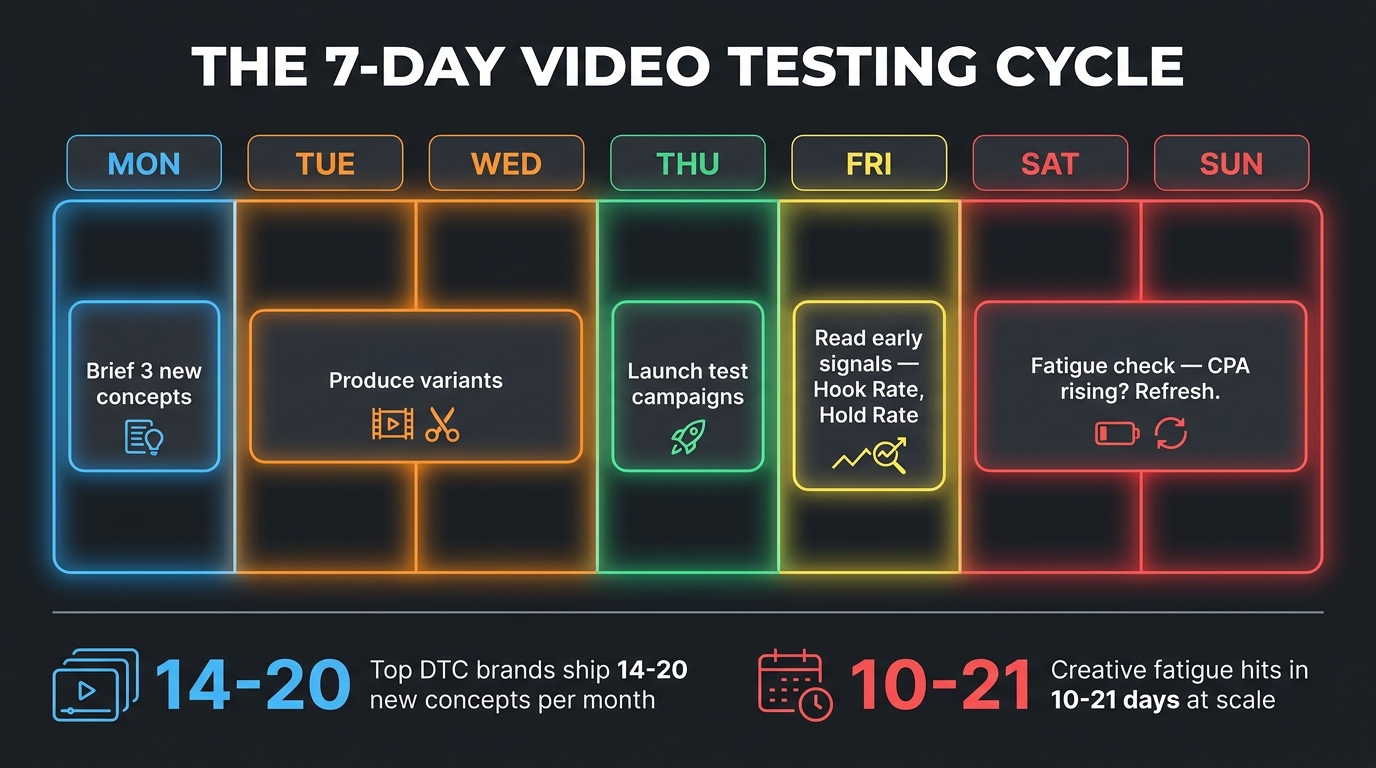
One of the practical realities that most video testing frameworks underaddress is creative fatigue — the predictable decline in performance that hits even well-crafted, well-tested videos after prolonged exposure to the same audience. Understanding fatigue cycles and building a production cadence that accounts for them is what separates a testing program from a testing moment.
How Fast Fatigue Arrives
In paid social contexts — Meta, TikTok, and similar high-frequency feed environments — creative fatigue typically appears within 10 to 21 days at meaningful spend levels. The symptoms are specific and measurable: rising cost per acquisition, declining hook rate and hold rate against the same targeting, falling click-through rates, and increasing frequency against a static audience.
On product detail pages and other owned media placements, fatigue operates on a completely different timeline — typically 9 to 12 months, triggered by seasonal shifts, product repositioning, or meaningful changes in competitive context rather than audience exposure frequency.
The Cadence Top Teams Are Running
Analysis of top-quartile DTC accounts in 2026 shows a consistent operational pattern: approximately 14 to 20 new creative concepts per month shipped into structured testing campaigns. That’s roughly three to five new concepts per week — not minor edits or format adjustments, but fresh concepts with distinct hooks and angles.
This sounds like a significant volume commitment, and it is. But it’s important to distinguish between “new concept” and “full production shoot.” High-volume testing programs use modular production approaches: a core footage library that can be re-edited with different hooks, AI-generated variant hooks layered over existing footage, and UGC creator briefs designed to produce several angle variants in a single creator relationship.
When to Refresh vs. When to Kill
The data-driven triggers for creative action:
- Hook rate drops more than 20% from peak → try a new hook variant before replacing the full concept
- CPA rises more than 30% from baseline → full concept refresh needed, not just a hook swap
- Completion rate drops while CPA rises → the audience has seen this before; creative fatigue is the primary driver
- Click-through rate is stable but CVR drops → landing page or post-click experience issue, not the video
The distinction between a hook refresh and a full concept refresh matters for budget and bandwidth. Don’t over-invest in full reshoots when a hook swap might recover performance. Don’t under-invest by continuing to make small edits when the underlying concept has run its course.
Building a Bench of Concepts in Advance
The teams that handle fatigue best don’t scramble when performance drops — they pull from an already-tested bench of concepts that are ready to scale. This requires a pipeline mentality: you’re always testing next month’s winners at low spend while scaling this month’s proven performers at high spend. The moment a top performer shows fatigue signals, a pre-tested replacement is available to swap in immediately, rather than waiting for a new production cycle to complete.
AI-Generated Video vs. Human UGC: What the Head-to-Head Data Shows
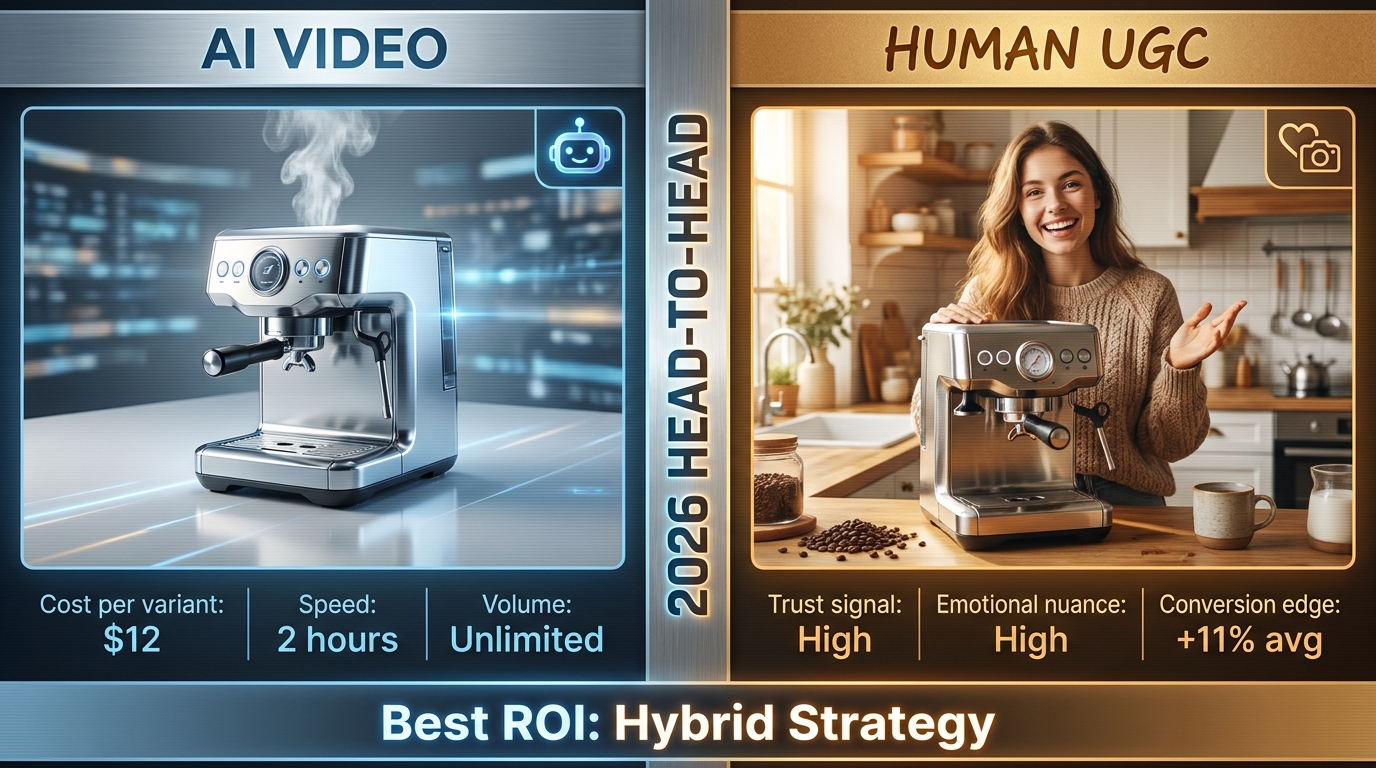
The conversation around AI-generated product video has matured significantly in 2026. The question is no longer whether AI tools are capable of producing feed-native video — they clearly are. The question is where they genuinely outperform human production, where they fall short, and how to structure a hybrid approach that extracts value from both.
Where AI Generation Wins Clearly
AI video tools in 2026 have reached a point where they produce short-form product demos and hook variants that perform comparably to human UGC for specific use cases. The categories where AI has a clear operational advantage:
- Volume of variants for testing: Generating 10 hook variants for the same core video costs a fraction of what human creator fees and reshoots would cost. For the testing phase of any video program, AI-generated variants significantly reduce the cost per insight.
- Speed: A human UGC creator brief-to-delivery cycle typically runs 5 to 14 days. AI video generation for short-form hook variants can happen in 2 to 4 hours. This is a meaningful operational advantage for teams running tight testing cadences.
- Localization: AI-generated video can produce regional language variants, different presenter demographics, and market-specific adaptations at scale — a capability that would require significant creator infrastructure to replicate with human UGC.
- Pre-testing concept viability: Many teams now use AI-generated rough cuts to pre-validate a concept’s hook and angle before investing in human creator production. If the AI version doesn’t pass the hook rate threshold in a small-budget test, the concept gets abandoned before the bigger investment is made.
Where Human UGC Still Wins
In controlled head-to-head tests, human-shot UGC continues to outperform AI-generated video in several consistent areas:
- Conversion rate on high-consideration purchases: For products where trust is a primary barrier — health and wellness, higher price points, products with claims that require credibility — human creators showing genuine use and offering authentic reactions consistently convert better. The authenticity signal that UGC provides is not yet reliably replicated by AI.
- Long-form storytelling: Anything above 30 to 45 seconds that requires narrative arc, emotional build, or nuanced product experience still performs better with human creators. AI-generated video tends to feel flat in the mid-section of longer formats.
- Brand depth and integration: When the video needs to communicate brand identity, lifestyle, or cultural positioning — not just product function — human creators bring context that AI tools cannot authentically manufacture.
The Hybrid Model in Practice
The most operationally effective approach in 2026 is a tiered production model:
- AI-generated hook variants for initial concept testing — high volume, low cost, fast turnaround. Use to identify which angles and hook types warrant investment.
- Human UGC production for the winning concepts — once an angle has demonstrated potential in AI-variant testing, invest in one or two human creator executions to validate at higher production quality and test the authenticity premium.
- Produced/cinematic video for proven hero concepts — once a concept has shown strong conversion across multiple format iterations, a higher-production version becomes a justified investment for PDP placement, YouTube pre-roll, and longer-shelf-life contexts.
This structure means AI tools are deployed where they create the most leverage (early-stage testing at volume) and human creators are used where they create the most return (converting proven concepts at scale).
Shoppable Video: Format Choices and Their Impact on CVR
Shoppable video — formats that allow viewers to interact with, click on, or purchase directly from the video interface — represents the clearest evidence that video format is a conversion variable, not just a production choice. The difference in conversion rates between a standard embedded product video and an interactive shoppable video on the same page, showing the same product, can be substantial.
The Format Performance Spread
Across 2026 ecommerce data, the main shoppable video formats produce distinct conversion ranges:
- Standard embedded product video (non-interactive): 4–6% CVR on product detail pages. The baseline for video-engaged sessions.
- Shoppable video with clickable product tags: 6–8% CVR. The ability to click through to a product card within the video reduces friction and captures intent at the highest moment — when the viewer sees the product working.
- Floating/sticky video players: These maintain video playback as the user scrolls the page, which typically increases completion rate by 20–40% versus a static embed and maintains the conversion lift throughout the browsing session.
- Live shopping video: 9–22% CVR in implementations where live commerce is native to the platform or well-integrated into the brand’s owned channels. The combination of urgency, interactivity, and social presence creates a purchasing environment that neither static video nor product pages replicate.
Placement as a Testable Variable
Video placement on the product page is itself a meaningful test variable. Above-the-fold placement — where the video is visible without scrolling — consistently outperforms below-the-fold placement by 15 to 25% on add-to-cart rate. This finding is consistent enough that above-the-fold should be the default assumption, with below-the-fold as a test rather than a deliberate choice.
Autoplay vs. click-to-play is a more nuanced decision. Autoplay (muted, with captions) typically generates higher initial engagement metrics but lower conversion per play, because many plays are passive or accidental. Click-to-play generates lower total plays but higher intent signals per play — viewers who click are already more interested. The right choice depends on whether you’re optimizing for reach or depth, and varies by product and placement context.
Caption Design and Mobile Optimization
More than 80% of video is consumed on mobile devices, and a significant portion of that mobile consumption happens in environments where sound is off by default — public transit, work environments, shared spaces. Videos without captions lose the audio dimension entirely for this segment, which can represent a majority of total views depending on placement.
Captions aren’t a simple accessibility feature — they’re a conversion lever. Testing captioned vs. uncaptioned versions of the same video consistently shows improved completion rates for captioned versions in mobile, muted contexts. Caption copy is also independently testable: the exact words that appear on screen in the first three seconds are their own hook, and should be treated as such.
The Learning Log: Building a Permanent Creative Intelligence System
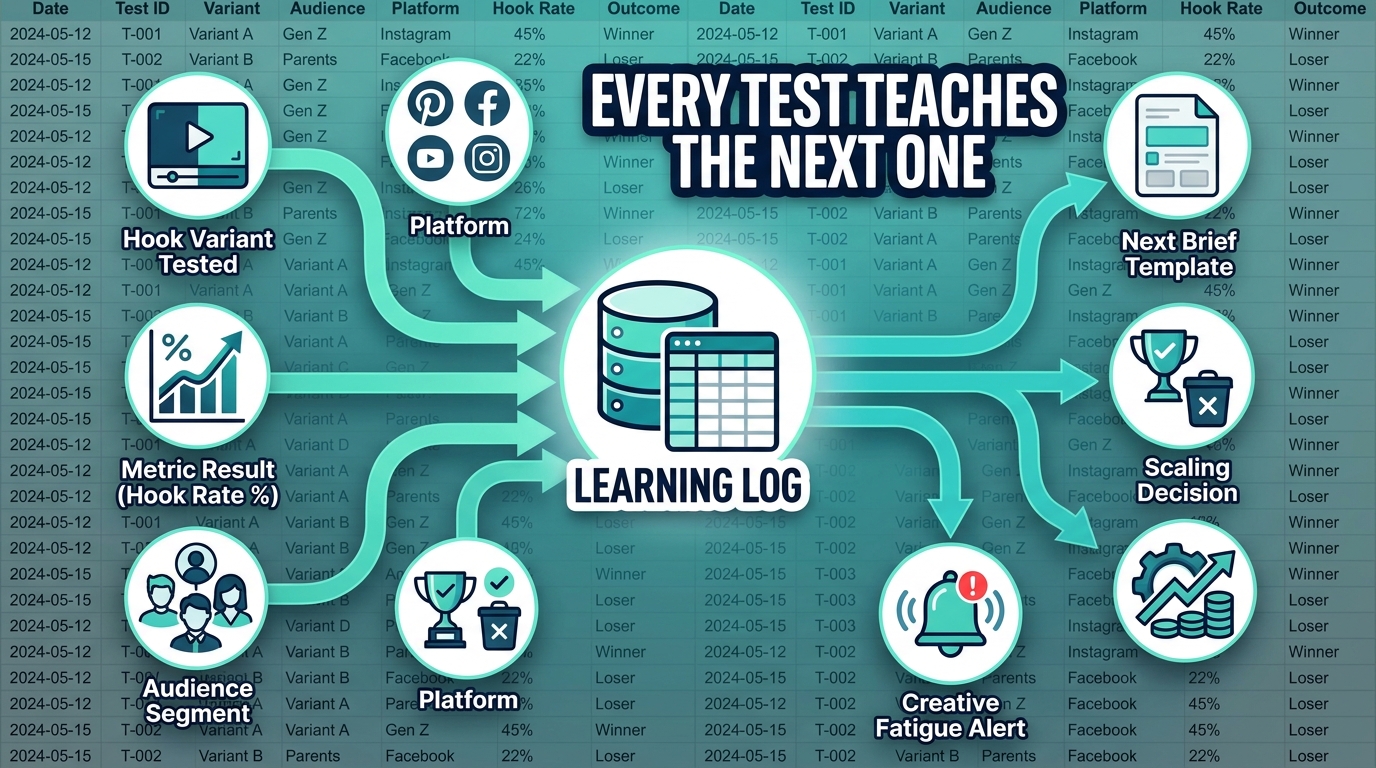
The difference between a brand that runs tests and a brand that builds a testing operation is documentation. Individual test results — a hook variant that outperformed by 31%, a message angle that underperformed by 18%, a CTA placement that had no measurable impact — are only valuable if they feed the next brief. Without a structured capture system, those results live in a spreadsheet no one revisits, and the team relitigates the same creative debates quarter after quarter.
What the Learning Log Captures
A functional creative learning log doesn’t need to be sophisticated. It needs to be consistent. The minimum viable record for each completed test:
- What was tested: The specific variable, the control version, and the variant version. Described precisely enough that someone who wasn’t in the room can understand the experiment without a briefing.
- The hypothesis: What the team predicted would happen and why. Over time, tracking hypothesis accuracy builds calibration — teams get better at predicting what will work because they can see where their instincts have been right and wrong.
- The result: Primary metric outcome, statistical significance level, and how long the test ran. Not a qualitative judgment — the numbers.
- The interpretation: What the result means about your audience. A hook test that finds pain-statement openings outperform bold claims isn’t just a creative finding — it tells you something about your audience’s awareness level and what stage of the buying journey they’re in when they encounter your video.
- The implication for future briefs: The single most important field. What changes in how you’ll brief the next video as a result of this finding?
The Compounding Value Over Time
A learning log with 30 documented tests is a qualitatively different asset than one with 5. At 30 tests, patterns emerge. You can see that your audience consistently responds to outcome-first hooks on TikTok but prefers pain-statement hooks in Meta feed. You can see that mid-video social proof increases hold rate but doesn’t significantly impact add-to-cart — which tells you the proof isn’t landing as a motivator. You can see that CTA language matters more in checkout-adjacent placements than in top-of-funnel awareness formats.
These patterns aren’t visible from individual tests. They’re only visible from a structured body of evidence. And once visible, they change how fast you can iterate, how much confidence you have in briefs, and how efficiently you can onboard new creative talent or AI tools into your production process — because the institutional knowledge is captured rather than sitting in someone’s head.
Integrating the Log Into the Brief Cycle
The practical integration is a 15-minute review of relevant log entries at the start of every new brief. Before writing the next concept, the creative lead reviews: what do we know about hook performance for this product category? What message angles have we already ruled out? What audience segments have shown the strongest response to which format types?
This review prevents the most common form of creative waste: re-testing things already tested, because no one can remember that the team tested it six months ago and it didn’t work.
Structuring a Video Testing Roadmap for the Next 90 Days
Abstract frameworks are useful; concrete plans are actionable. Here’s how a 90-day testing roadmap looks for a brand starting from a baseline of one or two existing product videos with no prior systematic testing history.
Days 1–30: Hook Resolution Sprint
The first month is dedicated entirely to the hook. Take your best existing product video — the one with the most production investment or the longest time in market — and produce four to six hook variants. These can be as simple as re-editing the opening three seconds with different audio, different text overlays, or different opening shots from existing footage.
Run all variants simultaneously against the same audience at minimal spend (enough to get 500–1,000 impressions per variant). Read hook rate and hold rate at 48 hours. Identify the top two performers. Run those two against each other until you have 50+ adds-to-cart from the combined test. Document the winner, the margin of victory, and the hypothesis about why it won.
At the end of month one, you have a documented best hook type for your current top product video. That’s the foundation everything else builds on.
Days 31–60: Angle and Format Testing
Using the winning hook from month one as the opening, produce two or three video variants that test different message angles in the body. This requires more production investment — you’re likely briefing creators or producing new footage — but you have the hook resolved, which means the test is cleaner.
Run these at moderate spend, measuring through to add-to-cart and ideally through to purchase. This phase typically takes longer to reach statistical significance because you’re measuring a downstream metric. Budget 21 to 28 days for this phase.
Days 61–90: CTA and Scaling
With a proven hook and proven angle, the final month tests the call to action and begins scaling the winning concept. CTA tests are fast — they can often be executed with post-production text overlay changes — and they’re worth running because the compounding effect of a meaningfully better CTA on a video already performing well is significant.
By day 90, you have: a documented winning hook type, a proven message angle, an optimized CTA, and at least 15 to 20 entries in a learning log that will inform every brief going forward. That is a different asset than a video. It’s a system.
The Operating Shift That Makes This Sustainable
Everything in this post requires something that most creative teams aren’t structured to deliver: the persistent, disciplined treatment of video production as an experimental operation rather than a campaign output.
That shift is harder than it sounds. Creative work attracts people who are motivated by making things, not by documenting tests. Stakeholders want to see finished assets, not ongoing experiments. Budget cycles are built around campaigns, not testing programs. And the results of systematic testing — a 22% improvement in hook rate, a 14% improvement in add-to-cart — are harder to present in a review than a video with a million views.
But the economics are clear. Product pages with properly tested and iterated video average 65% higher conversion than those without. Brands running structured creative testing frameworks outperform peers on ROAS, CAC, and medium-term revenue growth across every documented analysis. The gap between a one-time video and a testing program isn’t creative quality. It’s organizational behavior.
Practical Starting Points
- Start with one video, not a program. Pick your highest-traffic product, take your current video, and run the hook sprint described above. Don’t wait for a complete testing infrastructure before beginning.
- Define one primary metric before you start. Add-to-cart rate from video is usually the right choice for ecommerce. Write it down. Don’t change it mid-test.
- Create a shared log immediately. Even a simple shared spreadsheet beats trying to remember what was tested and what was learned. Start the documentation habit on the first test.
- Set a budget for testing, separate from campaign spend. Testing spend and scaling spend serve different functions. Commingling them creates pressure to scale before tests are conclusive.
- Build the pipeline mentality from the beginning. You should always be testing next month’s concepts at low spend while running this month’s proven concepts at full spend.
The Outcome Over 12 Months
A team that runs disciplined variable testing on product video for 12 months has something that cannot be bought and cannot be produced in a single campaign sprint: an evidence base. They know which hook types work for their audience. They know which message angles their highest-converting customers respond to. They know how long their videos should be, where CTAs should be placed, whether AI variants work for their category, and how far into a campaign cycle fatigue typically sets in.
That knowledge is durable. It informs every future brief, every creator relationship, every platform strategy decision. And it accumulates through the same small, repeatable testing actions — one variable, one hypothesis, one documented result — applied consistently over time.
Product video isn’t a creative problem. It never really was. It’s an experimental design problem with a creative execution layer on top. The brands that treat it that way are the ones with the conversion rates to prove it.