

Most PPC teams in 2026 have flipped the automation switch. Smart Bidding is running. Performance Max is live. The algorithm is “working.” And yet conversion costs are quietly climbing, ROAS has plateaued, and nobody can quite explain why a campaign that performed brilliantly in Q1 is hemorrhaging budget by Q3 without anyone touching it.
The problem isn’t the AI. The problem is that the optimization loop — the continuous cycle of data ingestion, model learning, bid execution, and performance feedback — was never properly engineered in the first place. Most teams treat it like a product feature they turned on. It’s not. It’s a system they’re responsible for maintaining.
This piece is for practitioners who are past the “should we use smart bidding?” conversation. You already know the answer is yes. The real question is: how do you architect an optimization loop that keeps improving rather than gradually eating itself? That means understanding the mechanics of how platform AI actually learns, what signals it depends on, where those feedback loops break, and what governance structure lets you stay hands-off without going blind.
The difference between a loop that compounds performance gains over months and one that silently drifts toward mediocrity comes down to a handful of engineering and operational decisions made in the first few weeks. Here’s how to make those decisions correctly.
The Optimization Loop Isn’t a Feature — It’s an Architecture
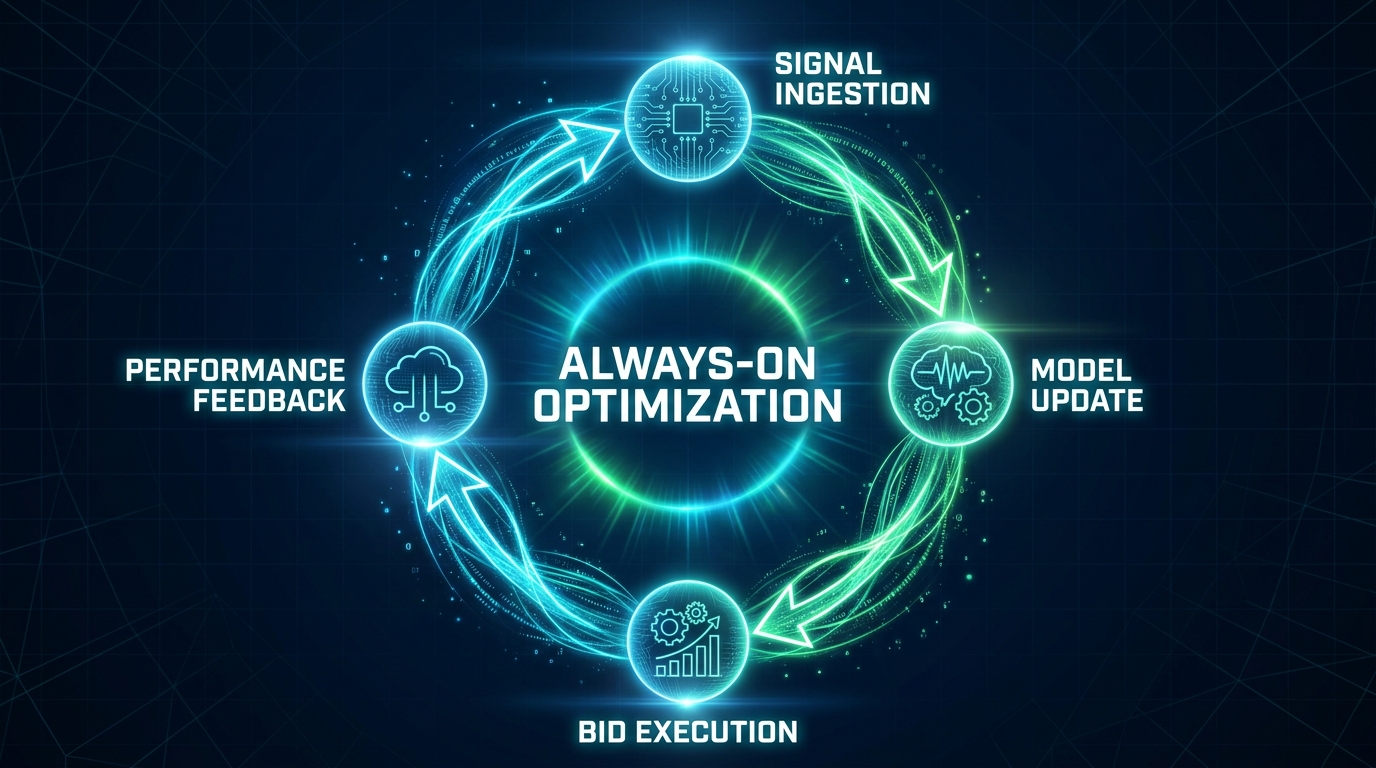
The phrase “optimization loop” gets used loosely in PPC circles, but it describes something very specific: a closed system where outputs from one stage become inputs for the next, continuously, without a hard stop. Platform AI runs these loops constantly — but the quality of what the loop produces is entirely determined by what you put into it.
Think of it the way an engineer thinks about a control system. You have a setpoint (your target CPA or ROAS), sensors (your conversion tracking), a controller (the bidding algorithm), and actuators (the bid adjustments applied at auction time). If any of those components is misconfigured or noisy, the entire system behaves erratically — regardless of how sophisticated the controller is.
What the Loop Is Actually Doing Every Second
At the auction level, Google’s Smart Bidding evaluates hundreds of contextual signals for every impression: device type, time of day, location, query semantics, audience membership, browser history signals, and dozens of others. It combines these with historical conversion patterns tied to your account to estimate the probability that this specific person, in this specific context, will convert. Then it sets a bid to achieve your target at scale.
That sounds straightforward. The complication is that “historical conversion patterns tied to your account” is entirely dependent on the conversion data you’ve been sending it. If that data is shallow, delayed, or misaligned with your actual business outcomes, the model’s probability estimates are built on a faulty foundation. It will optimize confidently toward the wrong thing.
Why “Turning On” Automation Isn’t Enough
The industry’s default behavior is to activate smart bidding, set a target, and then monitor ROAS at the campaign level. This is insufficient. It treats the loop as a black box that either works or doesn’t, rather than as an engineered system that needs calibrated inputs and defined feedback mechanisms.
A properly architected optimization loop has four distinct engineering layers:
- Signal layer: what conversion data flows into the bidding model, at what granularity, with what latency
- Structure layer: how campaigns, ad groups, and audiences are organized to give the model enough data per entity to learn from
- Cadence layer: when humans review, adjust targets, and make structural changes without disrupting the learning cycle
- Governance layer: what automated rules and thresholds prevent the loop from self-destructing during anomalies
Get those four layers right, and the loop becomes genuinely self-improving over time. Neglect any one of them, and you’re running a sophisticated system on a broken foundation.
How the Four-Stage Loop Actually Works Inside Platform AI
Understanding the internal mechanics of how platform AI processes its optimization cycle is essential for knowing where your interventions should land — and where they’ll cause damage.
Stage 1: Data Collection
Every click, impression, conversion event, and audience signal feeds into the platform’s data collection layer. This is where most loop failures originate. The data collected is only as good as your tracking implementation. Duplicate conversions inflate the model’s confidence. Missing conversions starve it. Tracking fires tied to page views rather than actual purchases teach the model to optimize for the wrong users.
Enhanced conversions — Google’s mechanism for hashing and matching user-provided data like emails back to conversions — can recover attribution data that standard pixel tracking misses, particularly in iOS environments where third-party cookie loss has eroded signal quality. Teams that have implemented enhanced conversions alongside standard tagging typically see a meaningful improvement in measured conversion volume, which in turn improves bid model reliability.
Stage 2: Model Training and Update
The bidding model doesn’t update in real time based on individual conversions. It learns from aggregated patterns over rolling windows. Google’s systems look at roughly the last 30 days of conversion data, weighted toward more recent events, to calibrate bid multipliers across contextual signals. This means the model is always lagging behind reality by some degree — a fact that becomes critical when you’re planning around promotional events, seasonality, or major market shifts.
The model also consolidates learning across similar campaigns and, in some configurations, across accounts in the same vertical. This is why a brand-new campaign can sometimes start performing reasonably well even before it has its own conversion history — it’s borrowing signal from adjacent learning.
Stage 3: Bid Execution
At each auction, the trained model outputs a predicted conversion probability and calculates the optimal bid to stay within your target constraints. This happens in milliseconds, at massive scale, across every impression the campaign is eligible for. The key variable here is your target setting: too aggressive a target (CPA too low, ROAS too high) and the model becomes overly restrictive, winning fewer auctions than your budget allows. Too loose, and it wins low-quality impressions in pursuit of volume.
Stage 4: Performance Feedback
This is where the loop closes. The results of bid execution — which impressions were won, which generated clicks, which generated conversions — flow back into the data collection layer and begin influencing the next model update cycle. The speed and fidelity of this feedback determines how quickly the loop can self-correct.
The critical insight: the faster and cleaner your conversion signals return to the platform, the faster the model updates, and the faster the loop can adapt. This is why offline conversion imports with long upload delays — where conversion data arrives 30 to 60 days after the click — create a fundamentally slower-learning loop than online conversion events that fire within hours.
Signal Engineering: The Part Most PPC Teams Get Wrong First
If the optimization loop is a car, signal quality is the fuel. You can have the most sophisticated engine in the world; run it on low-grade fuel and it knocks, sputters, and underperforms. Signal engineering is the deliberate work of ensuring the conversion data flowing into your bidding system accurately reflects your actual business outcomes — not just your website’s event firing logic.
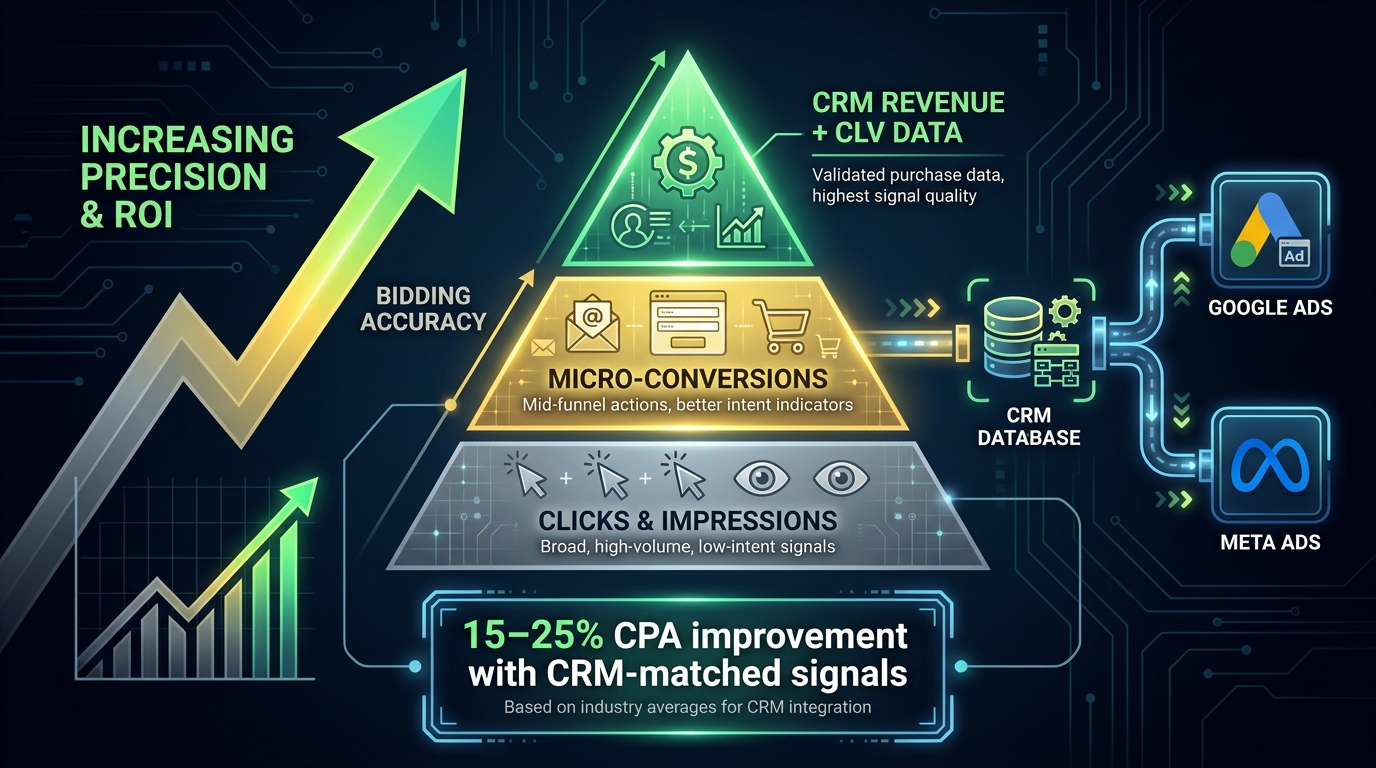
The Signal Quality Hierarchy
Not all conversion signals are equally useful to a bidding model. There’s a clear hierarchy based on how closely the signal correlates with actual business value:
- Page views and engagement events — these have extremely low correlation with revenue. Using them as primary optimization signals teaches the model to find people who browse, not people who buy.
- Form submissions and lead events — better, but problematic in lead generation contexts where lead quality varies enormously. A campaign optimizing on form fills may generate volume at the cost of qualified pipeline.
- Qualified lead events — tracking conversions only when a lead reaches a “marketing qualified” or “sales accepted” stage in the CRM significantly improves signal quality, but introduces conversion lag.
- Revenue and transaction data — the strongest signal. When you can pass actual transaction values back to the bidding system (via enhanced conversions or offline imports), the model can optimize toward real revenue rather than proxies for it.
- Customer lifetime value signals — the most sophisticated tier. Segmenting conversion values by predicted CLV, product margin, or customer cohort tells the model not just that a conversion happened, but how much it was worth. This enables genuine value-based bidding.
Implementing Enhanced Conversions and CRM Imports
Google’s enhanced conversions for leads work by hashing user-provided data (typically email) at the point of form submission and matching it to Google accounts — enabling attribution even when standard pixel tracking fails. When these matched signals are then enriched with CRM data (lead quality scores, deal size, or actual revenue) uploaded via the offline conversions API, the bidding model receives a signal that closely maps to business outcomes.
Research from practitioners and independent analyses has found that CRM-matched signal upgrades can improve CPA by 15–25% when Smart Bidding has enough volume to incorporate the new signal into its model. The improvement isn’t immediate — it typically takes two to three full learning cycles (roughly four to six weeks) before the benefit fully materializes in bid decisions.
Micro-Conversion Bridges for Low-Volume Accounts
Smart Bidding’s recommendation for campaign-level conversions is at least 50 per month, with 100 or more preferred for Target ROAS strategies. Many B2B advertisers, niche e-commerce players, and high-ticket sellers simply don’t generate this volume at the primary conversion level. The solution is micro-conversion bridging: identifying intermediate actions that predict eventual purchases with reasonable accuracy, and incorporating them as secondary optimization signals.
For a SaaS product, this might be “demo request” as the primary signal and “visited pricing page twice” as a micro-conversion bridge. For a high-ticket B2B service, it might be “whitepaper download from decision-maker” as a bridge to an “appointment booked” primary event. The micro-conversion bridge feeds volume to the model while the primary conversions accumulate, preventing the system from reverting to broad, untargeted bidding during early phases.
Conversion Lag: The Hidden Tax on Every Learning Phase
Conversion lag is the gap between when an ad click occurs and when the resulting conversion is attributed. It’s one of the most underappreciated variables in PPC optimization — and mismanaging it can cause a well-structured optimization loop to make systematically wrong decisions for weeks at a time.
Why Lag Breaks the Model’s Worldview
Imagine you’re running a bidding strategy targeting a $50 CPA. The model looks at the last 30 days of data and sees 200 conversions — it calculates a CPA of $48 and concludes the strategy is working. What it can’t see is that 60 of those conversions have a 45-day lag, meaning the actual CPA for the most recent month’s traffic won’t be measurable for another 15 days.
The model is therefore evaluating recent performance based on incomplete data. It believes its current bids are generating conversions at target when the full conversion window will actually reveal a shortfall. This lag-induced optimism can lead to the model holding bids steady or even increasing them during a period when the actual CPA is well above target — a pattern that’s invisible in real-time dashboards but obvious in retrospect.
Measuring and Mapping Your Lag Distribution
Every account has a characteristic lag distribution: the statistical spread of time-to-conversion across different campaigns, device types, and audience segments. Mapping this distribution should be a foundational step in any optimization loop setup.
The practical approach: export conversion data with both click date and conversion date, then calculate the lag for each conversion event across a 90-day window. You’ll typically see a distribution where 40–60% of conversions happen within 24 hours, another 20–30% within 7 days, and a long tail that extends to 30, 60, or even 90 days depending on your sales cycle and product complexity.
Once you understand your lag distribution, you can build it into your target-setting. If you know that only 65% of your 30-day conversions will be visible by day 14, your effective CPA will appear inflated in early-window reports. You can model this correction factor into your monitoring rather than reacting to apparent performance dips that aren’t actually happening.
Google’s Journey-Aware Bidding
In 2026, Google introduced journey-aware bidding in beta for Search campaigns on Target CPA. This mechanism allows the bidding model to learn from both biddable and non-biddable goals across the full lead-to-sale path, making it better suited for complex, multi-touch, high-lag funnels. For advertisers with longer sales cycles, this is a meaningful architectural change — but it requires that you have multi-touch conversion data flowing through the system, not just last-click events.
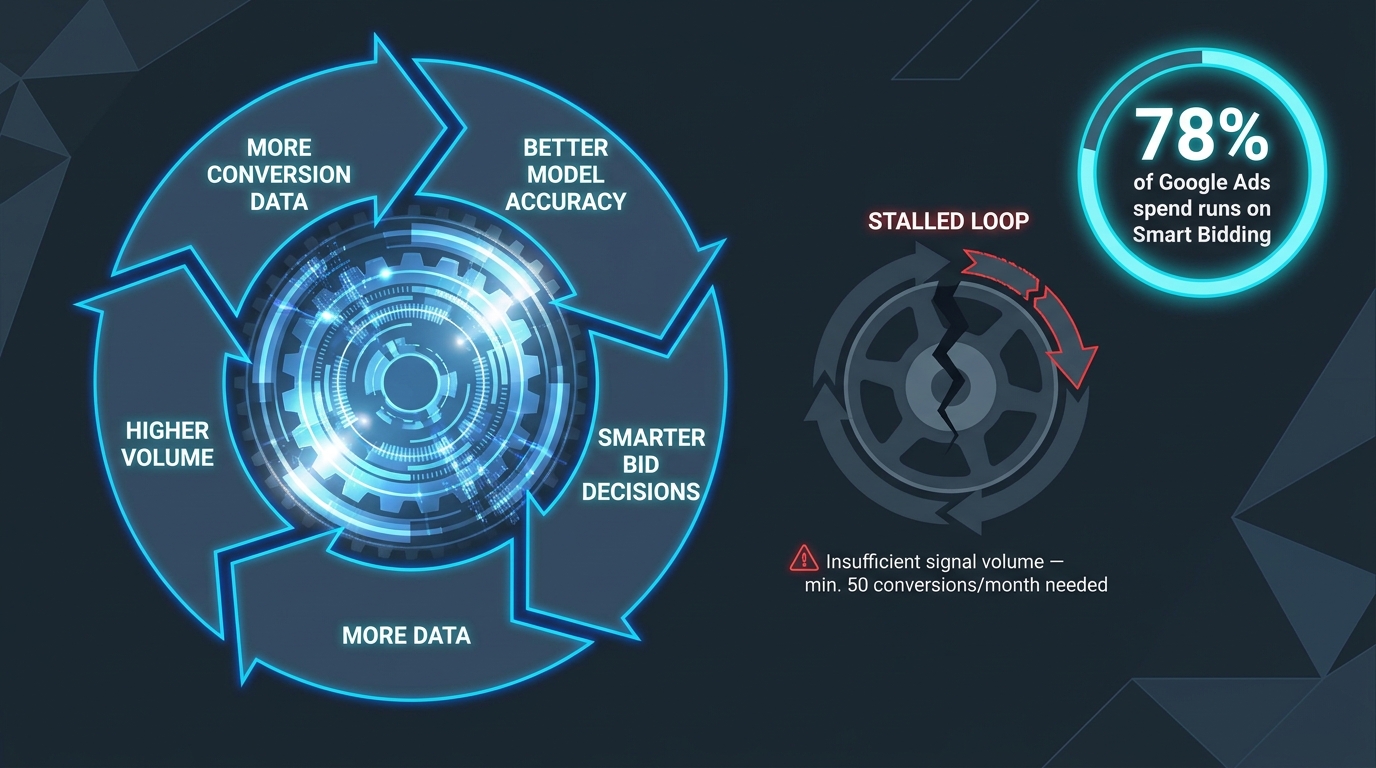
The Data Flywheel Effect (and Why It Stalls)
The data flywheel is the self-reinforcing dynamic where better conversion data improves bidding accuracy, which generates more conversions, which provides more data, which improves bidding further. It’s the mechanism behind compounding performance gains in well-run PPC programs — and it’s also what separates accounts that plateau after three months from ones that keep improving through the year.
What a Healthy Flywheel Looks Like
In a healthy flywheel, each optimization cycle delivers marginally better targeting, which improves conversion rates slightly, which provides more conversion events per dollar of spend, which sharpens the model’s audience understanding, which improves targeting again. The gains are rarely dramatic on a week-to-week basis — often less than 2–3% improvement in efficiency per cycle — but they compound over months into significant performance differentiation.
Performance Max on Google and Advantage+ Shopping on Meta both demonstrate this effect clearly. Accounts that were live and generating consistent conversion data through Q3 2026 are generally performing materially better than accounts that started with the same budget in Q4, because the earlier accounts have accumulated more flywheel rotations.
Five Reasons the Flywheel Stalls
Despite the theoretical elegance, most flywheels stall within the first 90 days. The five most common causes:
- Insufficient conversion volume per campaign. The minimum viable conversion volume for Smart Bidding to function properly is approximately 50 conversions per month per campaign. Below this threshold, the model doesn’t have enough data to distinguish signal from noise. The result is erratic bidding that looks random — because it effectively is.
- Campaign consolidation avoidance. Many accounts maintain over-segmented structures — separate campaigns for each product category, geography, or device type — in an attempt to control spend allocation manually. This fragments conversion volume across too many entities, leaving each individual campaign below the data threshold. A counterintuitive but empirically validated solution is to consolidate campaigns and let Smart Bidding handle internal allocation.
- Frequent target changes. Each time you significantly change a target CPA or ROAS, the model enters a new learning phase. Change targets too frequently — say, weekly — and the model never completes a full learning cycle. It perpetually stays in an unstable, exploratory state where performance is inconsistent. The rule of thumb from practitioners: don’t change targets by more than 10–15% at a time, and wait at least 2 weeks before making another adjustment.
- Structural changes during learning. Adding negative keywords, changing bidding strategies, or significantly altering ad copy during the learning phase forces a partial or full reset. These interventions are sometimes necessary — but they should be made deliberately, not reflexively in response to short-term variance.
- Signal poisoning through goal misalignment. This is the subtlest stall mode. The flywheel is spinning, but it’s spinning in the wrong direction — consistently and efficiently finding the wrong users. This happens when the conversion signal optimized is a poor proxy for actual business value. The model gets better and better at finding form fillers who never become customers, or discount seekers who churn in 30 days.
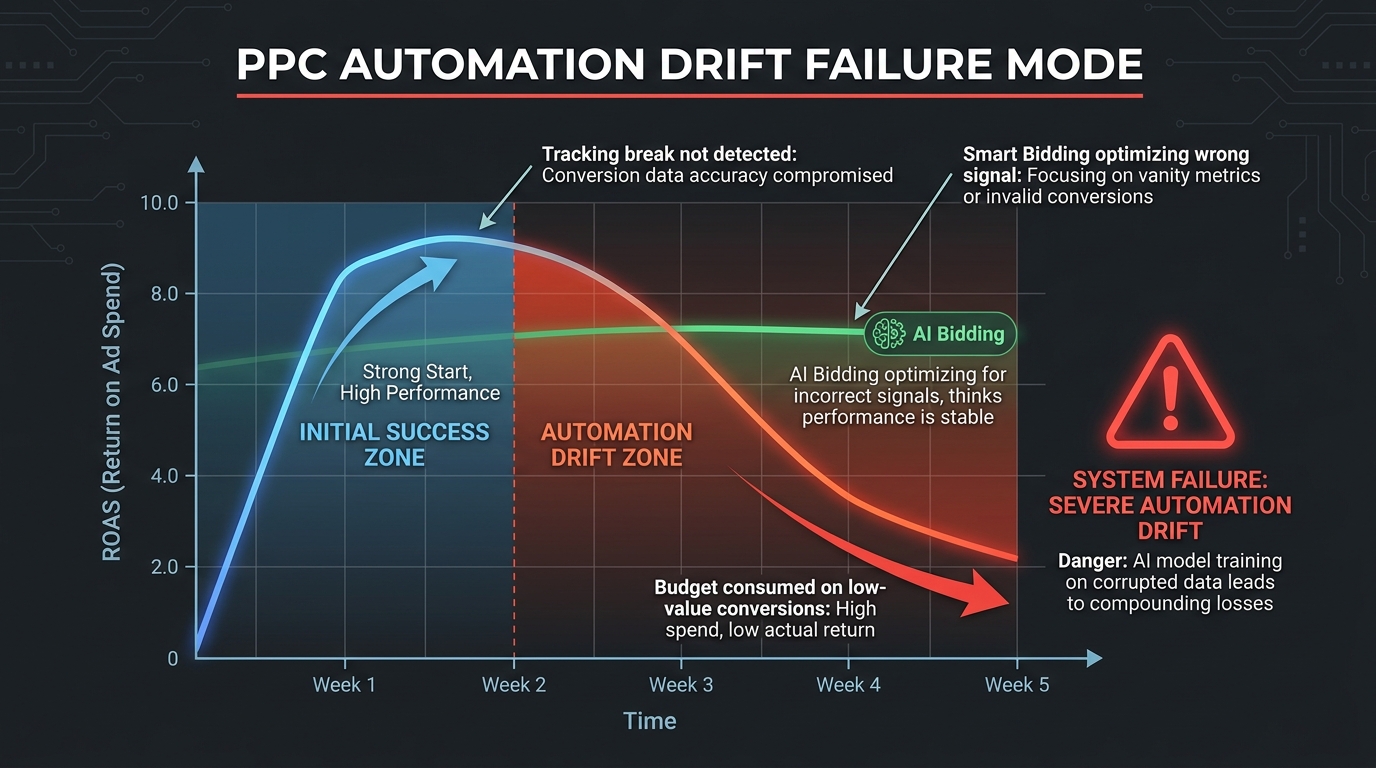
Failure Modes: How Automation Drift Quietly Destroys ROI
Automation drift is the gradual divergence between what the optimization loop is doing and what your business actually needs it to do. It’s insidious because it happens slowly, it’s invisible in standard dashboards, and by the time it’s obvious, significant budget has been wasted.
The Three Primary Drift Patterns
Tracking decay: Your tracking was accurate at launch but has gradually degraded. A JavaScript conflict introduced during a site update is suppressing some conversion fires. A tag container update changed the trigger logic. Consent mode configurations are blocking conversion measurement in markets with high opt-out rates. The model, unaware of the tracking degradation, believes conversion volume has genuinely declined and responds by broadening targeting or shifting budget — accelerating the performance problem while appearing to address it.
Seasonal signal contamination: The model’s recent training window captures a high-performing seasonal period (a sale event, a competitive quiet period, a favorable news cycle). When conditions return to baseline, bids remain calibrated to the peak-performance pattern. CPCs rise as the model overvalues impressions that no longer convert at the historical rate. This is particularly common in Q1, when January bidding is often still calibrated to Q4 holiday conversion patterns.
Competitive landscape shifts: A major competitor enters or exits your primary keyword set. New competitors with high budgets push CPCs up without a corresponding conversion rate change on your account. The model interprets the reduced win rate as a signal to increase bids, which can accelerate cost inflation. Without an external competitive intelligence layer (auction insights monitoring, third-party share-of-voice data), this drift is effectively invisible from inside your account reporting.
The “Hallucinating Performance” Problem
Perhaps the most costly drift pattern is what practitioners have started calling “hallucinating performance” — where the automated system reports strong in-platform metrics that don’t correspond to actual business outcomes. This typically occurs when there’s a mismatch between what the platform measures and what your business cares about.
A classic example: a Performance Max campaign showing a 4.2x ROAS in Google Ads reporting, while the actual ROAS measured through your analytics or CRM sits at 2.1x. The discrepancy comes from attribution inflation — the platform claims credit for conversions that would have occurred organically, or it’s double-counting cross-device journeys. The optimization loop is working perfectly — it’s just optimizing for the platform’s version of performance, not yours.
Leading Indicators of Drift
By the time ROAS shows obvious deterioration, drift has typically been occurring for 4–8 weeks. The early warning indicators to monitor:
- Conversion rate at landing page level (via analytics) declining while platform-reported conversion rate holds steady — suggests tracking inflation
- Increasing gap between impression share and auction insight competitor count — suggests new competitive entrants
- Click-to-conversion time increasing — suggests the model is reaching progressively earlier-funnel users
- Cost-per-click rising with stable conversion rate — suggests bidding pressure without a corresponding quality improvement
- Declining new-to-brand conversion percentage (visible in some campaign types) — suggests the loop is over-indexing on retargeting and abandoning prospecting
Governance That Doesn’t Slow the Loop Down
Here’s the governance paradox every PPC team faces in 2026: the optimization loop needs consistent data and minimal disruption to function properly, but effective oversight requires the ability to intervene quickly when things go wrong. Too much intervention breaks the learning cycle. Too little oversight allows drift to compound unchecked.
The Guardrail Framework
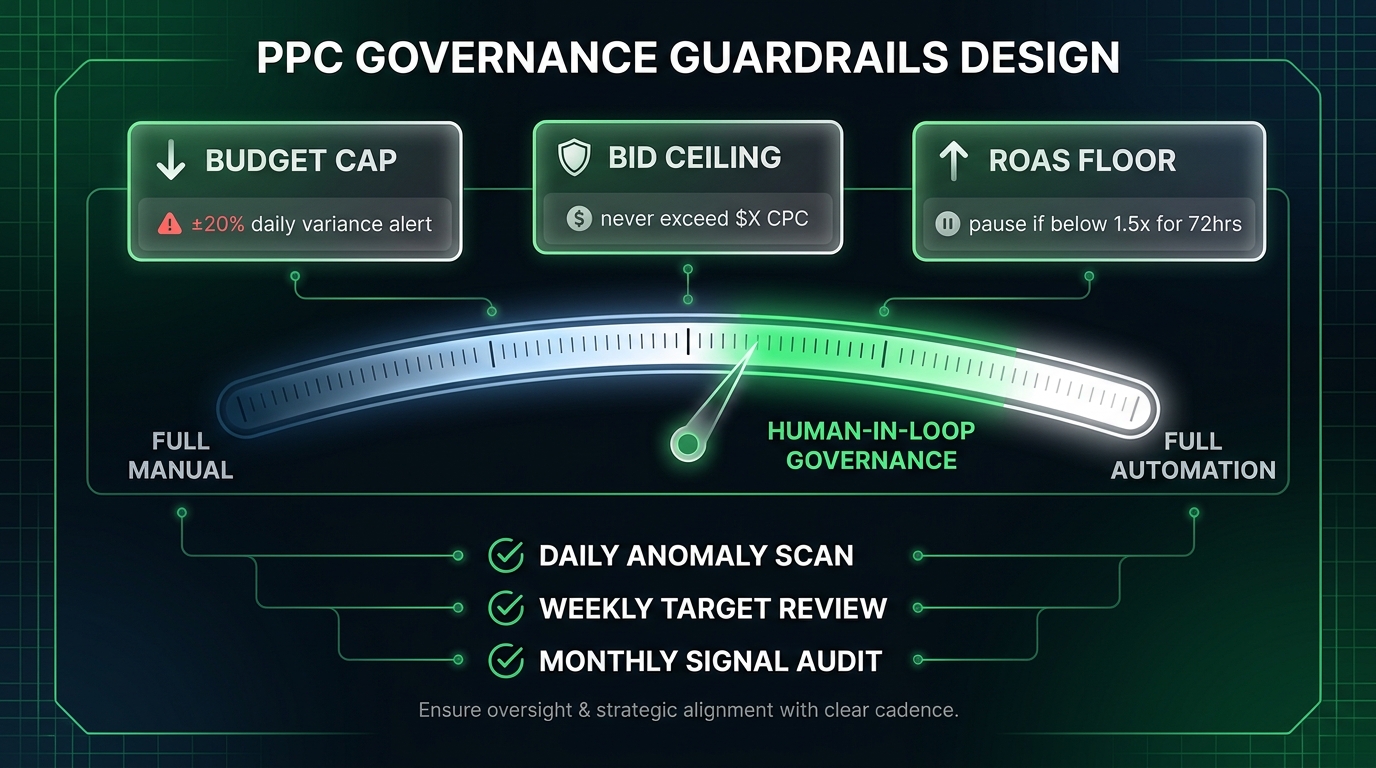
Effective governance doesn’t mean frequent intervention — it means pre-defined thresholds that trigger structured review, not reactive changes. A practical guardrail framework has three tiers:
Tier 1 — Automated circuit breakers: Rules that fire automatically without human involvement. Budget pauses when daily spend exceeds a defined ceiling. Alerts when conversion volume drops more than 30% week-over-week. Automated flags when CPC increases more than 25% in a 72-hour window without a corresponding target change. These rules don’t change campaign behavior — they stop the bleeding and summon human attention.
Tier 2 — Structured human review triggers: Conditions that require a human to assess and decide before any action is taken. ROAS below target floor for seven consecutive days. Learning phase resets occurring more than twice in a 30-day period. Conversion volume per campaign dropping below the Smart Bidding minimum threshold. These triggers demand analysis — not reflexive adjustment.
Tier 3 — Scheduled strategic reviews: Cadenced assessments that happen regardless of performance signals. Weekly signal quality audit (tracking validation, conversion path review, data freshness checks). Monthly target calibration (adjusting CPA/ROAS targets based on business goal evolution, seasonality adjustments, and lag-corrected performance data). Quarterly structure review (reassessing campaign consolidation, audience strategy, and budget allocation logic).
The Intervention Hygiene Rules
When human intervention is warranted, how you intervene matters as much as whether you intervene. The hygiene rules that keep governance from breaking the loop:
- Change only one variable at a time. If you adjust a CPA target, don’t simultaneously add negative keywords or change ad scheduling. You need to be able to attribute subsequent performance changes to a single cause.
- Document every change with a timestamp, rationale, and expected impact. This creates a change log that becomes invaluable when diagnosing drift or explaining performance variance to stakeholders.
- Allow a 14-day observation window after any significant change before evaluating its impact. The bidding model’s response to structural changes is rarely immediate — judging a strategy change after three days is how you generate false conclusions.
- Distinguish between signal problems and performance problems. Most “performance problems” in automated PPC are actually signal problems. Fix the data before adjusting the strategy.
Cadence Design: When to Intervene and When to Leave It Alone
One of the most important skills in managing an always-on optimization loop isn’t knowing how to intervene — it’s knowing when not to. Premature intervention is one of the most common and costly mistakes in AI-driven PPC management.
Understanding Natural Variance vs. Actual Problems
Every PPC campaign has natural performance variance — week-over-week fluctuations in CPA, ROAS, and conversion volume that are caused by normal factors: day-of-week patterns, competitive auction dynamics, content consumption cycles, and plain statistical noise. A campaign targeting a $50 CPA will routinely deliver weeks at $43 and weeks at $58 without anything having fundamentally changed.
The challenge is that this variance looks identical to early-stage drift without longer time windows and appropriate statistical framing. Teams that react to every week-over-week variance dip by changing targets, restructuring campaigns, or switching bidding strategies are systematically disrupting their own loops. They’re creating the very instability they’re trying to resolve.
Practitioners who’ve studied this pattern recommend using a rolling 21-day average rather than week-over-week comparisons as the primary performance benchmark for automated campaigns. A 21-day window smooths enough variance to reveal genuine trends while remaining responsive enough to catch meaningful changes within a reasonable time.
The Optimal Intervention Cadence by Change Type
Different types of changes require different cadences:
- Tracking and signal changes: These can be made at any time, as they improve the model’s inputs without disrupting its current learning state. Enhanced conversion implementations, offline import connections, and micro-conversion additions are low-disruption changes that should be prioritized.
- Target adjustments (CPA/ROAS): No more than every 14 days, and no more than 10–15% per adjustment. Larger target changes should be staged across multiple adjustment periods.
- Budget changes: Google’s own guidance suggests keeping budget changes within 20% of the current daily budget at any one time. Larger budget changes can destabilize the learning phase by dramatically altering the competitive auctions the model participates in.
- Campaign structure changes: Reserve for scheduled quarterly reviews. Ad group consolidations, keyword set changes, and audience layer modifications are high-disruption changes that should never happen as reactive responses to short-term variance.
- Bidding strategy changes: The highest-disruption intervention category. Switching from Target CPA to Maximize Conversions, or from Smart Bidding to manual, resets the learning phase entirely. These changes should be made only when there’s clear evidence that the current strategy is architecturally wrong — not underperforming during a normal variance trough.
Cross-Platform Loop Architecture
The more sophisticated the PPC program, the more likely it’s running across multiple platforms simultaneously — Google, Meta, Amazon, LinkedIn, TikTok. Each platform runs its own optimization loop, with its own signal requirements, learning phase mechanics, and performance models. The challenge is that these loops don’t naturally communicate with each other — and without deliberate cross-platform architecture, they can work against each other.
The Attribution Collision Problem
When a user sees a Google search ad, clicks a Meta retargeting ad, and then converts — both platforms claim the conversion. Each platform’s optimization loop receives a signal that its bid contributed to a conversion, reinforcing bids on both sides. Over time, this mutual credit inflation causes both platforms to overbid for that user type, driving up costs without a proportional increase in actual conversions.
The solution is a unified measurement layer that exists outside any individual platform’s attribution model. Media mix modeling (MMM), incrementality testing, and unified analytics platforms that use data-driven attribution across channels give you a view of what each platform is actually contributing — as opposed to what each platform claims it contributed.
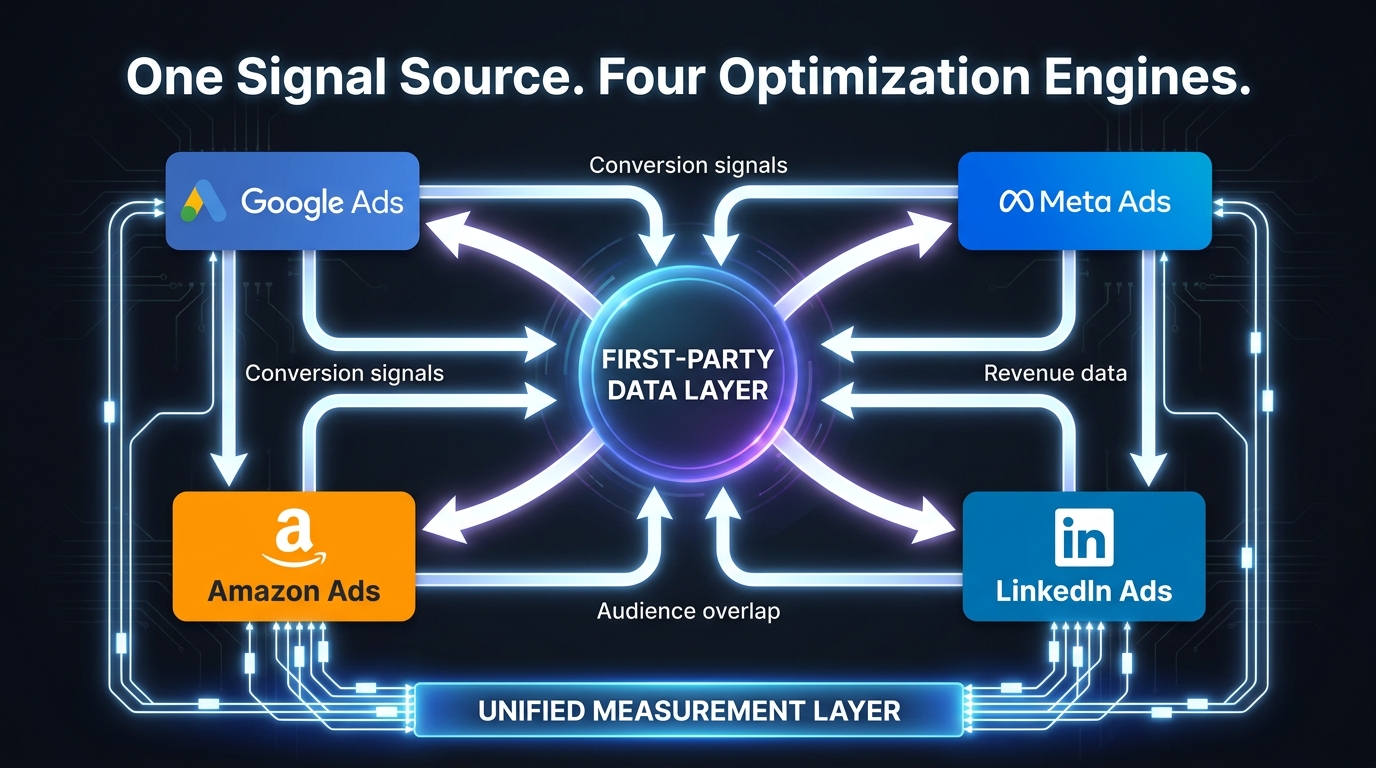
The Unified First-Party Data Layer
The most effective cross-platform loop architecture runs all platform optimization engines from a single first-party data source. A customer data platform (CDP) or CRM-based data hub holds the source-of-truth conversion and audience data, which is then syndicated to each platform’s audience and conversion APIs in platform-appropriate formats.
This means your Google Ads offline conversion imports, your Meta Conversions API signals, and your Amazon Attribution data all derive from the same customer records. When a lead converts in your CRM, that event propagates to all active platforms simultaneously. When a customer segment changes (say, “30-day purchasers” transitions to “60-day purchasers” based on retention cohort analysis), the audience updates push to all platforms from one source rather than requiring manual maintenance in four separate interfaces.
The practical benefit: the optimization loops on each platform are competing against each other on level terms, with equivalent signal quality. The comparative performance you see in reporting is a function of the platform’s actual incremental contribution — not an artifact of one platform having better data access than another.
Budget Orchestration Across Loops
With always-on loops running across multiple platforms, budget allocation becomes a dynamic optimization problem rather than a monthly planning exercise. High-performing periods on one platform (a strong Google search intent cycle) may warrant temporarily pulling budget from lower-performing platforms rather than holding to a rigid cross-channel allocation.
Third-party budget orchestration tools — including Optmyzr, Marin Software, and custom-built scripts — can automate cross-platform reallocation based on performance signals, applying rules like “shift 15% of Meta budget to Google Search if Meta CPA exceeds 120% of target for 5 consecutive days.” These rules must be designed carefully to avoid triggering learning phase resets on the platforms losing budget, but when implemented with appropriate guardrails, they create a meta-loop that sits above the individual platform loops and continuously reallocates capital toward the highest-performing signals.
Measuring Loop Health: Metrics Beyond ROAS
ROAS is the most commonly used PPC performance metric, and it’s also one of the most misleading indicators of optimization loop health. A loop can show excellent in-platform ROAS while slowly degrading in three dimensions that ROAS doesn’t capture: signal quality, reach efficiency, and incremental value.
The Loop Health Scorecard
A comprehensive loop health assessment tracks five dimensions on a weekly basis:
1. Signal integrity score: What percentage of your conversions are being measured accurately? Compare in-platform conversions against CRM-recorded conversions over the same period. A gap of more than 15–20% suggests tracking issues that need investigation. Track this ratio weekly — a sudden change often indicates a tracking break before it shows up in performance metrics.
2. Learning phase ratio: What percentage of your campaigns are in a learning phase on any given week? A healthy program should have no more than 10–15% of campaigns in active learning at any time. Higher rates suggest structural instability — too many recent changes, too many new campaigns, or conversion volume too low to exit learning phase consistently.
3. Conversion lag-adjusted CPA: Your CPA calculated using lag-corrected conversion data rather than raw reported conversions. This requires knowing your lag distribution and applying the correction factor to recent periods where the full conversion window hasn’t closed. This is your actual CPA — the number ROAS dashboards won’t show you until next month.
4. New-to-brand acquisition rate: Are your loops finding new customers or recycling existing ones? A healthy prospecting loop should show at least 40–60% new-to-brand conversions, depending on your business model. Loops that have drifted toward over-retargeting will show this metric declining over quarters, even as platform ROAS appears healthy (retargeting converts cheaper, inflating ROAS).
5. Audience overlap index: Across your campaigns, how much audience overlap exists between your prospecting and retargeting layers? High overlap means your awareness-stage and conversion-stage campaigns are competing against each other in auctions, inflating CPCs and distorting attribution. Many platforms now provide audience overlap tools — use them monthly.
Building the Always-On Team Structure Around the Loop
The shift to always-on optimization loops doesn’t mean PPC teams shrink — it means their skill distribution changes fundamentally. The work that used to consume most of a PPC practitioner’s time (bid adjustments, keyword management, scheduling tweaks) is now automated. The work that the automation cannot do — and that creates the competitive advantage — has moved to data engineering, experiment design, and governance oversight.
The Four Roles in a Loop-Native Team
Signal engineer: Responsible for the integrity and depth of conversion data flowing into bidding systems. This person manages tracking implementation, CRM integration, offline conversion pipelines, and enhanced conversion configurations. They run weekly signal integrity audits and are the first responder when the platform-to-CRM conversion ratio diverges. In smaller teams, this role often sits at the intersection of PPC and marketing operations or analytics.
Experiment designer: Owns the testing roadmap for creative, audience, and structural hypotheses. In an always-on loop, experiments are not optional extras — they’re the primary mechanism for injecting new performance improvements into the loop. This person designs A/B tests for landing pages, runs creative experimentation campaigns, manages audience expansion tests, and maintains the experiment log that connects test outcomes to performance changes over time.
Loop monitor: Responsible for the daily anomaly detection and weekly health scorecard review. This role requires comfort with data analysis — reading dashboards across platforms, identifying statistical deviations, distinguishing natural variance from drift signals, and escalating to human review at the right moments. In larger programs, this role may use automated monitoring tools; in smaller teams, it’s a daily routine of structured dashboard review.
Strategy architect: Sets the high-level allocation logic, target frameworks, and campaign structure principles that the loops operate within. Reviews monthly performance against business outcomes (not just platform metrics), calibrates targets to actual business goals, and manages the cross-platform budget orchestration rules. This is the role that requires the deepest understanding of how loops work — and the discipline to avoid over-intervening.
What “Human-in-the-Loop” Actually Means in Practice
Across industry discussions in 2026, the consensus is clear: the winning posture for PPC teams is not full automation or full manual control, but what practitioners call “human-in-the-loop” governance. This means defining explicit thresholds beyond which human judgment is required before any action is taken, while leaving the loop to self-manage within those boundaries.
The practical implementation: before a campaign goes live, define in writing the specific conditions that will trigger human review (the Tier 1 and Tier 2 guardrails described earlier). Document who is responsible for each type of review. Define the timeline for decision-making after a trigger fires. This structure prevents the two most common failure modes — reactive over-intervention by junior team members, and passive neglect by senior team members who assume the automation is handling everything.
Only about 58% of organizations believe their governance controls keep pace with their AI adoption — and only 18% have risk mitigation covering most of their AI use cases, according to 2026 industry surveys. That gap represents a significant operational risk in programs where automated systems are controlling substantial advertising budgets without adequate oversight structures.
The Loop Is Never “Done” — And That’s the Point
The most important conceptual shift in moving from traditional PPC management to always-on optimization loop architecture is accepting that the work doesn’t end when the campaign goes live. In fact, launch is when the work begins.
In traditional PPC, the campaign manager’s goal was to find and hold the optimal configuration: the right bid, the right keywords, the right schedule. Once found, the task was to maintain it. The optimization loop inverts this entirely. The loop’s value comes from continuous adaptation — its ability to incorporate new signal, respond to shifting competitive dynamics, and improve its model as conditions evolve. A well-engineered loop is never in a static “optimal” state. It’s always in the process of becoming more accurate.
This means the marketer’s job is not to find the final configuration. It’s to maintain the conditions under which the loop can keep improving: signal quality, structural stability, appropriate governance, and a steady supply of new experiments to inject fresh information into the system.
The Compounding Advantage
Teams that internalize this principle early build a durable performance advantage that becomes harder to replicate over time. An account that has been running clean, well-governed optimization loops for 18 months has a different kind of asset than one that launched with the same budget six months ago. The older account’s bidding models have seen more market conditions, incorporated more conversion data, and made more iterative refinements to their audience understanding. That accumulated model intelligence doesn’t appear on a balance sheet — but it shows up in cost-per-acquisition, consistently, month after month.
The early movers in always-on loop architecture — the teams who invested in signal engineering, governance frameworks, and loop-native team structures in 2024 and 2025 — are now running with a structural cost advantage in their auctions. The window to close that gap narrows every quarter.
Actionable Starting Points
If you’re building or rebuilding an always-on PPC optimization loop, the priority order matters:
- Audit your current signal quality before changing anything else. Compare in-platform conversions to CRM-recorded conversions over the last 90 days. The gap you find there tells you more about your optimization loop’s health than any platform dashboard metric.
- Map your conversion lag distribution. Know your characteristic lag curve before you evaluate any performance period. This single data point will change how you read your reporting and how you set your targets.
- Implement enhanced conversions and CRM import if you haven’t. This is the highest-ROI signal improvement available to most advertisers and should be the immediate next step after signal auditing.
- Establish your guardrail framework. Write down the specific conditions that trigger automated alerts, structured human review, and escalation to strategic decision-making. Do this before the next crisis — not during it.
- Design your intervention cadence. Agree on how frequently different types of changes can be made. Make this a team policy, not an individual judgment call.
- Build the loop health scorecard. Start tracking signal integrity, learning phase ratio, lag-adjusted CPA, new-to-brand rate, and audience overlap weekly. Patterns in these metrics tell you where the loop is stressed before the stress shows up in ROAS.
The platforms will keep improving their AI. The auction environment will keep evolving. Competitor budgets will shift. What won’t change is the underlying principle: the optimization loop’s output quality is bounded by the engineering quality of its inputs. Build the signal layer right, govern the loop with discipline, and let the compounding do its work.