

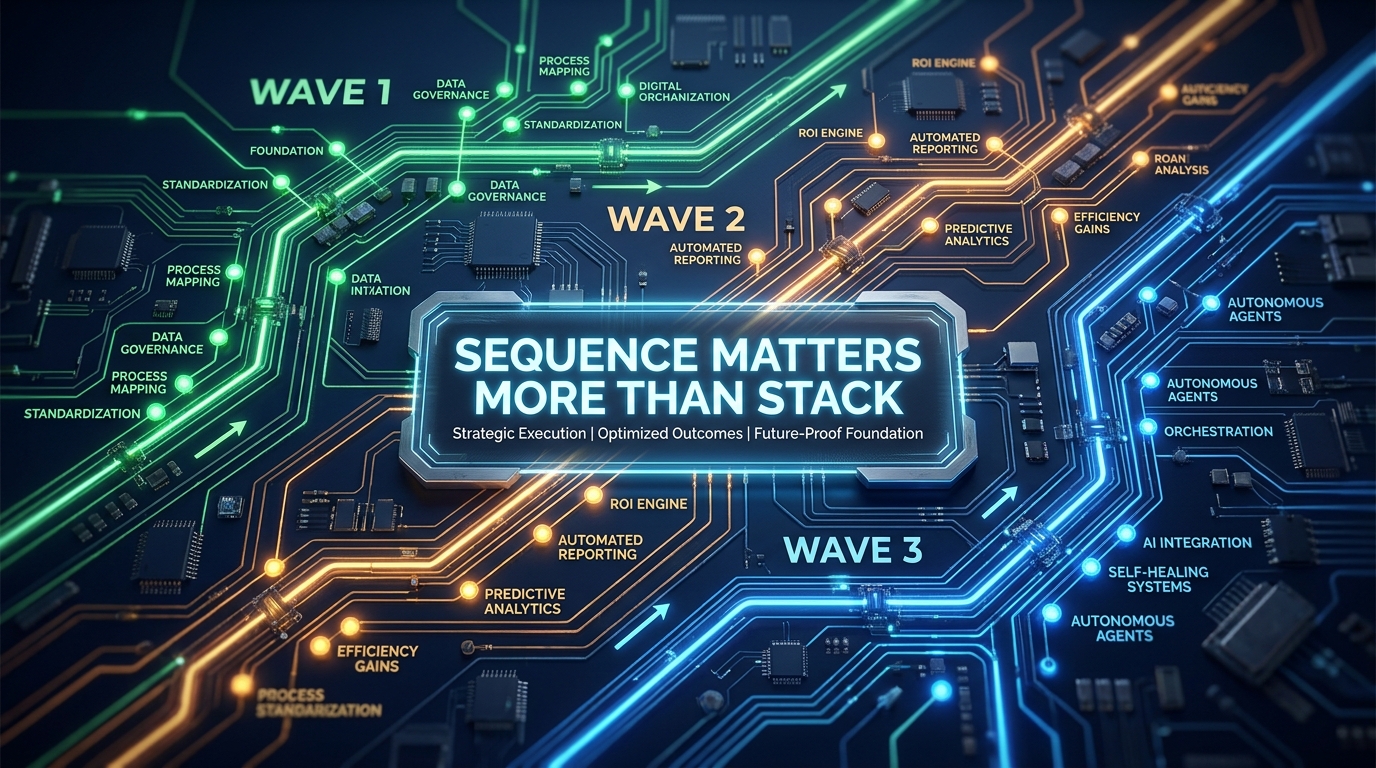

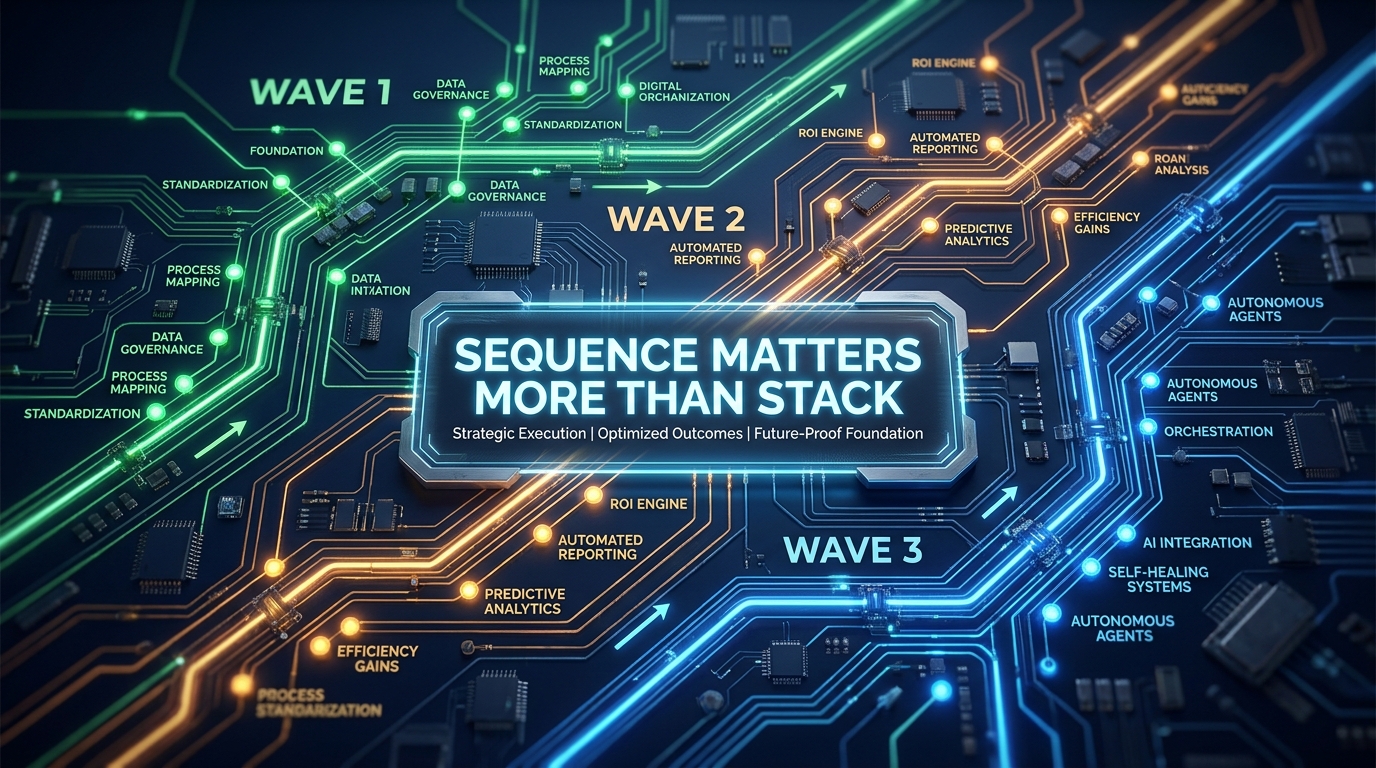
The conversation inside most enterprises considering hyperautomation quickly converges on a single question: which processes should we automate? Teams build long shortlists. Champions argue for their departmental priorities. Vendors demo their favorite use cases. Everyone is focused on the what.
Almost nobody is focused on the when.
That gap is where hyperautomation programs live or die. The global hyperautomation market reached USD $68.2 billion in 2026 and is on a trajectory toward $278.3 billion by 2035 — and yet most enterprises that launch ambitious automation roadmaps see a fraction of the returns they projected. The technology isn’t the problem. The sequencing is.
When you automate the wrong process before the right infrastructure exists to support it, you don’t just fail to gain value — you actively create technical debt, employee resistance, and process complexity that makes future automation harder. When you sequence well, each wave of automation creates a platform that makes the next wave faster, cheaper, and higher-impact. The ROI compounds. The organizational muscle grows. The automation program becomes self-funding.
This post is about sequencing: the order in which you identify, validate, and deploy hyperautomation use cases to maximize early returns while building toward genuine end-to-end transformation. It isn’t a restatement of why hyperautomation matters. It’s a detailed blueprint for the decisions most roadmap guides skip entirely — the ones that determine whether your program delivers a 30% cost reduction in year one or spends 18 months proving it can’t.
Why Most Hyperautomation Roadmaps Start in the Wrong Place
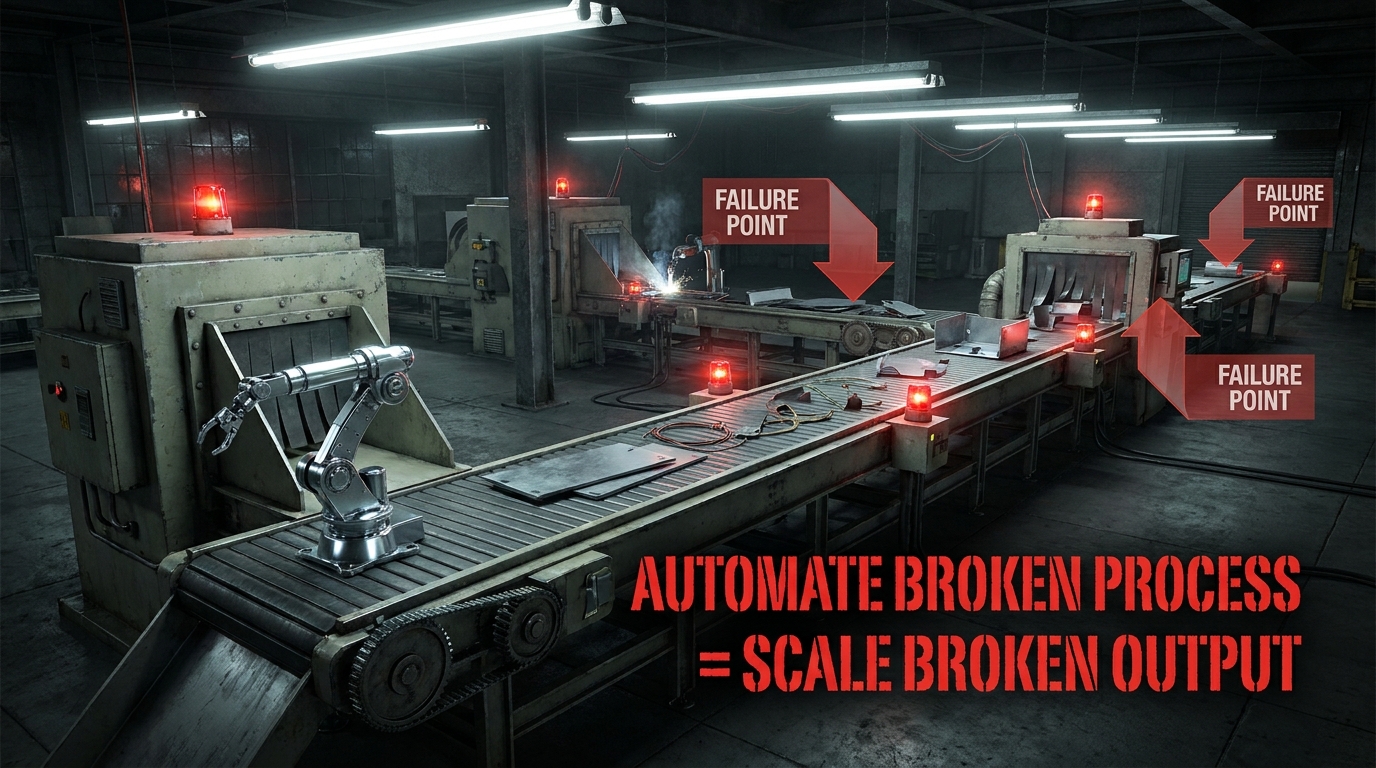
Most hyperautomation roadmaps are built backwards. They start with technology selection — “we’re going with UiPath and Azure OpenAI” — and then go hunting for use cases to justify the investment. Or they start with the highest-visibility pain point and immediately try to automate it, regardless of whether the underlying process is documented, standardized, or even rational.
Both paths share the same flaw: they treat automation as the first step rather than the last step in a sequence of enablers.
The “Automate What’s Visible” Trap
The most common sequencing mistake is selecting use cases based on executive visibility rather than automation readiness. A CFO complains about invoice processing delays. A CHRO is tired of hearing about manual onboarding. These pain points are real — but what often makes them painful isn’t a lack of automation; it’s that the underlying processes are non-standardized, exception-heavy, or built on inconsistent data. Automating them first doesn’t solve the pain. It accelerates the chaos.
Process mining data bears this out consistently. When organizations deploy process intelligence tools before building their automation roadmap, they routinely discover that their “obvious” automation targets have 20 to 40 process variants that nobody documented. Automating the assumed version of the process handles perhaps 60% of real-world cases. The other 40% become expensive exceptions that require human intervention at a higher rate than the manual process did before.
The “Biggest ROI First” Miscalculation
A second common mistake is prioritizing the highest projected ROI use case regardless of what dependencies it requires. A cross-functional customer order management automation looks extraordinary on paper — the potential to reduce cycle time by 60%, eliminate dozens of manual handoffs, and dramatically improve customer experience. So teams chase it first.
What they discover six months in is that the customer order management process touches eight different systems, three of which don’t have APIs, two of which have data quality problems that produce 30% error rates, and one of which is scheduled for replacement in 18 months. The “highest ROI” use case becomes an 18-month integration project with unclear end state. Meanwhile, simpler, faster, high-value opportunities were deprioritized because they looked less impressive on a slide.
The Tool-First Architecture Mistake
A third pattern is committing to a specific technology stack before mapping the process landscape. This is increasingly common because hyperautomation platform vendors are sophisticated salespeople. They offer to run “automation discovery workshops” that, unsurprisingly, result in a list of use cases perfectly suited to their platform’s capabilities. The roadmap becomes constrained by what the tool does well rather than what the business actually needs.
The sequencing discipline that top-performing programs use instead is fundamentally different: start with the process map, then select the use cases, then choose the tools. This sounds obvious. It is practiced far less often than it should be.
The Dependency Stack: What Has to Exist Before Automation Can Succeed
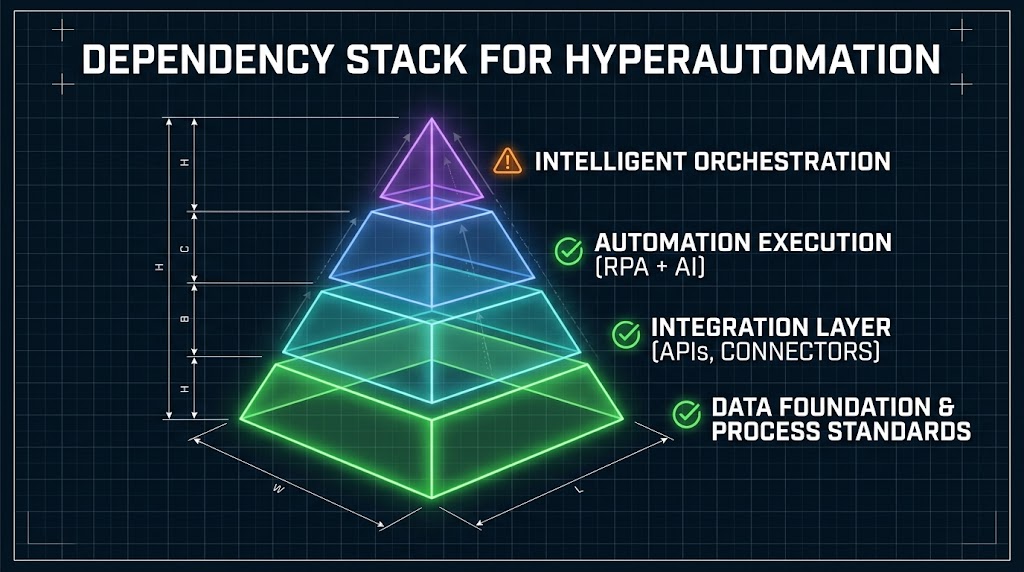
Before any use case can be successfully automated at scale, a set of enabling conditions must exist. Think of these as a dependency stack — a layered foundation where each layer must be sufficiently built before the layer above it can support production-grade automation.
Understanding this stack is the single most important conceptual shift a hyperautomation leader can make. Most programs treat it as a checklist to rush through. The programs that deliver compound ROI treat it as the foundation their entire sequencing strategy is built upon.
Layer 1: Data Foundation and Process Standards
Automation consumes data. If your data is inconsistent, incomplete, or siloed across systems that don’t share a common data model, your automation will produce inconsistent, incomplete, or siloed results — only faster. Before targeting any use case for Wave 1, you need to answer three data readiness questions:
- Is the data this process runs on clean enough? This means consistent formats, acceptable null rates (typically below 5% for automation-critical fields), and no systematic conflicts between source systems.
- Is there a master data record the automation can trust? Customer data, vendor data, product data — if there are five versions of a customer’s address across five systems, the automation will make decisions on five different realities.
- Are the process decision rules documented and stable? Rules-based automation requires rules. If the team currently makes decisions based on institutional knowledge, tribal logic, or “it depends,” the automation will fail on the edge cases that carry the most business risk.
Layer 2: The Integration Architecture
Hyperautomation orchestrates multiple systems. The connective tissue between those systems — APIs, middleware, integration platforms — has to be capable of supporting the volume and reliability demands of automation. A human operator can tolerate a slow API response or a brief system timeout. An automated workflow that processes 10,000 transactions per day cannot afford fragile connections.
This layer doesn’t need to be perfect before you start Wave 1, but the target systems for each use case must have stable, documented, low-latency integration points. Any use case that requires building new integration infrastructure from scratch is not a Wave 1 candidate.
Layer 3: Governance and Change Management Infrastructure
This is the layer most often omitted from technical discussions of hyperautomation, and its absence is responsible for more program failures than any technology issue. Automation governance covers: who owns each bot or workflow, how exceptions are escalated, what monitoring is in place, how changes to the underlying process get reflected in the automation, and who is responsible when an automated process produces an error that propagates downstream.
Without this layer, you don’t have a hyperautomation program. You have a collection of automations that nobody is accountable for. The governance infrastructure doesn’t have to be elaborate in Wave 1, but the ownership model — the roles, the escalation paths, the change control process — must exist before you go live on anything meaningful.
Layer 4: Execution Capability
Finally, the execution layer: the RPA bots, AI models, low-code workflows, and orchestration engines that actually run the automation. This is what most organizations focus on first. In the dependency stack, it’s the last thing you build out for each use case — only after the data, integration, and governance layers are confirmed adequate.
Wave 1 — Foundation Use Cases That Unlock Everything Else (Days 0–90)
Wave 1 is not about glory. It’s about platform-building disguised as quick wins. The use cases you select for the first 60 to 90 days should satisfy two criteria simultaneously: they should deliver measurable, defensible value quickly, and they should establish the technical and organizational infrastructure that makes Wave 2 and Wave 3 faster.
The most reliable Wave 1 candidates share a consistent profile:
- High volume, low variance. The process handles significant transaction volume — hundreds or thousands of instances per week — with limited process variants. The “standard case” covers 85% or more of real-world instances.
- Self-contained data dependencies. The process draws on one or two well-maintained data sources. It does not depend on data quality remediation that hasn’t happened yet.
- Clear success metrics. There is a baseline measurement already in place — cycle time, error rate, cost per transaction — so ROI can be demonstrated clearly within 30 days of go-live.
- Contained blast radius. If the automation fails or produces unexpected output, the impact is reversible and limited. It does not cascade into customer-facing processes or regulatory filings.
The Best Wave 1 Use Cases Across Functions
In Finance, the most reliable Wave 1 candidate is invoice data capture and three-way PO matching. The process is high-volume, heavily rule-based, and the data dependencies (PO numbers, vendor records, GL codes) are typically clean enough in ERP systems to support automation without data remediation. Organizations consistently report 60–80% reduction in manual processing time within the first month.
In IT Operations, password reset and account provisioning automation is the canonical Wave 1 choice. It has near-zero data dependency risk, extremely high ticket volume, and a clear baseline metric (average handle time per ticket). It also builds something critical for later waves: operational confidence in the automation platform from the IT team that will support it.
In HR, new employee onboarding task orchestration — automatically triggering IT account creation, payroll setup, benefits enrollment reminders, and document collection — is a strong Wave 1 candidate because it’s process-complete (you can automate the full chain, not just one step) and the success metric (time-to-productivity for new hires) is visible to senior leadership.
In Customer Operations, first-contact data capture and case routing — automatically ingesting email or form submissions, extracting key data fields, classifying intent, and routing to the right queue — is an excellent Wave 1 target because it creates immediate value for agents (less manual triage) while building the AI classification model that future waves will rely on for much more complex decision-making.
What Wave 1 Is Really Building
The business case for Wave 1 is the quick wins. But the real output of Wave 1, properly executed, is four things that money can’t easily buy later: (1) a tested automation platform that your IT team understands and trusts, (2) a governance model that has been stress-tested against real exceptions, (3) a coalition of business owners who have seen automation deliver results in their area and are now advocates rather than skeptics, and (4) baseline data across several processes that will feed the business case for Wave 2 investments.
Organizations that rush through Wave 1 in an attempt to get to the “bigger” use cases typically find that their Wave 2 is plagued by the governance and trust problems they never resolved in Wave 1. The programs that treat the first 90 days as foundation-building — not just quick-win harvesting — consistently outperform over the full 12-month arc.
Wave 2 — The ROI Engine: High-Volume, High-Impact Processes (Months 3–6)
Wave 2 is where hyperautomation programs either prove their business case or collapse under the weight of their own complexity. The use cases here are larger, more integrated, and more transformative — and they are only accessible because Wave 1 built the infrastructure and credibility to support them.
The defining characteristic of Wave 2 use cases is cross-system orchestration. These are processes that span multiple departments, consume data from multiple source systems, and require a combination of RPA, AI, and human-in-the-loop decision points. They are not automatable in a single sprint. They require proper dependency management — which is exactly what Wave 1 was building toward.
The ROI Profile of Wave 2
Wave 2 is where the financial model shifts from “saving hours” to “saving processes.” The difference is meaningful. Wave 1 automation typically delivers cost savings by reducing manual handling time on individual transactions — say, 5 minutes per invoice times 2,000 invoices per month. Wave 2 delivers savings by eliminating entire workflows that exist only because data can’t move automatically between systems — approval chains, status-check meetings, reconciliation cycles, manual reporting runs.
Organizations consistently report that Wave 2 returns run at 3 to 5 times the ROI multiple of Wave 1 in absolute dollar terms. The processes are bigger, the time savings are measured in days not minutes, and the indirect benefits (faster cash collection, shorter order cycles, better customer experience) create value that doesn’t appear on the direct cost savings line but shows up clearly in business outcomes.
Strong Wave 2 Candidates
End-to-end accounts payable processing is the natural evolution of the invoice capture use case from Wave 1. Once the data capture and matching logic is running, Wave 2 extends it into exception handling, vendor communication, payment scheduling, and cash flow reporting — converting a multi-day process into something that runs in hours with minimal human involvement.
Employee lifecycle management extends the onboarding automation from Wave 1 into the full employee journey: internal transfers, promotions, role changes, and eventually offboarding. Deutsche Telekom Services Europe reported an 80% improvement in HR efficiency after extending their automation coverage across the full employee lifecycle — a result that was only achievable because the foundational onboarding automation had already been proven and the data integration to HR systems was already in place.
Order-to-cash orchestration is one of the highest-value Wave 2 targets in product companies. It encompasses order receipt, inventory check, credit verification, fulfillment trigger, shipment notification, and invoice generation — a sequence that typically involves four to six different systems and creates enormous cycle time when run manually. When automated as a connected workflow, order-to-cash cycle times typically fall by 40 to 60%, with direct impact on working capital and customer satisfaction scores.
Intelligent document processing at scale — classifying, extracting, validating, and routing contracts, compliance documents, or customer correspondence — becomes viable in Wave 2 because the AI models trained on the classification tasks in Wave 1 (the customer case routing, the invoice categorization) now have enough training data and operational tuning to handle more complex document types reliably.
The Sequencing Discipline Within Wave 2
Even within Wave 2, sequencing matters. Use cases that feed other Wave 2 use cases should go first. If your order-to-cash automation depends on clean customer master data, and your customer data cleanup effort is also a Wave 2 initiative, the data initiative must go first — even if it has lower standalone ROI. Ignoring internal Wave 2 dependencies creates the same class of problem as ignoring Wave 1 dependencies entirely: the downstream use case fails to perform because the upstream enabler isn’t ready.
Wave 3 — Intelligent Orchestration and Cross-Function Automation (Months 6–12)
By month six of a well-executed hyperautomation program, something important has happened: the organization has shifted from running automation to running on automation. Processes that required daily human coordination now run continuously. Reporting that consumed analyst hours is generated in seconds. The operational baseline has shifted.
Wave 3 takes that new baseline and builds on top of it with the use cases that require genuine intelligence — not just rule-following, but learning, prediction, and adaptive decision-making. These are the use cases that simply cannot run without the foundation that Waves 1 and 2 built.
What Makes Wave 3 Different
The distinguishing feature of Wave 3 automation is that the decisions being automated are not fully determined by explicit rules. They involve judgment, pattern recognition, predictive inference, or optimization across competing variables. These are the territory where AI and machine learning move from supporting roles to primary decision engines.
Crucially, Wave 3 AI models depend on data produced by the automation infrastructure built in Waves 1 and 2. A demand forecasting model needs clean, timely inventory and sales data — the kind of data that only exists in structured, reliable form once the supply chain data workflows from Wave 2 are running. A customer churn prediction model needs behavioral signals from customer interactions — signals that are only captured consistently once the customer contact automation from Wave 2 is logging structured event data.
This is the most underappreciated sequencing dependency in hyperautomation: Wave 3 AI models are fed by Wave 2 data pipelines, which are cleaned by Wave 1 foundations. Skip the foundations, and you have no clean data for Wave 2. Skip Wave 2, and you have no structured signal data for Wave 3. The cascade is real, and it’s irreversible without going back and doing the foundational work properly.
High-Impact Wave 3 Use Cases
Predictive demand sensing and inventory optimization can, once the underlying supply chain data is automated and clean, reduce safety stock requirements by 20–30% while simultaneously reducing stockout rates. The model trains on automated inventory event data from Wave 2, then begins generating recommendations that feed back into purchasing and logistics workflows.
Dynamic pricing and revenue management in B2B or B2C contexts becomes actionable in Wave 3 because the order-to-cash data from Wave 2 provides real-time visibility into margin per transaction, demand elasticity signals, and competitive context. What was previously a quarterly pricing review process becomes a continuously adjusted optimization.
Intelligent exception management — where an AI model learns from human decisions on escalated exceptions and begins handling them autonomously over time — is a powerful Wave 3 pattern. In Wave 1 and Wave 2, exceptions were routed to humans. In Wave 3, the accumulated history of how humans resolved those exceptions becomes training data for an AI that can handle a growing percentage of them without escalation. The automation rate increases over time without additional engineering work.
Cross-function process orchestration with real-time reoptimization — where an AI orchestrator monitors multiple simultaneous process streams and dynamically reprioritizes work across functions based on business conditions — represents the ceiling of Wave 3 ambition. This is what “end-to-end process transformation” actually means in practice, and it’s only achievable after 9 to 12 months of foundation-building.
The Value-Complexity Matrix: How to Score and Rank Your Candidate Use Cases
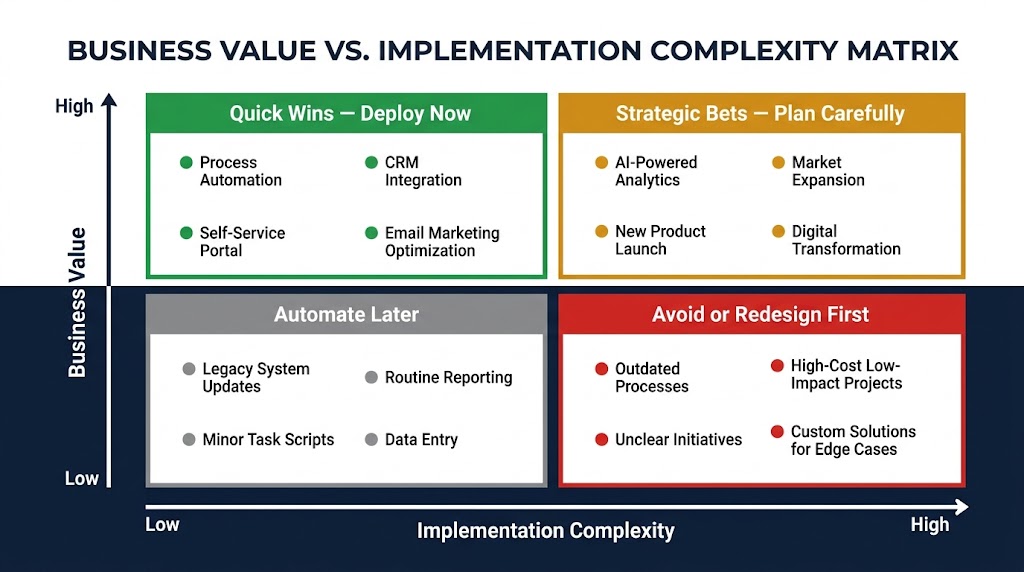
The wave framework provides strategic structure. The value-complexity matrix provides the tactical scoring mechanism for placing individual use cases within that structure. While many variants exist, the most useful version for sequencing decisions scores each candidate use case across five weighted dimensions.
The Five Scoring Dimensions
1. Business Impact (Weight: 30%) — Quantify the expected value of automating this process. This includes direct cost savings (FTE hours eliminated or redeployed, error correction costs avoided, rework eliminated), revenue impact (cycle time reduction that accelerates revenue recognition, conversion improvements, customer retention), and risk reduction (compliance failure costs avoided, audit cost reduction). Score 1–5, where 5 means measurable seven-figure annual impact.
2. Data and Process Readiness (Weight: 25%) — How clean and documented is the current state? A score of 5 means the process has fewer than three variants, runs on data sources with less than 5% null or error rates, and has documented decision rules that cover 90%+ of real-world cases. A score of 1 means the process is poorly documented, has 20+ variants, and relies on institutional knowledge for key decision points.
3. Technical Feasibility (Weight: 20%) — How difficult is the integration and automation implementation? Score based on the number of systems involved, availability of APIs, stability of those systems (scheduled for replacement, major version changes), and the availability of existing automation components or templates that can accelerate delivery.
4. Speed to Value (Weight: 15%) — How quickly after go-live decision can the automation deliver measurable results? Use cases that can show ROI within 30 days of go-live score 5. Use cases with 6-month or longer value realization timelines score 1. Speed to value matters disproportionately in Wave 1 because the program’s continued funding depends on demonstrating early returns.
5. Dependency Risk (Weight: 10%) — How many other automation use cases depend on this one being in place first? A use case that is a prerequisite for three other Wave 2 use cases has a low dependency risk score (meaning high risk if skipped), and should be prioritized accordingly. Use cases that are standalone and don’t enable anything else score low on this dimension.
Using the Matrix to Make Sequencing Decisions
Once scored, plot use cases on the standard 2×2 matrix with business impact on the Y-axis and implementation complexity on the X-axis (which is the inverse of the technical feasibility and data readiness scores combined).
The quadrant placements then directly map to wave assignments: Quick Wins (high value, low complexity) belong in Wave 1. Strategic Bets (high value, high complexity) belong in Wave 2 or Wave 3, but only after the dependency work required to reduce their complexity has been done. Low-priority items (low value, low complexity) go in the backlog for a later wave or are assigned to citizen-developer teams rather than the core hyperautomation program. Poor candidates (low value, high complexity) are either deprioritized indefinitely or redesigned before being reconsidered.
The critical refinement that most matrix frameworks miss is the dependency override rule: a use case that scores as “Wave 2” on value and complexity but is a prerequisite for three Wave 1 use cases should be promoted to Wave 1 regardless of its standalone score. The sequencing logic must account for what enables what, not just what scores highest in isolation.
Industry-Specific Sequencing Patterns
While the wave framework and value-complexity matrix apply universally, the specific use case content of each wave varies significantly by industry. Here are the sequencing patterns that consistently produce fast ROI in three of the highest-adoption sectors.
Financial Services: Automate the Back Office Before the Front
In banking and insurance, the temptation is to start hyperautomation with customer-facing processes — loan origination, claims processing, customer onboarding. These are highly visible, politically popular, and frequently cited as priorities by senior leadership. They are almost never the right Wave 1 choice.
Customer-facing processes in financial services are compliance-sensitive, exception-heavy, and deeply dependent on clean, real-time customer data. The data foundation and integration architecture required to automate them reliably almost never exists in Wave 1. Organizations that attempt Wave 1 in customer-facing financial processes typically spend 70% of their implementation time dealing with data quality issues and compliance edge cases, and go live months behind schedule with automation rates far below what was projected.
The proven financial services sequence is: Wave 1 — regulatory reporting data extraction, accounts payable automation, and IT operations workflows. These build the data governance models and integration patterns that financial services automation requires. Wave 2 — loan or claims data processing automation, KYC data aggregation, and trade reconciliation. With the governance and integration foundations in place, these high-complexity use cases become manageable. Wave 3 — credit decisioning support, fraud detection augmentation, and predictive customer risk modeling. These require the training data that Waves 1 and 2 have been generating.
The IBM Finance example is instructive: they reported a greater than 90% reduction in finance-close cycle time after automating their financial close process — but that result required first standardizing their chart of accounts data and building the integration layer between their ERP and reporting systems. The automation itself was not the hard part. The foundation was.
HR and Talent Operations: Sequence Around the Employee Journey, Not the Org Chart
HR automation is often organized around departmental functions — recruiting automation, compensation automation, L&D automation — because HR is organized that way. This structure optimizes for internal HR convenience, not for employee experience or automation dependency logic.
The high-ROI sequencing pattern in HR is to follow the employee journey chronologically: start where employees enter the organization (onboarding), then automate the recurring transactions they generate throughout employment (time and attendance, expense, benefits changes), then tackle the analytical processes that evaluate and develop talent (performance data aggregation, skills gap analysis), and finally the exit and transition workflows that close the loop.
This sequence works because each stage of the journey produces structured data about employees that the next stage’s automation can use. Onboarding automation creates clean employee records. Those clean records make payroll and benefits automation far more reliable. The payroll and benefits data — now clean and structured — feeds the compensation benchmarking and retention risk models in Wave 3. The dependency chain is the employee data lifecycle itself.
Deutsche Telekom Services Europe’s widely cited 80% HR efficiency improvement came specifically from automating across the employee journey holistically rather than optimizing individual HR functions in isolation. The efficiency gains were amplified by the cross-stage data reuse that the journey-sequential approach enabled.
Supply Chain and Operations: Start With Visibility, Then Velocity
Supply chain hyperautomation has one overriding sequencing rule: you cannot automate decisions about inventory, fulfillment, or demand without first having visibility into real-time inventory, fulfillment, and demand signals. This sounds obvious. It is violated constantly.
Organizations frequently attempt to automate reorder points or safety stock calculations before they have reliable, real-time inventory event data. The result is automation built on stale or unreliable signals that generates incorrect reorder triggers — sometimes creating overstock situations, sometimes creating the stockouts they were designed to prevent.
The high-ROI supply chain sequence begins with Wave 1 focusing on data visibility automation: automated inventory event capture, supplier confirmation ingestion, and demand signal aggregation from point-of-sale or ERP systems. This wave doesn’t automate any decisions — it automates the data collection that makes all future decisions more reliable.
Wave 2 then automates execution workflows based on the clean, real-time data from Wave 1: purchase order generation, shipment scheduling, exception flagging for delayed deliveries, and supplier communications. With reliable input data, these workflows perform at high accuracy and low exception rates.
Wave 3 moves to predictive optimization: demand sensing, dynamic safety stock adjustment, supplier lead time modeling, and network-level inventory rebalancing. These require the 3 to 6 months of clean, automated supply chain event data that Wave 1 started generating — data that simply doesn’t exist in structured, reliable form at the start of the program.
The Hidden Sequencing Killers Nobody Warns You About
Even well-designed hyperautomation roadmaps fail for reasons that don’t appear in the planning documents. These are the operational sequencing traps that sit between the strategy and the results.
The Organizational Sequencing Problem
Most hyperautomation programs sequence their technology deployments carefully but sequence their organizational change work poorly. They build the automation, then try to get organizational adoption. This is backwards.
The change management work — stakeholder alignment, role redesign, training, new SOP documentation — needs to run in parallel with automation development, not after it. When go-live happens, the organization should already be aligned, trained, and operationally ready to work with the new automated process. When change management is sequenced after technology, go-live is followed by weeks or months of low adoption, high exception rates, and manual workarounds that effectively cancel the efficiency gains the automation was supposed to deliver.
The Data Quality Debt Spiral
When an automation relies on data that is 85% clean — acceptable for human operators who can spot-check and correct — it produces output that is 85% correct. In a Wave 1 process handling 2,000 transactions per month, that means 300 incorrect outputs per month that each require human remediation. The remediation cost can easily exceed the automation savings.
The sequencing implication is that data quality remediation is not a “parallel workstream” or a “future phase.” It is a hard prerequisite for each use case that depends on that data. Scheduling automation go-live before data quality benchmarks are met is one of the most reliable ways to damage program credibility in the early waves, when credibility is most fragile.
The Platform Scalability Cliff
Wave 1 automation deployments often run on platforms that were sized and licensed for the proof-of-concept volume — a few hundred transactions per day, a handful of concurrent bot sessions. When Wave 2 use cases bring significantly higher volume, the platform hits capacity constraints: latency increases, bots queue up, SLAs are missed, and what was sold internally as “enterprise-grade automation” becomes unreliable.
The right sequencing approach is to conduct platform capacity planning in Wave 1 based on the projected volume of the full 12-month roadmap, not just the immediate Wave 1 use cases. This requires knowing your Wave 2 and Wave 3 use cases at a high level — even if the detailed specifications come later — so that the platform architecture is right-sized from the beginning.
The Champion Dependency Risk
Many hyperautomation programs are heavily dependent on a single internal champion — a COO who “gets it,” a digital transformation director who owns the program, a particularly engaged process owner in Finance. When that person moves, is reorganized out of the program, or simply burns out, programs that haven’t distributed ownership across multiple wave sponsors stall entirely.
The sequencing implication is deliberate: in Wave 1, actively build secondary champions in each function touched by automation. The goal isn’t just to automate processes — it’s to create a network of business owners who have personally seen ROI from automation and who carry that advocacy independently of the program’s original champion structure.
Measuring Momentum — KPIs That Tell You Whether Your Sequence Is Working
Measuring hyperautomation ROI requires different metrics at different stages of the wave sequence. Using Wave 3 metrics to evaluate Wave 1 performance — asking whether Wave 1 is driving “intelligent process optimization” when it’s three weeks old — creates false negatives that can kill the program’s momentum with leadership before it has had time to deliver.
Wave 1 Metrics: Proving the Foundation
At 30 and 60 days post-go-live, Wave 1 KPIs should focus on automation stability and baseline performance:
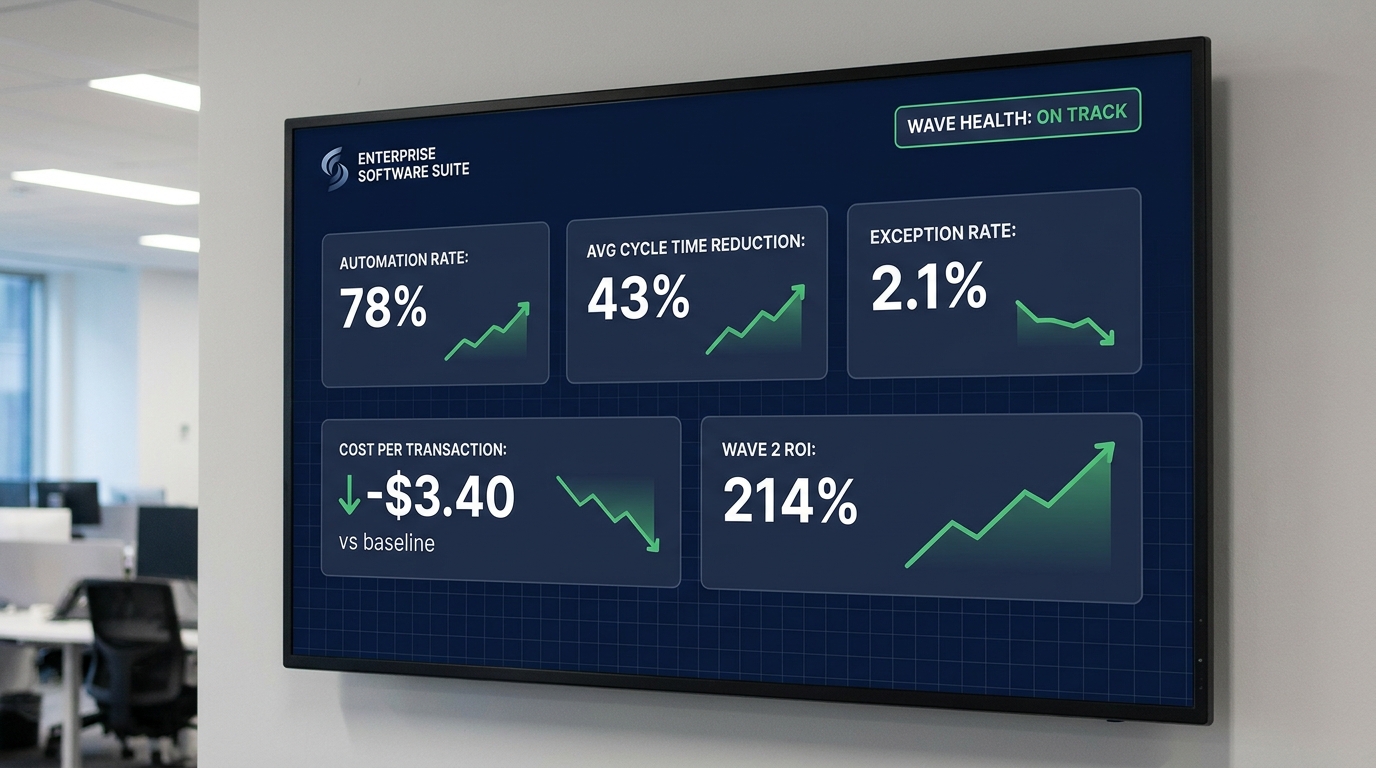
- Automation rate: percentage of process volume handled by automation without human intervention. Target range: 70–85% in the first 30 days, improving to 88–93% by day 60 as edge cases are handled.
- Exception rate: percentage of automated cases that require human escalation. High exception rates in Wave 1 (above 15%) signal either data quality problems or process variant issues that must be resolved before scaling.
- Cycle time reduction: how much faster is the automated process compared to the pre-automation baseline? This should be measurable immediately and is typically the headline metric for stakeholder reporting.
- Bot uptime and SLA compliance: is the automation running reliably? Availability below 95% in Wave 1 signals platform or integration issues that will compound severely in Wave 2.
Wave 2 Metrics: Proving the Business Case
By months three through six, the metrics shift to business outcome impact:
- Cost per transaction: tracked against the pre-automation baseline and against the Wave 1 benchmark. Wave 2 should deliver 40–60% cost-per-transaction reductions in the processes it covers.
- Process-level cycle time: not just individual task time, but end-to-end process completion time. Order-to-cash cycle time in hours vs. the previous days. Finance close time in hours vs. the previous week.
- Error and rework rate reduction: the percentage of process outputs that required correction post-automation compared to the pre-automation baseline. Best-performing Wave 2 programs reduce error rates by 70–90% versus the manual process.
- FTE redeployment or capacity addition rate: rather than headcount reduction (which carries political risk), measure how much additional transaction volume the organization can now handle with the same headcount — a metric that plays well with both finance teams (productivity leverage) and HR teams (growth without hiring).
Wave 3 Metrics: Proving Intelligent ROI
In the second half of the first year, the measurement focus expands to business intelligence and adaptive performance:
- Exception handling autonomous rate: the percentage of process exceptions the AI model resolves without human escalation. This metric should improve each month as the model learns from accumulated decision data.
- Predictive accuracy: for demand forecasting, churn prediction, or fraud detection models — tracked against actual outcomes. Improvement here drives downstream financial benefits that compound over time.
- Cross-function process throughput: the end-to-end performance of connected cross-functional workflows — from customer inquiry to order to fulfillment to invoice to payment — measured as a single flow rather than as individual departmental KPIs.
- Program ROI multiple: cumulative quantified benefits divided by total program investment. Well-sequenced programs consistently hit a 200–300% ROI multiple by month 12; some high-performing programs in well-structured domains report ROI multiples of 300–330% by the end of the first year.
Building the Coalition: Who Needs to Own Each Wave
Technology does not sequence itself. The wave structure requires human ownership at every stage, and the right ownership model shifts significantly from Wave 1 to Wave 3. Keeping the same organizational structure throughout the program is a common mistake that creates bottlenecks as the scope expands.
Wave 1 Ownership: The Tight Team
Wave 1 should be owned by a small, empowered team with clear executive sponsorship and minimal committee overhead. The team needs: a hyperautomation program lead (technical and strategic authority), one or two process owners from the functions being automated (decision authority on process design), a platform architect (technical design and integration), and a change management lead (organizational readiness). This is a team of four to six people who can move fast and make decisions without consensus-building delays.
The executive sponsor for Wave 1 needs to be someone who can clear organizational obstacles quickly — budget approvals, IT access, system change requests. A mid-level program manager with no budget authority cannot effectively sponsor Wave 1. The right Wave 1 sponsor is typically a COO, CFO, or CIO who has direct authority over both the business functions being automated and the IT resources required to support them.
Wave 2 Ownership: The Expanded Center of Excellence
By Wave 2, the program needs more coverage without losing the speed and decision-making agility of Wave 1. The answer is a Center of Excellence (CoE) model: a core team that maintains platform standards, governance, and cross-functional coordination, with embedded “automation leads” in each major function who own their departmental use case backlog and serve as the business-side decision-makers for new automation deployments.
The CoE structure also formalizes the feedback loop between operational performance and roadmap decisions. Wave 2 performance data should directly inform which Wave 3 use cases get prioritized — and the CoE is the organizational mechanism that ensures that data is reviewed, interpreted, and acted on rather than sitting in a dashboard nobody reads.
Wave 3 Ownership: Governance at Scale
By Wave 3, the hyperautomation program has become organizational infrastructure. The governance model needs to mature accordingly. This means a formal automation governance board with cross-functional representation, documented policies for new use case approval and retirement, clear SLAs for automation performance that are owned by specific operational leaders, and a continuous improvement process that identifies and addresses performance degradation in deployed automations before it cascades into business problems.
Organizations that reach Wave 3 without this governance maturity typically face a “automation sprawl” problem — dozens of deployed automations, some no longer maintained, others running on outdated logic, none with clear ownership accountability. The remediation cost of automation sprawl can consume the ROI gains of an entire wave. Preventing it requires governance investment that tracks the automation lifecycle from deployment to eventual retirement.
Sequencing as Competitive Strategy, Not Just Program Management
The hyperautomation programs that will define competitive advantage over the next three to five years are not the ones that moved fastest in month one. They are the ones that moved most intelligently — building the foundations that allow later waves to be faster, more impactful, and more self-sustaining than anything the first wave could have delivered alone.
Sequencing is not a project management detail. It is the strategic logic that determines whether your hyperautomation investment compounds or stalls. Organizations that treat their automation roadmap as an ordered system of dependencies — where each use case exists not just for its own value but for what it enables in the next wave — consistently outperform those that chase the highest-ROI use case regardless of readiness.
The framework is clear: build the dependency stack before you run the bots. Win Wave 1 to fund and accelerate Wave 2. Let Wave 2 data feed Wave 3 intelligence. Measure the right KPIs at each stage. Build the coalition progressively. And never let technology sequencing outrun organizational readiness.
The $68 billion hyperautomation market is growing at nearly 17% annually — but the organizations capturing a disproportionate share of that value are not necessarily the ones with the most sophisticated technology. They are the ones who figured out the right order to build it in.
Actionable takeaways for your next 30 days:
- Run a process mining or structured discovery exercise to map your real-world process variants before selecting any Wave 1 use cases.
- Assess each Wave 1 candidate against the four dependency stack layers — data readiness, integration architecture, governance model, and execution capability — before committing to a go-live date.
- Score your use case shortlist using the five-dimension matrix and apply the dependency override rule to surface any foundation use cases that are blocking high-value targets.
- Establish Wave 1 KPI baselines before go-live, not after. You cannot prove ROI without a documented pre-automation baseline.
- Identify your Wave 2 and Wave 3 use cases at a high level now, and use them to right-size your Wave 1 platform architecture.