
Amazon announced its 2026 fee changes with characteristic confidence. The headline number — an average FBA fulfillment fee increase of $0.08 per unit — was framed as “less than 0.5% of an average item’s selling price.” That framing is technically accurate and almost entirely misleading.
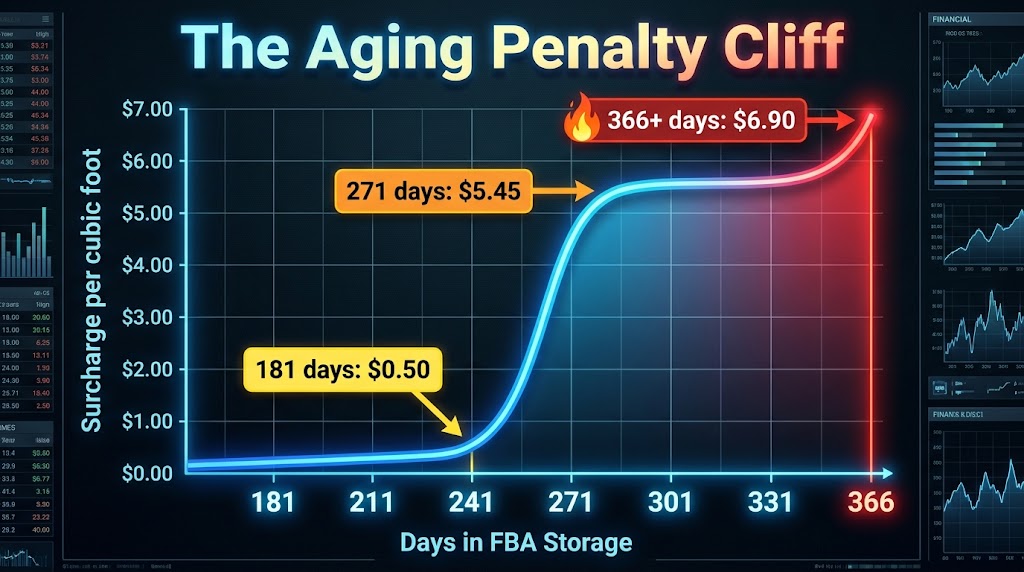
The $0.08 is the mean across all size and price tiers. It says nothing about the 3.5% fuel and logistics surcharge added in April 2026 — which alone averages an additional $0.17 per unit on US FBA orders. It says nothing about expanded inbound placement fees that can hit $1.58 per unit for sellers using minimal warehouse splits. It says nothing about the aged inventory surcharge that jumps from $0.50 per cubic foot at day 181 to $5.45 per cubic foot at day 271 — a 990% escalation in 90 days.
The real story of Amazon’s 2026 fee environment is not one big change. It is a compounding system of interdependent charges, each designed to incentivize seller behavior that benefits Amazon’s logistics network. The sellers who are protecting margin right now are not the ones haggling with Amazon over fee rates. They are the ones who understand the full system — and who have rebuilt their operational decisions around it.
This article maps every significant fee vector active in 2026, quantifies the real per-unit impact, and lays out a tactical framework for defending margin at the SKU level — from inbound strategy to inventory velocity management to fulfillment channel selection.
The Full Fee Stack: What Amazon Reports vs. What You Actually Pay
Most fee analyses start and stop with referral fees and FBA fulfillment fees. Those are the two charges Amazon reports most prominently — and they are, taken individually, the largest single line items. But they do not represent the full cost of selling on Amazon in 2026. The full stack looks substantially different.
The Standard Fee Layers
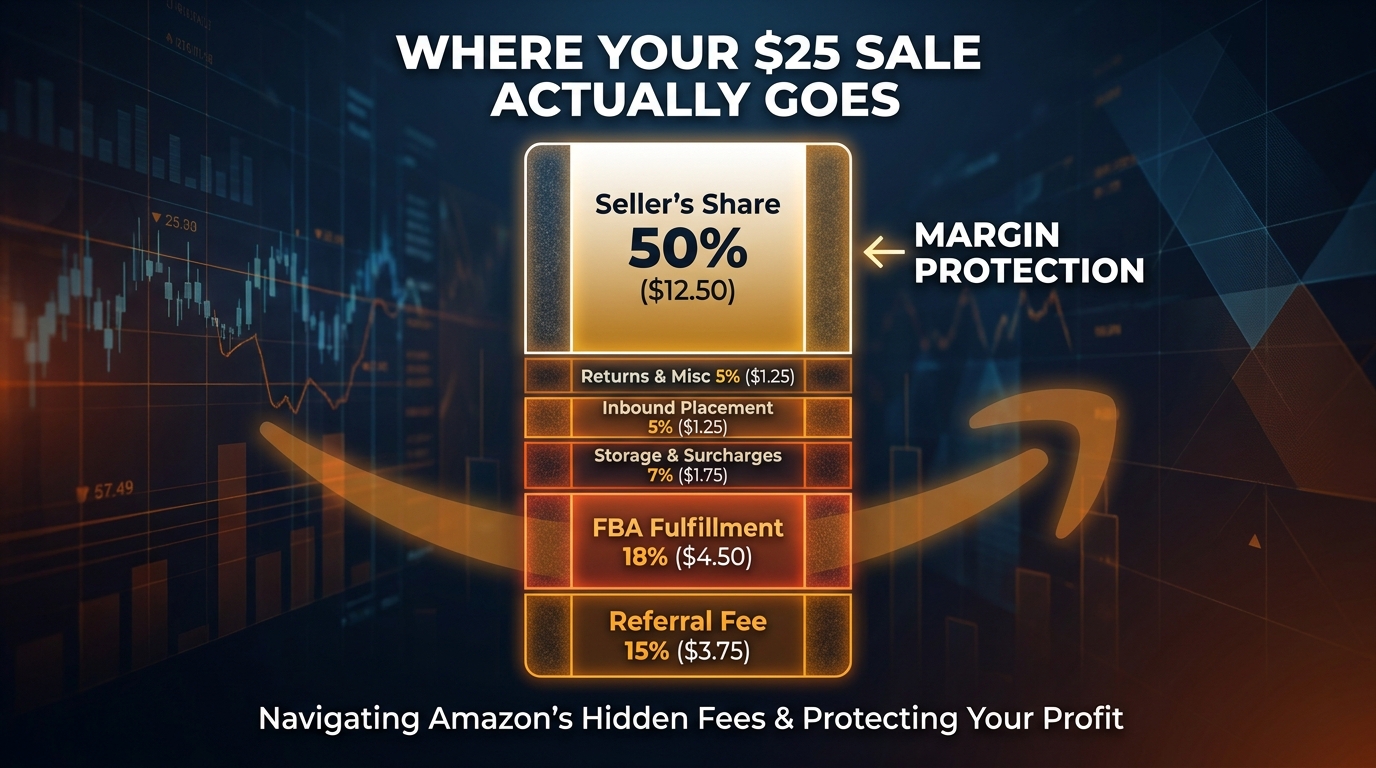
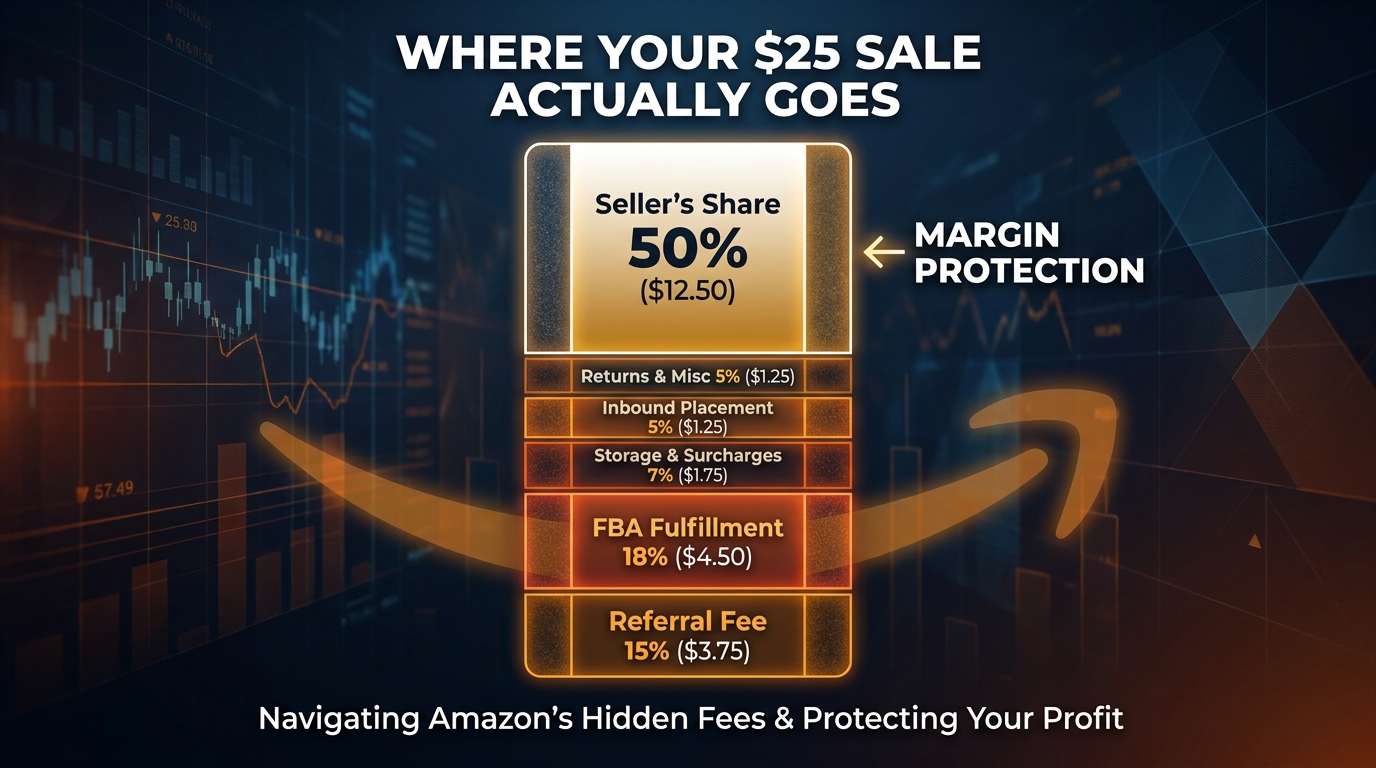
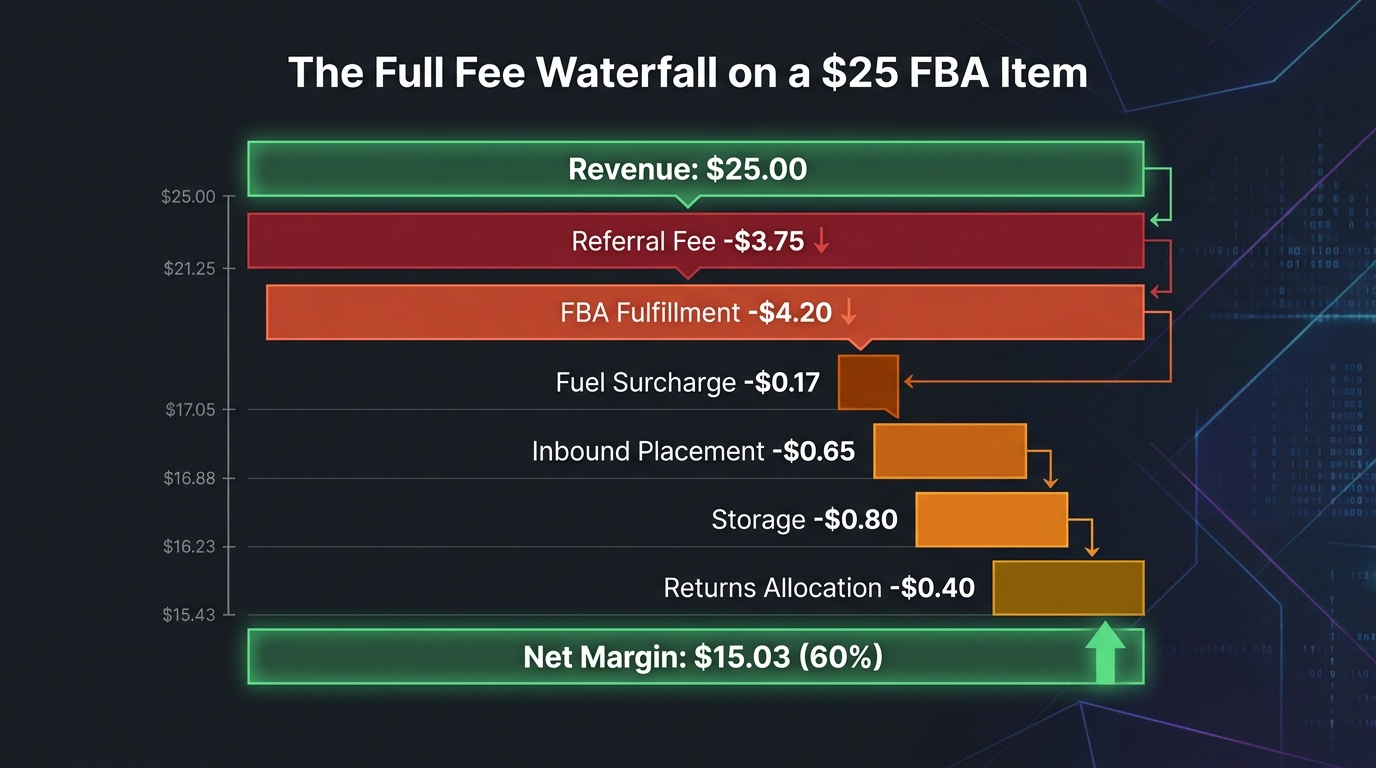
For a typical FBA seller with a standard-size product priced at $25, the fee architecture includes at minimum seven distinct cost vectors:
- Referral fee: Still the largest fixed slice at 15% for most categories, equating to $3.75 on a $25 item. This has not changed in 2026 for most product categories.
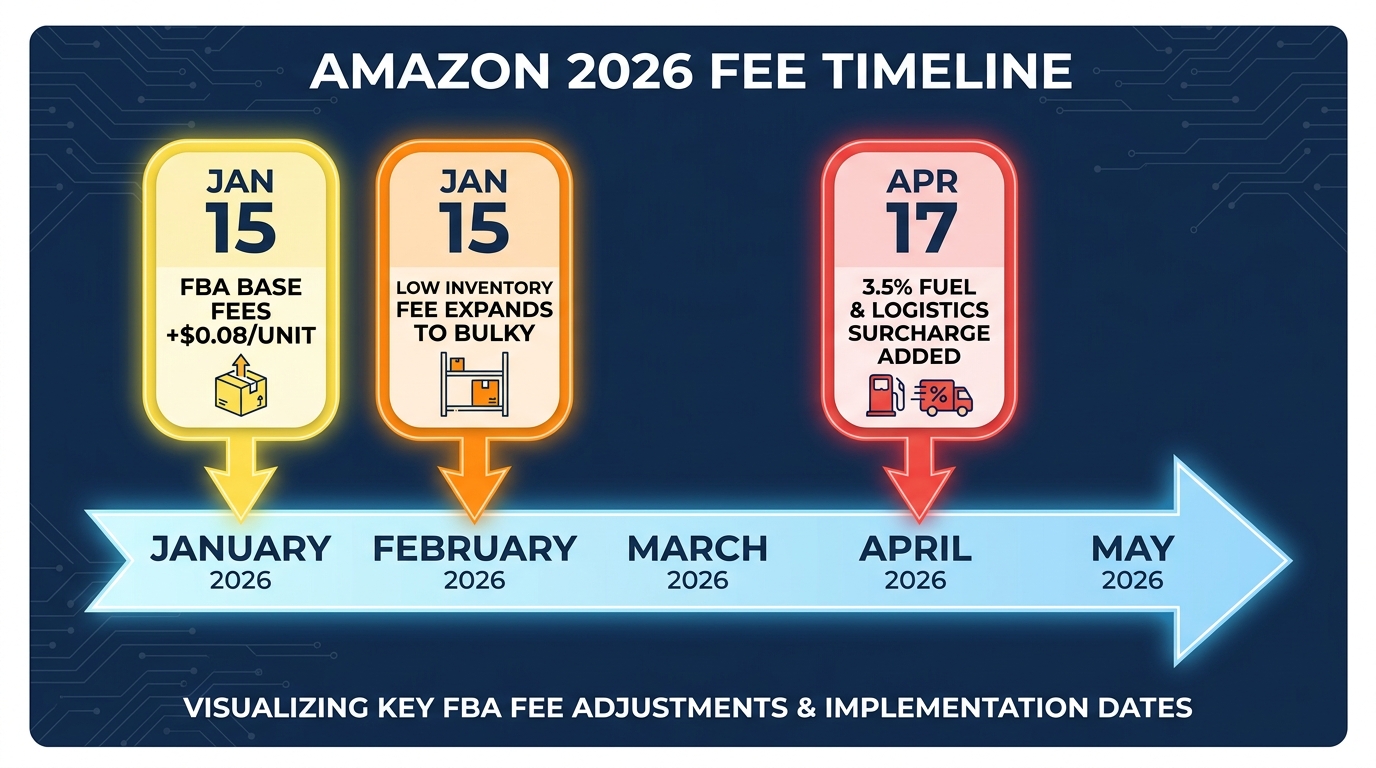
- FBA fulfillment fee: The base cost to pick, pack, and ship the item. For a small standard item ($10–$50 price range), this was raised to approximately $3.06–$4.25 depending on weight tier, effective January 15, 2026.
- Fuel and logistics surcharge: Effective April 17, 2026, a 3.5% surcharge applied to the fulfillment fee — not the sale price — adding roughly $0.12–$0.17 on a standard item.
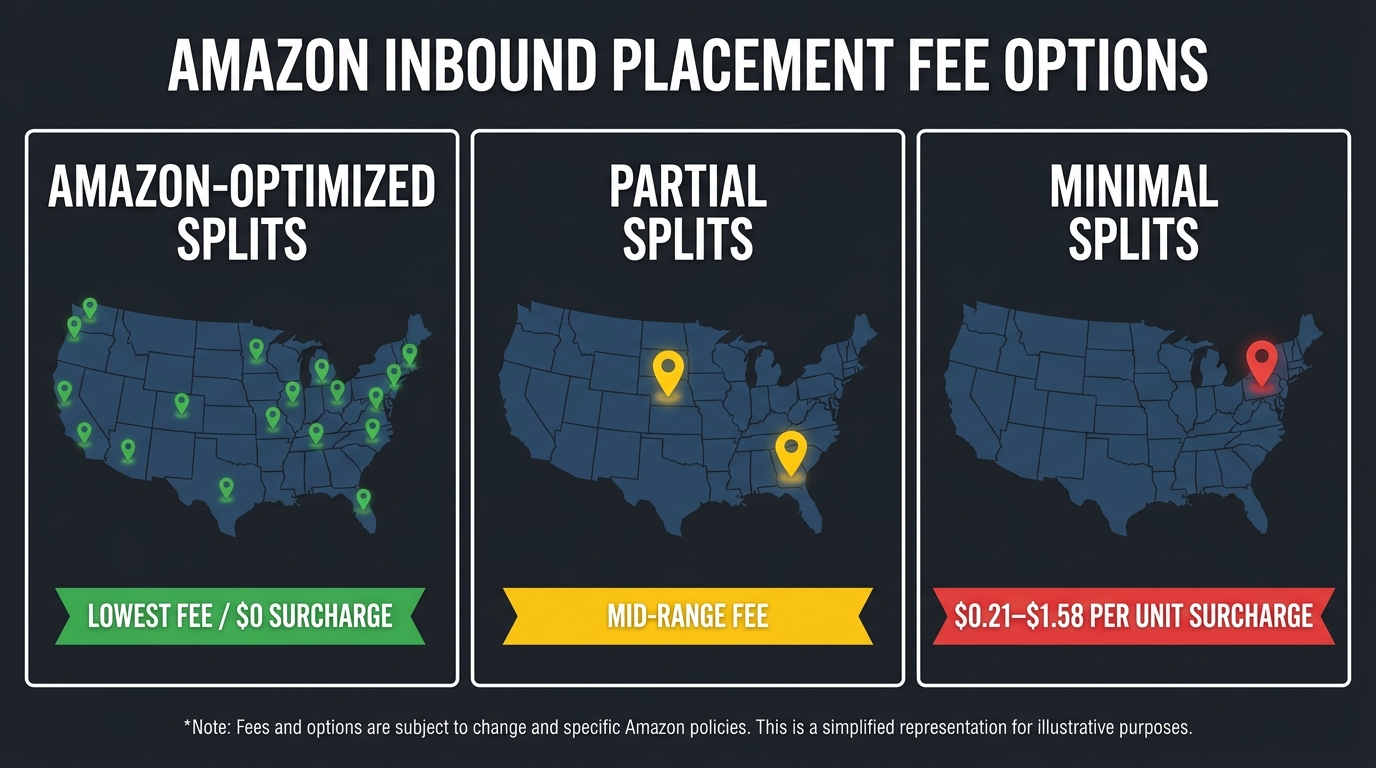
- Inbound placement service fee: A per-unit charge assessed at the time of shipment to FBA, determined by how many fulfillment centers you ship to. For sellers using minimal splits, this ranges from $0.27 to $1.58 per unit on standard-size products.
- Monthly storage fee: Charged per cubic foot at roughly $0.78/ft³ January through September and approximately $2.40/ft³ during peak Q4 season (October–December).
- Aged inventory surcharge: An additional per-cubic-foot charge applied starting at day 181 of FBA storage, on top of the monthly storage fee.
- Returns processing fee: Assessed per returned unit once a SKU’s return rate exceeds a category-specific threshold (with apparel and shoes charged on every return regardless of rate).
When all seven vectors are active on a single SKU — which is common for slower-moving standard-size items in high-return categories — the combined fee load on a $25 item can reach 38–42% of sale price, leaving a pre-COGS margin of 58–62% before the seller pays for the product, advertising, and any other operational costs. Most sellers do not build their P&Ls this way. They model referral plus fulfillment and treat everything else as a surprise.
Where the “Hidden” Part Actually Lives
The charges that most erode margins without appearing in standard seller dashboards are inbound placement fees, the aged inventory surcharge, and the return processing fee. These are not hidden in a deceptive sense — they are documented in Seller Central. But they are not automatically surfaced in the default P&L view, and they are triggered by operational decisions sellers make weeks or months before the charge appears. That time lag is where the damage happens.
The 3.5% Fuel & Logistics Surcharge: A Case Study in Fee Framing
Amazon’s April 17, 2026 announcement of a 3.5% fuel and logistics surcharge was notable for two reasons: what it cost sellers, and how Amazon communicated it.
What the Surcharge Actually Costs
The surcharge is calculated on the fulfillment fee, not on the item’s sale price. Amazon announced it would average approximately $0.17 per unit in the US for FBA. That average masks significant variance by size tier:
- Small standard items (under 1 lb): approximately $0.12–$0.15 additional
- Large standard items (1–3 lbs): approximately $0.17–$0.22 additional
- Oversize and bulky items: $0.25–$0.50+ additional, depending on dimensions and weight
The surcharge was also extended to Multi-Channel Fulfillment (MCF) and Buy with Prime orders on May 2, 2026 — meaning sellers using Amazon’s logistics for non-Amazon channels face the same upward pressure.
The Framing Problem
Amazon described the surcharge as “temporary” and tied it to elevated fuel and logistics costs related to geopolitical instability. That framing deserves scrutiny. Amazon’s logistics surcharge mirrors the “peak” and “fuel” surcharges that major carriers like UPS and FedEx have used for years — charges that began as temporary responses to market conditions and became structural, permanent components of carrier fee schedules.
Whether Amazon’s surcharge persists or is eventually rolled into the base FBA rate doesn’t change how sellers should treat it: as a permanent cost in unit economics modeling. Building a margin model that assumes the surcharge will disappear is a planning risk that doesn’t get rewarded. Building one that assumes it stays — and then getting relief — produces upside rather than shock.
Cumulative Impact at Scale
For a seller shipping 10,000 units per month through FBA, an average $0.17 surcharge adds $1,700/month in new costs — $20,400 annualized. For sellers at 50,000 units/month, that figure exceeds $100,000 per year. At no point did Amazon describe the surcharge in annual terms or in absolute dollar projections. The per-unit framing minimizes the cumulative scale of the charge — which is precisely why sellers need to reframe it themselves, at their actual volume.
Inbound Placement Fees: The Tax on Poor Logistics Planning
Of all the fee categories in Amazon’s 2026 structure, inbound placement is the one where seller behavior has the most direct and immediate impact on cost. It is also the fee that is most frequently misunderstood — and most aggressively avoided by sophisticated operators.
How Inbound Placement Fees Work
When you send inventory to FBA, Amazon needs to distribute it across multiple fulfillment centers to serve customers efficiently. The inbound placement service fee reflects whether you did that distribution work or whether Amazon had to do it for you.
There are three inbound options:
- Amazon-optimized shipment splits: You ship to multiple Amazon-designated FCs. Amazon covers the redistribution cost. Your inbound placement fee is typically waived or minimized.
- Partial splits: You ship to two or three locations. Fees are reduced but not eliminated.
- Minimal splits: You ship everything to one or two locations, and Amazon redistributes from there. This is the most expensive option — ranging from $0.27 to $1.58 per unit on standard-size products, and higher on bulky items.
In January 2026, Amazon increased minimal-split fees by an average of $0.05 per unit on standard-size products — a change that compounded on top of the placement fee structure introduced in 2024.
The Operational Tradeoff
Minimal splits are popular for a reason: they are operationally simpler. Shipping one large pallet to one Amazon FC is easier to manage, track, and reconcile than splitting a shipment across four destinations. Small and mid-sized sellers often choose minimal splits because the logistics overhead of managing multiple shipping lanes feels more expensive than the per-unit fee.
At low volumes, that math sometimes holds. At volumes above roughly 500–1,000 units per shipment, it almost always doesn’t. A seller shipping 2,000 units of a standard product using minimal splits, at a $0.65 average placement fee, pays $1,300 in placement fees on that shipment alone. Splitting to four Amazon-optimized locations might cost $200–$400 in additional carrier fees while eliminating most or all of the placement charge.
The 3PL Solution and Its Limits
Many mid-to-large sellers route inventory through a 3PL that handles multi-location splitting before sending to Amazon. The 3PL charges for the additional labor and carrier coordination, but the net per-unit cost is typically lower than Amazon’s minimal-split placement fee — especially on heavier or bulkier items where placement fees escalate significantly.
The limit of the 3PL approach is lead time. Adding a 3PL in the inbound chain extends the time from factory or supplier to FBA by 3–7 days depending on location. For sellers with thin days-of-supply buffers, this delay can trigger the low-inventory level fee — effectively trading one fee for another. The correct solution is not to choose between placement strategy and inventory velocity management; it is to model both simultaneously and optimize the combined cost.
The Low-Inventory Level Fee: Why Amazon Is Now Penalizing Stockouts Twice
The low-inventory level fee is, in design, a logistics efficiency mechanism. Amazon’s fulfillment network operates more profitably when FBA inventory is consistently stocked relative to demand. When sellers run low, Amazon has to rely on sub-optimal shipping routes, slower delivery options, or customer-facing stockouts — all of which increase Amazon’s cost or reduce customer satisfaction.
The fee, therefore, is Amazon passing some of that inefficiency cost back to the seller. Whether that’s fair is less relevant than understanding the mechanics — and the 2026 changes that expanded its scope.
How the 2026 Low-Inventory Fee Works
Effective January 15, 2026, the fee applies when a product’s historical days of supply (DoS) falls below 28 days across both a 30-day and 90-day lookback window. Both thresholds must be breached simultaneously for the fee to apply. The fee is charged per unit shipped — not per unit stored — which means active sellers with fast-turning but chronically understocked SKUs can accrue significant charges.
The 2026 change extended the fee to bulky size tiers, which had previously been exempt. It also shifted the calculation from the parent ASIN level to the individual FNSKU level — meaning that color variants or size variants of the same product now each carry their own DoS calculation rather than sharing a pooled inventory buffer.
Typical fee ranges in 2026:
- Standard size: approximately $0.32–$0.87 per unit shipped
- Bulky size: approximately $1.11–$2.20 per unit shipped
Why It’s a Double Penalty
The phrase “penalizing stockouts twice” isn’t hyperbole. When a seller’s inventory runs low on a high-velocity ASIN, they face two compounding problems simultaneously:
- Ranking suppression: Amazon’s algorithm deprioritizes ASINs with low in-stock rates, reducing organic visibility and often causing conversion rate drops even after restocking.
- Low-inventory level fee: Amazon now also charges a per-unit fee on every item shipped during the low-DoS period.
The combined cost — lost ranking, suppressed conversion, plus the per-unit fee — can take weeks to fully recover from. A single stockout event on a high-velocity ASIN can cost far more than the direct fee charges suggest when you account for the downstream ranking impact.
The AWD Waiver
Amazon does offer one built-in mitigation: inventory enrolled in Amazon Warehousing & Distribution (AWD) with auto-replenishment activated is eligible for a low-inventory level fee waiver. This creates a financial incentive for sellers to consolidate bulk inventory into AWD as a buffer layer above FBA. The trade-off is examined in more detail in the AWD section below — but for sellers with consistent velocity and volume, the waiver alone can justify AWD enrollment on specific SKUs.
Aged Inventory Surcharge: The Accelerating Cost of Slow-Moving SKUs
The aged inventory surcharge — Amazon’s replacement for what was previously called the long-term storage fee — is the most financially punitive charge in the 2026 fee structure for sellers who carry slow-moving SKUs in FBA. Its escalation schedule is steep, its timing predictable, and its impact severe enough that proactive inventory management is the only real defense.
The Surcharge Escalation Structure
Effective January 16, 2026, the aged inventory surcharge applies to any FBA unit stored for 181 days or more, assessed monthly on inventory present on the 15th of each month. The surcharge is in addition to the regular monthly storage fee:
- 181–210 days: $0.50/ft³
- 211–240 days: $1.00/ft³
- 241–270 days: $1.50/ft³
- 271–300 days: $5.45/ft³
- 301–330 days: $5.70/ft³
- 331–365 days: $5.90/ft³
- 366–455 days: $6.90/ft³
The jump from $1.50 to $5.45 between day 270 and day 271 is not a typo. It is a cliff — a 263% one-day increase designed to force action on inventory that has been sitting for nine months. Sellers who are not actively monitoring inventory age and who allow product to drift past day 270 face dramatically escalating costs with very little runway to respond before the next monthly assessment.
Calculating Real Exposure by SKU
The surcharge is assessed per cubic foot, not per unit — which means the financial exposure scales with the physical size of the product, not its value. A slow-moving oversized item that takes 0.75 ft³ of space hitting the 271-day mark faces a surcharge of $4.09 that month on that single unit. If 200 such units are in FBA at the same time, the monthly aged inventory bill on that one SKU exceeds $800 — before the regular monthly storage fee is calculated.
For sellers with large SKU catalogs, the aged inventory exposure can become one of the largest line items in their Amazon cost structure without ever being clearly surfaced in their reporting. This is why the analytical approach matters: you need to model projected inventory age by FNSKU, not just look at the current state.
Proactive Responses Before the Cliff
The most effective tactics for managing aged inventory exposure are time-sequenced. Once inventory crosses the 271-day threshold, most options are expensive or damaging to margin:
- Days 1–150: Normal sales acceleration through advertising, deal promotion, or repricing. The cheapest window to clear inventory.
- Days 150–200: Initiate liquidation if velocity modeling suggests insufficient sell-through before day 271. Amazon’s liquidation program returns roughly 5–20 cents on the dollar of recovery value, but that is better than paying escalating surcharges on unsellable inventory.
- Days 200–270: Removal orders become the preferred option over paying the surcharge cliff. Removal fees in 2026 are typically $0.99–$2.73 per unit depending on size — painful, but a one-time cost rather than a recurring surcharge.
- Day 270+: Disposal at Amazon’s facility ($0.99–$2.73/unit) eliminates the ongoing surcharge but recovers no inventory value. For items with no downstream resale channel, this is often the least-bad option.
Return Processing Fees: The Silent Margin Drain in High-Return Categories
Return processing fees are the fee category that most sellers in low-return categories ignore — and that most sellers in high-return categories significantly underestimate in their unit economics models. The 2026 structure has specific characteristics that create concentrated risk for apparel, electronics accessories, and home goods sellers.
How Return Processing Fees Are Triggered
The return processing fee applies when a SKU’s return rate exceeds a category-specific threshold, except for apparel and shoes, where the fee is charged on every returned unit regardless of return rate. The fee is calculated based on size tier and shipping weight, not on the item’s sale price — which means a low-margin, high-return-rate SKU in a fee-eligible category faces a disproportionate margin impact.
A key operational detail: the fee is assessed and posted to seller accounts in the third subsequent month following the return. This three-month lag means that a return processing fee problem showing up in your account today reflects return patterns from three months ago. By the time the charge appears, the inventory decisions, pricing, and listing conditions that drove those returns may have already changed — making root cause analysis harder and reactive responses less effective.
High-Risk Category Profiles
Return rate exposure concentrates in specific product types:
- Apparel and footwear: Fee on every return, no threshold. With industry return rates for online clothing purchases averaging 20–30%, this fee can represent a meaningful percentage of gross margin on individual SKUs.
- Electronics accessories: High return rates driven by compatibility issues, defective-on-arrival claims, and buyer’s remorse. Returns often result in unsellable units (opened packaging), compounding the fee cost with inventory write-downs.
- Home goods and furniture: Large, bulky items with high return processing fees (due to size tier) and relatively high return rates from customers who misjudge dimensions or aesthetics from product listings.
Reducing Return Rate to Stay Below Threshold
The most direct way to manage the return processing fee is to reduce the return rate itself. Three interventions have documented impact:
- Listing accuracy: The leading driver of returns for most product categories is “not as described.” Dimensional accuracy in listings, material callouts, and accurate photography reduce expectation gaps and return rates. This is not a creative exercise — it is a financial one.
- Size charts and fit guides: For apparel specifically, the most effective single intervention for reducing returns is a comprehensive, accurate size chart displayed prominently in listing images. Sellers who add detailed fit guidance consistently see measurable return rate improvements.
- Product improvement based on return reason codes: Amazon provides return reason code data in the FBA Returns report. Sellers who systematically review reason codes and make product or listing adjustments based on them can identify the 20% of issues driving 80% of returns — and address them before they compound into fee liability.
The Hybrid Fulfillment Equation: When FBM and 3PLs Make More Sense
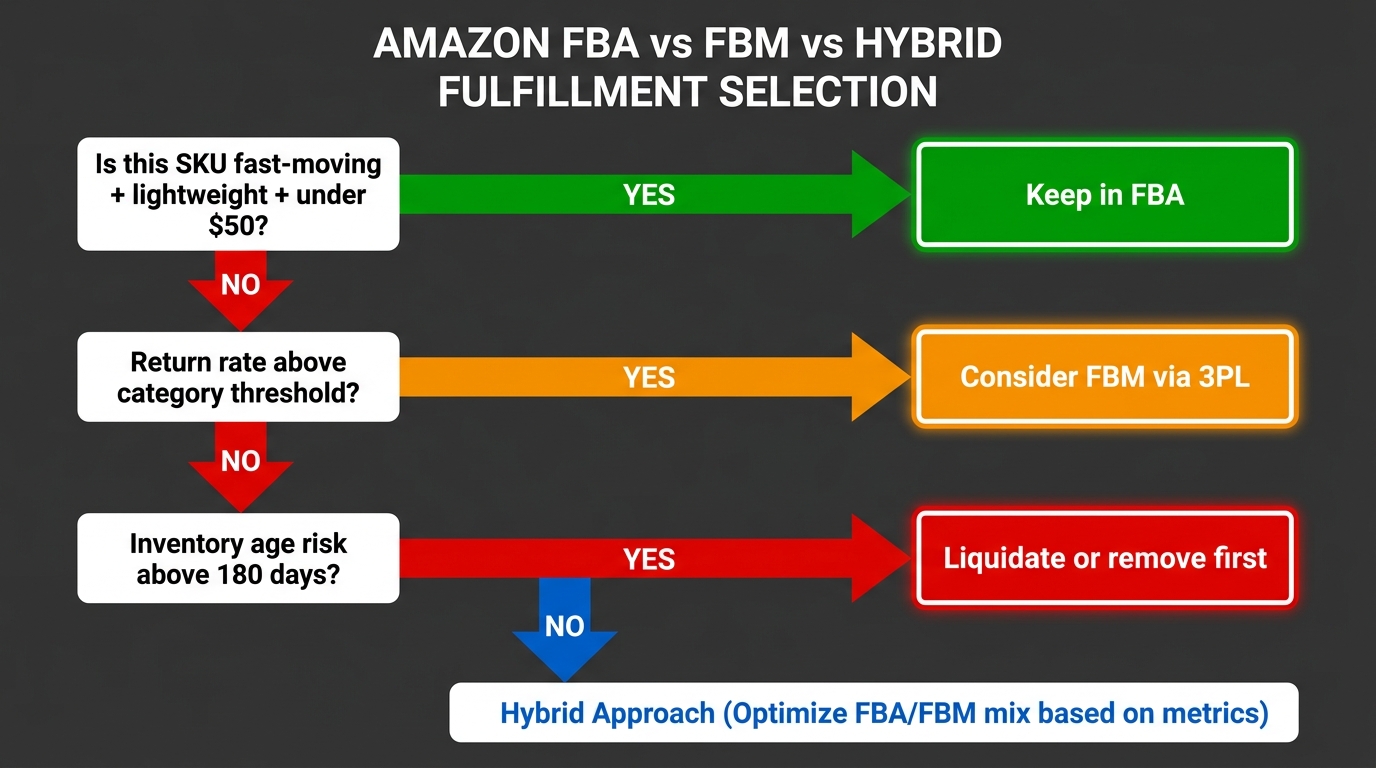
The reflexive response to rising FBA fees is to consider Fulfillment by Merchant (FBM) as an alternative. The more productive framing is to ask which specific SKUs belong in which fulfillment channel — and to build the answer on unit economics rather than operational convenience.
The FBA-to-FBM Migration Math
FBA provides three things FBM cannot easily replicate: Prime eligibility, Amazon-handled customer service for fulfillment issues, and organic ranking signals tied to in-stock reliability. For fast-moving, lightweight, modestly-priced items, FBA’s total cost is almost always competitive with what a third-party fulfillment operation can deliver at equivalent speed and Prime status.
The economics shift for specific SKU profiles:
- Slow-moving SKUs (DoS above 60 days on average): Storage costs accumulate and aged inventory risk grows. FBM through a 3PL that charges a flat monthly storage rate (typically $0.45–$0.65/ft³ per month with no seasonal surcharge) can be significantly cheaper than FBA storage plus aged inventory surcharge exposure.
- High-return-rate categories in non-apparel: If a SKU consistently exceeds the return threshold and generates return processing fees, the total FBA cost per sale includes a return fee allocation that may not exist in a self-managed FBM model (where you control the return experience and can restock or refurbish returned units).
- Heavy, bulky items: FBA fulfillment fees on oversize and bulky items are substantially higher, and inbound placement fees on the same items are also elevated. For bulky items with low velocity, the break-even comparison often favors a 3PL with FBM listing, even accounting for the loss of Prime badge.
- High-ASP items ($75+): The referral fee (still 15% in most categories) on a $100 item is $15. On items at this price point, FBA’s absolute fulfillment cost is a smaller proportion of the total fee load — but the absolute dollar amount of each fee is higher, making total cost modeling especially important.
Seller-Fulfilled Prime: The Middle Path
Amazon’s Seller-Fulfilled Prime (SFP) program allows sellers to maintain the Prime badge while handling fulfillment themselves — but the operational requirements are strict. SFP demands next-day and two-day delivery from seller-operated or 3PL-managed facilities, with consistent on-time delivery rates above 93.5% and cancellation rates below 0.5%.
For sellers with high-volume, established 3PL relationships and the operational capacity to meet those metrics, SFP can offer the best of both worlds: Prime visibility without FBA storage and placement fee exposure. For smaller operations or those with seasonal velocity spikes, SFP’s operational requirements create compliance risk that can result in program suspension — which is worse than paying FBA fees.
The Hybrid SKU-Level Approach in Practice
The most defensible margin strategy in 2026 is not “FBA” or “FBM” as a categorical choice — it is a continuous, SKU-level routing decision made using actual unit economics data. A practical implementation looks like this:
- Calculate fully-loaded FBA cost per unit for each FNSKU (including all seven fee vectors above).
- Calculate equivalent FBM cost per unit using your 3PL’s rate card (pick/pack, storage, carrier, return handling).
- Apply a Prime discount factor: empirical data consistently shows FBA listings outconvert FBM listings for Prime customers; model this conversion premium conservatively at 10–20% higher conversion rate for FBA on the same ASIN.
- Route SKUs where the FBA premium over FBM exceeds the conversion uplift value to FBM or hybrid. Review quarterly.
Amazon Warehousing & Distribution: A Fee Reduction Layer (and Its Limits)
Amazon Warehousing & Distribution (AWD) is Amazon’s own bulk storage and distribution service, designed as a layer between your supplier and FBA. It occupies an interesting position in the fee management conversation: it is a genuine cost-reduction tool for specific seller profiles, and an unnecessary complexity or even a trap for others.
What AWD Actually Offers
At its core, AWD provides:
- Lower storage costs than FBA: AWD charges pay-as-you-go bulk storage with no seasonal surcharges. For large-volume SKUs where you need to hold significant inventory, AWD storage is typically cheaper than FBA storage — particularly in Q4 when FBA monthly storage fees jump to roughly $2.40/ft³.
- Inbound placement fee coverage: When inventory moves from AWD to FBA, Amazon handles the network distribution. AWD pricing covers the FBA inbound placement fee, effectively eliminating that cost for AWD-enrolled inventory.
- Low-inventory level fee waiver: FBA inventory auto-replenished from AWD is eligible for the low-inventory level fee waiver — one of the few ways to avoid that charge without changing your sales velocity.
- Distribution to non-Amazon channels: AWD can distribute to Walmart Fulfillment Services and other eligible non-Amazon channels, making it potentially useful for multi-channel sellers.
The Limits and Trade-Offs
AWD is not a universal solution, and its limitations are real:
Lead time from AWD to FBA: The auto-replenishment from AWD to FBA is not instant. Amazon’s typical replenishment cycle introduces 2–5 days of additional lead time in the supply chain. Sellers with tight inventory management and fast-moving SKUs may find that AWD’s replenishment lag creates in-stock risk during velocity spikes that offsets the fee savings.
AWD storage costs are not free: AWD has its own per-cubic-foot storage fees. While lower than FBA during peak season, they do represent a real cost that must be factored into the total supply chain cost — including the cost of capital tied up in inventory held at AWD.
Control and visibility: Some sellers report less granular inventory visibility when managing stock split across AWD and FBA versus a single location. This is an operational consideration that varies by seller tooling and systems.
Not available for all product types: AWD has eligibility restrictions by product category and size tier. Sellers in restricted categories or with non-standard dimensions may not qualify.
The Right Profile for AWD
AWD delivers the clearest ROI for sellers who have: (1) consistent, predictable velocity on their SKUs, (2) enough volume to justify the operational overhead of a two-layer storage system, (3) Q4 seasonal exposure where avoiding FBA’s peak storage rates saves materially, and (4) inbound placement fee exposure large enough that AWD’s coverage of those fees is meaningful. For many sellers, that is a subset of their catalog — and the right approach is selective AWD enrollment by SKU rather than an all-or-nothing platform commitment.
Building a Fee Monitoring Dashboard: What to Track, When to Act
The common thread across every fee vector in Amazon’s 2026 structure is that the damage is visible in advance — if you are looking at the right metrics. The challenge for most sellers is that their default analytics workflow focuses on sales, rankings, and advertising performance. Fee monitoring requires a separate data layer that most seller dashboards do not build by default.
The Six Metrics That Predict Fee Exposure
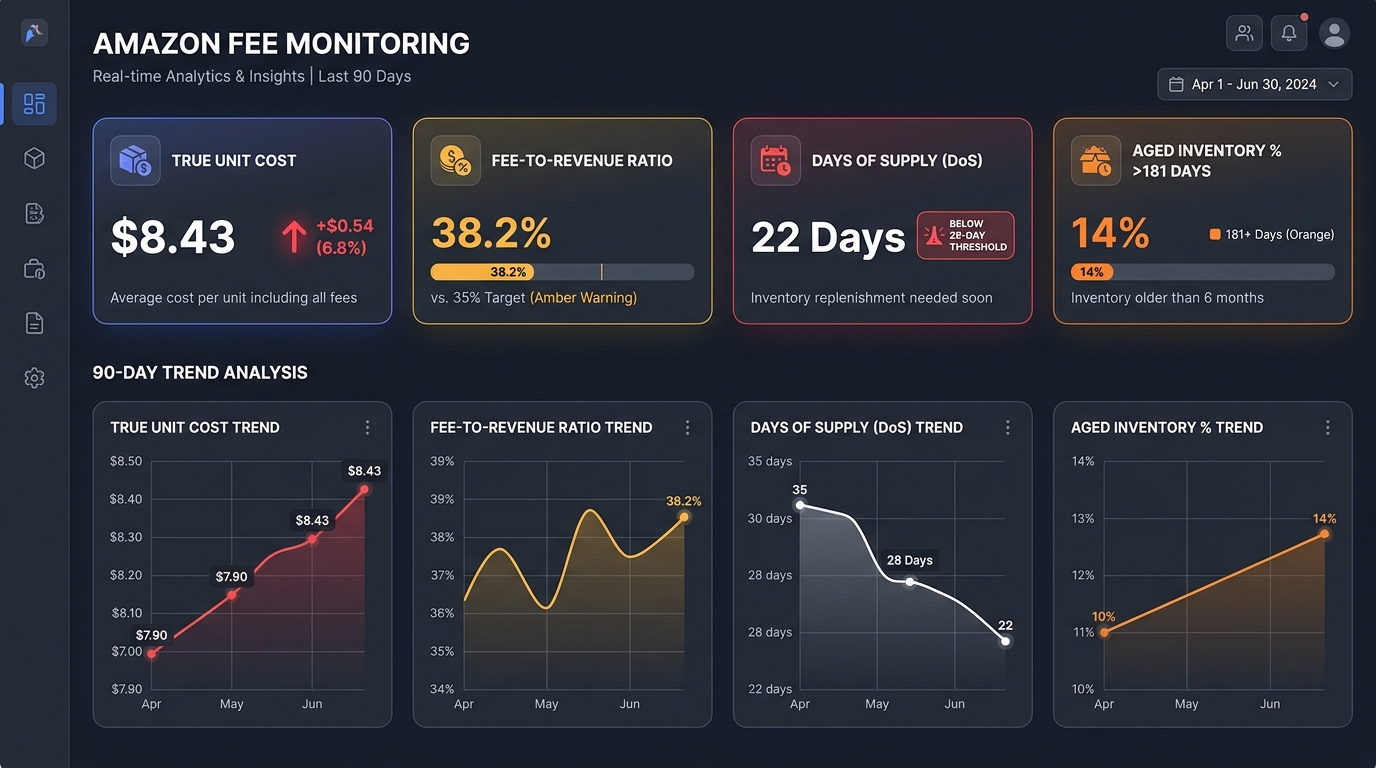
A functional fee monitoring dashboard should track these six variables at the FNSKU level, updated at minimum weekly:
- True unit cost (fully loaded): All seven fee vectors calculated per unit at current fee rates. This is not the same as the “estimated fee” shown in Seller Central, which typically includes only referral and FBA fulfillment fees.
- Fee-to-revenue ratio by SKU: Total fees as a percentage of sale price. Flag any SKU where this exceeds 40%. For most product categories with a 15% referral fee, a fee ratio above 40% signals that other fee vectors are creating significant additional drag.
- Historical days of supply (30-day and 90-day): Pulled from FBA inventory health reports. Any FNSKU with both metrics below 28 days should trigger immediate replenishment analysis. Any FNSKU approaching 28 days on either metric warrants attention.
- Inventory age distribution by FNSKU: Specifically the percentage of units older than 120, 150, and 180 days. The 120-day flag creates a 60-day decision window before the aged inventory surcharge kicks in — enough time to run a meaningful promotion or initiate a removal order.
- Return rate by FNSKU (trailing 90 days): Compared against category threshold. Flag any FNSKU where return rate is trending toward the threshold. This is the leading indicator for return processing fee exposure.
- Inbound placement fee rate (last three shipments): Track the actual per-unit placement fee paid on recent shipments. If you are consistently paying minimal-split rates, the delta between your actual rate and the optimized-split rate is a quantified savings opportunity.
Building the Reporting Layer
Amazon’s native Seller Central reports — specifically the FBA Inventory Health report, the Manage FBA Inventory report, and the FBA Returns report — contain most of the raw data needed to build this monitoring layer. The limitation is that Seller Central does not aggregate them into a unified view, and the default reporting frequency is not granular enough for proactive management.
Most sellers who have built effective fee monitoring systems use one of three approaches: (1) scheduled data exports from Seller Central into a spreadsheet or BI tool, rebuilt weekly; (2) a third-party tool like Helium 10, Jungle Scout, or SellerBoard that aggregates fee data and provides alert-based notifications; or (3) an Amazon API-connected internal dashboard for sellers with engineering resources. The specific tool matters less than the discipline of reviewing the data on a fixed schedule and triggering predefined actions when thresholds are breached.
Pricing Architecture: Restructuring SKUs Around True Cost
Fee management and pricing strategy are not separate disciplines. In 2026, the sellers effectively protecting margin are the ones who treat pricing as a downstream output of unit economics modeling — not an input to it.
The True-Cost Pricing Model
The standard Amazon pricing approach works backward from a competitive price point: find where competitors are priced, set your price within that range, and calculate whether the resulting margin is acceptable. This approach produces acceptable results when fee structures are stable. It fails systematically when fee structures change, because prices set under the old cost structure continue to be validated against competitive benchmarks that may also be mispriced.
The alternative is to build price from the cost up. For each FNSKU, establish:
- Landed COGS (product cost + inbound freight + import duties)
- Fully-loaded Amazon fee stack (all seven vectors, calculated at realistic fee rates including the 3.5% surcharge)
- Target contribution margin (the percentage of revenue remaining after COGS and all fees, before advertising)
- Advertising allocation (average ACoS multiplied by expected ad-attributed sales percentage)
- Minimum acceptable price = (COGS + Fees) / (1 – Target Contribution Margin – Ad Allocation)
If the minimum acceptable price is above what the market will support, the product needs to be repriced upward, restructured (bundled, variant-adjusted, or repositioned), or removed from the FBA catalog. The worst response is to continue selling at the competitive market price while absorbing negative or near-zero margin.
Bundling as a Fee Reduction Lever
Product bundling — combining two or more complementary items into a single ASIN — is one of the most effective structural tools for improving fee ratios. A bundle increases average order value while typically increasing the referral fee only marginally (referral is still capped at 15% for most categories regardless of bundle price) and increasing FBA fulfillment fees by less than the proportional increase in revenue.
A practical example: two items each priced at $12 generate $3.60 in referral fees (2 × $1.80) and approximately $6–8 in combined FBA fees. Bundled at $24, the referral fee is $3.60 and FBA fees are $4.50–$5.50 (one shipment rather than two), for a combined fee of $8.10–$9.10 compared to $9.60–$11.60 for two separate transactions. The bundle earns more revenue with lower total fees.
The operational caveat: bundles must be physically packaged together before shipping to FBA. They cannot be virtual bundles for FBA fulfillment purposes (though Amazon’s Virtual Bundles feature allows multi-ASIN bundling in the listing interface). Physical bundles require pre-packaging coordination with your supplier or a 3PL with prep services — an additional operational step that is worth building into the workflow for high-velocity SKUs with strong bundling potential.
Price Tier Engineering
Amazon’s FBA fee structure is tiered by price band. In 2026, the tiers for standard-size products differentiate between items priced under $10, $10–$50, and above $50. This creates specific pricing edge cases:
- Items currently priced just below a tier boundary (e.g., $9.90 or $49.50) may be worth pricing to the higher tier if the additional revenue exceeds the additional fee.
- Items priced just above a lower tier boundary may benefit from price testing to confirm whether the lower fee at a slightly reduced price improves net margin even at slightly lower revenue.
These edge cases are worth modeling explicitly. A $0.50 price change that moves a product from one tier to another can change the FBA fee by more than $0.50 — making the price change net-positive for margin even at marginally lower conversion rates.
The Compounding Problem: When Multiple Fees Hit the Same SKU
The most dangerous fee scenario in Amazon’s 2026 structure is not any single charge — it is when multiple fee triggers activate simultaneously on the same FNSKU. This convergence happens more often than sellers expect, and its financial impact compounds in ways that are not intuitively obvious from looking at each fee in isolation.
The Convergence Scenario
Consider a standard-size product, priced at $25, that has been selling moderately well but experiences a seasonal velocity drop in Q3. The following fee conditions can activate concurrently:
- Inventory that shipped in January hits day 181 in July — aged inventory surcharge activates at $0.50/ft³.
- Seasonal velocity drop pushes historical DoS below 28 days — low-inventory level fee activates at $0.32–$0.87 per unit shipped.
- Slower sales mean the seller increases advertising spend, pushing ACoS up while net margin falls.
- The fuel and logistics surcharge (3.5%) has been active since April, adding ~$0.17 per unit continuously.
In this scenario, the fully-loaded fee stack on a $25 item now includes base FBA fees (~$3.80), referral ($3.75), fuel surcharge (~$0.17), low-inventory level fee (~$0.55), and the beginning of the aged inventory surcharge allocated across units — pushing the total fee load above $9.50 before any advertising cost, and before COGS. On a $25 item, that leaves approximately $15.50 in gross margin before advertising and product cost — and many items at this price point have a COGS of $7–10, leaving an operating margin of $5–8.50 that advertising spend can quickly consume entirely.
The Velocity Trap
There is a structural irony in how these fees interact: the slow-velocity periods that trigger both aged inventory and low-inventory level fees simultaneously are also the periods when sellers are most tempted to reduce advertising spend to protect margin. Reducing ad spend further reduces velocity, which deepens the aged inventory problem while potentially sustaining the low-inventory level fee on the units that do sell.
The correct response in a convergence scenario is often counter-intuitive: accelerate sell-through aggressively while initiating removal or liquidation for units approaching day 270. This typically means increasing promotions or running a Lightning Deal to clear inventory at reduced margin — accepting a near-term margin hit to prevent the far larger cost of crossing the $5.45/ft³ aged inventory cliff and sustaining the low-inventory fee simultaneously.
Prevention Is Cheaper Than Response
The cleanest way to avoid convergence scenarios is to build seasonal velocity modeling into the inventory planning workflow 90–120 days in advance. If you know from historical data that Q3 brings a 30% velocity decline for a given SKU, you know that inventory shipped in Q1 will be at risk of hitting the 181-day threshold in Q3. The proactive response is to reduce the Q1 shipment size to align with projected Q3 velocity — or to plan a Q3 promotion in advance rather than reactively.
This type of forward planning is the operational backbone of effective fee management. It requires investing in demand forecasting that most small and mid-sized Amazon sellers treat as optional. In 2026’s fee environment, it is not optional. It is the core cost-control discipline.
Margin Defense as a Systematic Practice: The Operational Framework
Protecting margin against Amazon’s 2026 fee structure is not a one-time optimization exercise. It is an ongoing operational discipline that needs to be built into the regular workflow of any serious FBA business — with defined owners, review cadences, and decision triggers.
The Weekly Operating Rhythm
Effective margin defense requires a differentiated review cadence for different time horizons:
Weekly: Review days of supply by FNSKU. Flag any FNSKU with DoS below 35 days (the 7-day buffer above the 28-day fee trigger). Initiate replenishment orders for flagged SKUs. Review any aged inventory units approaching 120 days and assess sell-through velocity against time remaining before day 181.
Monthly: Full fee stack reconciliation — compare actual fees paid per FNSKU against modeled fees. Identify discrepancies (which often indicate a fee category you weren’t tracking). Review return rate trends by FNSKU. Assess inbound placement fees paid on recent shipments and evaluate whether routing changes would reduce next month’s charges.
Quarterly: Full SKU-level profitability audit. For each FNSKU, calculate the realized contribution margin after all fees. Compare against target margin. Identify SKUs in the bottom quartile of margin performance and triage: reprice, bundle, route to FBM, or discontinue. Evaluate AWD enrollment eligibility for high-volume SKUs approaching Q4 storage cost season.
The Discontinuation Decision
One of the most financially impactful decisions sellers avoid making is discontinuing underperforming ASINs. The sunk cost of product development, photography, listing optimization, and initial advertising creates a psychological barrier to exit that does not reflect the economic reality.
In 2026’s fee environment, an ASIN with a fee-to-revenue ratio above 45%, COGS above 30% of sale price, and advertising spend above 15% of sale price is generating negative operating margin. The longer it occupies FBA storage, the more it costs in storage and aged inventory fees. The cleaner decision — remove inventory, close the ASIN, and redeploy capital to higher-margin SKUs — is often worth several points of overall business margin improvement, without requiring any changes to the products that are actually working.
Negotiating COGS as the Upstream Lever
Fee management addresses the Amazon-side cost structure. But the other side of the unit economics equation — COGS — is often more leverageable than sellers treat it. A 10% reduction in product cost has the same margin impact as eliminating the entire fuel and logistics surcharge on most standard-size items. Yet sellers who accept their existing supplier pricing as fixed while spending significant effort optimizing Amazon fees are leaving more accessible savings on the table.
In 2026, as Amazon fee increases compound, COGS renegotiation should be on the annual calendar for every supplier relationship. The business case is straightforward: rising logistics costs are squeezing margin throughout the supply chain, and suppliers with efficient production at scale have room to absorb cost pressure if asked directly and with volume-backed leverage.
Conclusion: The Fee Environment Has Changed. The Winners Will Change With It.
Amazon’s 2026 fee structure is not a crisis for sellers who understand it — it is a competitive filter. Every fee increase that goes unmodeled by the seller next to you on the search results page becomes a relative advantage for you if you have correctly priced, correctly routed, and correctly managed your inventory against the real cost stack.
The sellers who will compress margin most severely in the next 12 months are those who continue to model unit economics as referral fee plus FBA base fee, treat the fuel surcharge as a temporary anomaly that will disappear, send inventory on minimal splits because it is operationally simpler, and discover aged inventory charges three months after they were preventable.
The sellers who will protect — and in some cases expand — their margins are those who have built a systematic, data-driven fee management practice. Not a spreadsheet they update once a year. Not a quarterly review that happens after the damage is done. A weekly operational rhythm with defined metrics, predefined thresholds, and clear decision rules that trigger action before fees accumulate into damage.
Seven things to implement this week:
- Run a true unit cost calculation on your top 20 ASINs using all seven fee vectors. The number will likely be higher than your current model shows.
- Pull your FBA Inventory Health report and identify every FNSKU with DoS below 35 days or inventory age above 120 days. Both require immediate action.
- Check your last three inbound shipments to identify whether you are paying minimal-split placement fees. If so, model the cost of optimized splits versus your current routing.
- Build a 90-day velocity forecast for your top 10 ASINs by inventory value. Flag any where projected sell-through will leave units in FBA past day 150 before clearing.
- Review your return rate reports for the trailing 90 days. Identify any FNSKU approaching category return threshold and investigate the top return reason codes.
- Model three to five SKUs for hybrid fulfillment — specifically slow-moving, large/heavy, or high-return items — and compare the true cost of FBA versus FBM via a 3PL partner.
- Add the 3.5% fuel surcharge to your standard FBA fee model if you have not already. It is not going away soon, and modeling it as present changes the minimum viable price calculation on every SKU you sell.
Amazon will continue adjusting its fee structure to optimize its logistics network at sellers’ expense. That is a structural feature of the marketplace, not a bug. The margin defense is not in opposing that reality — it is in understanding it more precisely than your competitors do.