Every business considering AI process automation is essentially making the same bet: that the time, money, and organizational energy invested will come back faster and bigger than they went in. And yet, the numbers tell a punishing story.
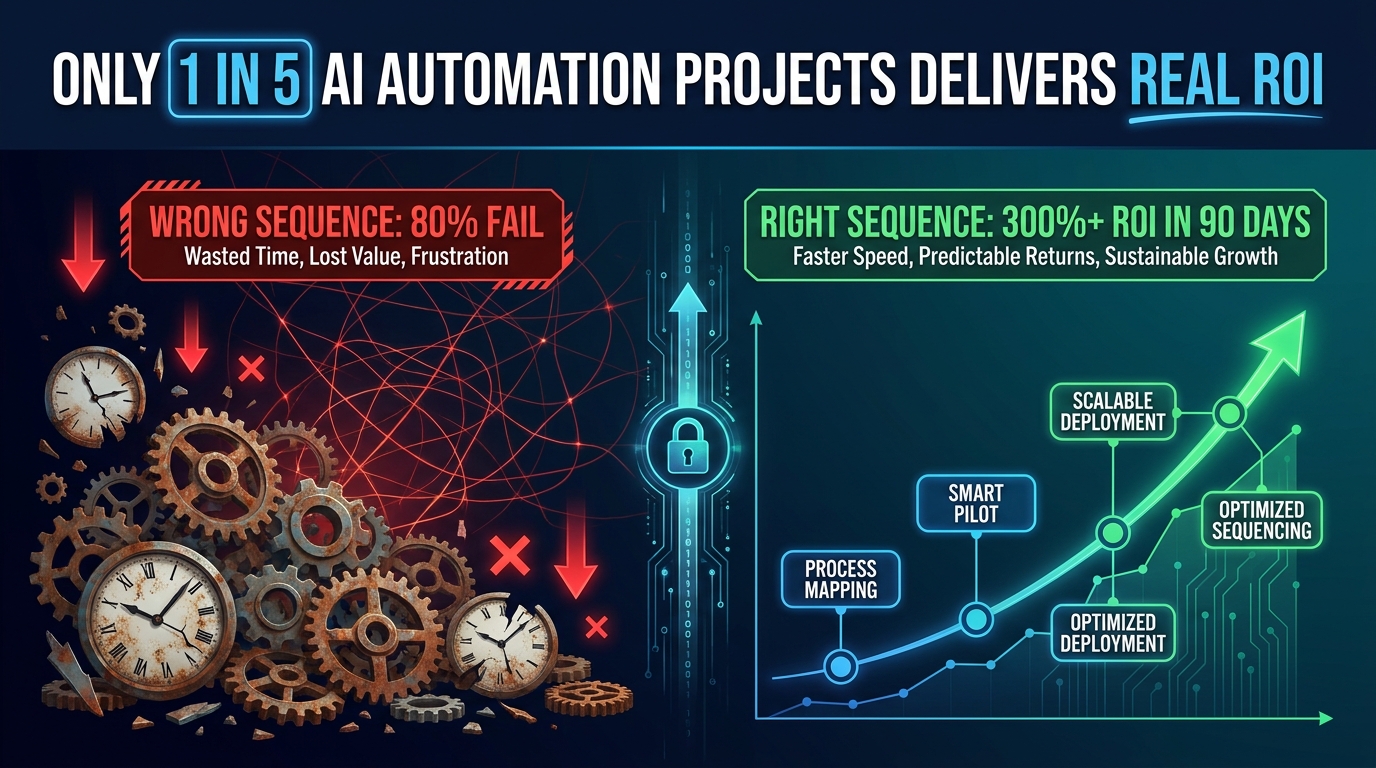
According to a RAND analysis reviewed by multiple 2026 industry reports, roughly 80.3% of AI automation projects fail to deliver intended business value. A separate MIT study found that 95% of generative AI pilots specifically never reach meaningful P&L impact. Meanwhile, S&P Global reported that 42% of companies scrapped most of their AI initiatives — a figure that had more than doubled from 17% just two years prior.
That doesn’t mean AI automation is overhyped. The 20% that do it right are posting returns that are hard to argue with: 300–330% median three-year ROI on well-implemented deployments, payback periods compressed to as little as 3–6 months on focused workflows, and operational savings that compound over time. Klarna saved the equivalent of 700 full-time employees through AI-assisted customer support. IBM cut HR operations costs by 40% with a single self-service AI system. ServiceNow freed up 410,000 work hours — valued at $17.7 million — through targeted automation.
So the gap isn’t between AI working and not working. The gap is between sequencing it correctly and sequencing it wrong. Most businesses start with the wrong workflows, measure the wrong outcomes, and burn months — sometimes years — without a clear return signal. The organizations that generate the fastest ROI don’t necessarily have bigger budgets or better technology. They have a sharper answer to a single question: which automation do we run first?
This guide is built entirely around that question. You’ll find a practical prioritization framework, benchmarked data on the fastest-returning workflow categories, a breakdown of how company size changes the math, a 90-day execution plan, and an honest look at the hidden costs that quietly kill projects that looked promising on paper.
Why Most Businesses Pick the Wrong AI Workflows First
The most common sequencing mistake in AI automation isn’t technical — it’s strategic. Companies tend to start where enthusiasm is highest, not where ROI is fastest. The result is a set of ambitious but slow-to-return deployments that exhaust budgets and patience before the wins arrive.
The Enthusiasm Trap
When leadership gets excited about AI, the first instinct is usually to tackle the biggest, most visible problem in the organization. That might be a complex supply chain optimization, an end-to-end sales intelligence platform, or a generative AI model trained on proprietary data. These projects check impressive boxes. They also routinely take 18–36 months to deliver measurable value — if they deliver it at all.
Industry data supports this: the median time to breakeven on an AI project sits at around 8 months, but enterprise-wide deployments typically require 18–36 months before substantial returns materialize. For most organizations operating under quarterly performance pressure, that timeline creates a credibility problem well before the wins arrive.
The “Automate What’s Broken” Mistake
A second critical error is selecting workflows based on pain level alone. If a process is causing significant operational friction, the assumption is that automating it will produce significant relief. But automating a broken process doesn’t fix it — it accelerates the broken behavior at scale. Organizations that skip process redesign before automation routinely find themselves managing more exceptions, not fewer.
One of the most common versions of this: companies automate their customer complaint routing before they’ve mapped what actually happens to routed complaints. The AI routes faster. The underlying resolution bottleneck remains. The customer experience stays the same. The ROI case never materializes.
The Misallocated Budget Problem
Data from multiple 2026 industry analyses found that over 50% of AI automation budgets are directed toward sales and marketing functions — largely because those departments have the loudest voices at budget time and because “revenue generation” sounds more compelling than “cost reduction.” The irony is that back-office automation in finance, HR, and document processing consistently delivers faster and more measurable returns.
Accounts payable automation, for instance, reduces per-invoice processing costs from roughly $15–16 to as low as $3, with 80–90% error reduction, often within months of deployment. That’s a provable, auditable number. A generative AI system for sales personalization might lift close rates by 10–20% over a year — a meaningful result, but one that’s harder to isolate, slower to measure, and more dependent on adoption by a sales team that may or may not use it consistently.
The Pilot Purgatory Trap
Perhaps the most insidious pattern is what analysts now call “pilot purgatory” — the state in which an organization runs a successful proof-of-concept, declares it a win, and then never actually scales it. The pilot consumes resources, produces promising numbers, gets celebrated in an all-hands meeting, and then quietly sits in a corner while the team moves on to the next shiny concept.
Gartner has projected that over 40% of agentic AI initiatives will be cancelled by 2027 due to escalating costs and unclear scaling paths — many of these having passed their pilot phase with flying colors. The lesson: an automation that works in a pilot but has no documented scaling path isn’t an asset. It’s a sunk cost in waiting.
The ROI Velocity Framework: Scoring Automation Candidates Before You Build
Before committing resources to any automation initiative, every workflow candidate should pass through a structured scoring process. This isn’t bureaucracy — it’s the filter that separates the automations that will generate returns within months from those that will drain momentum for years.
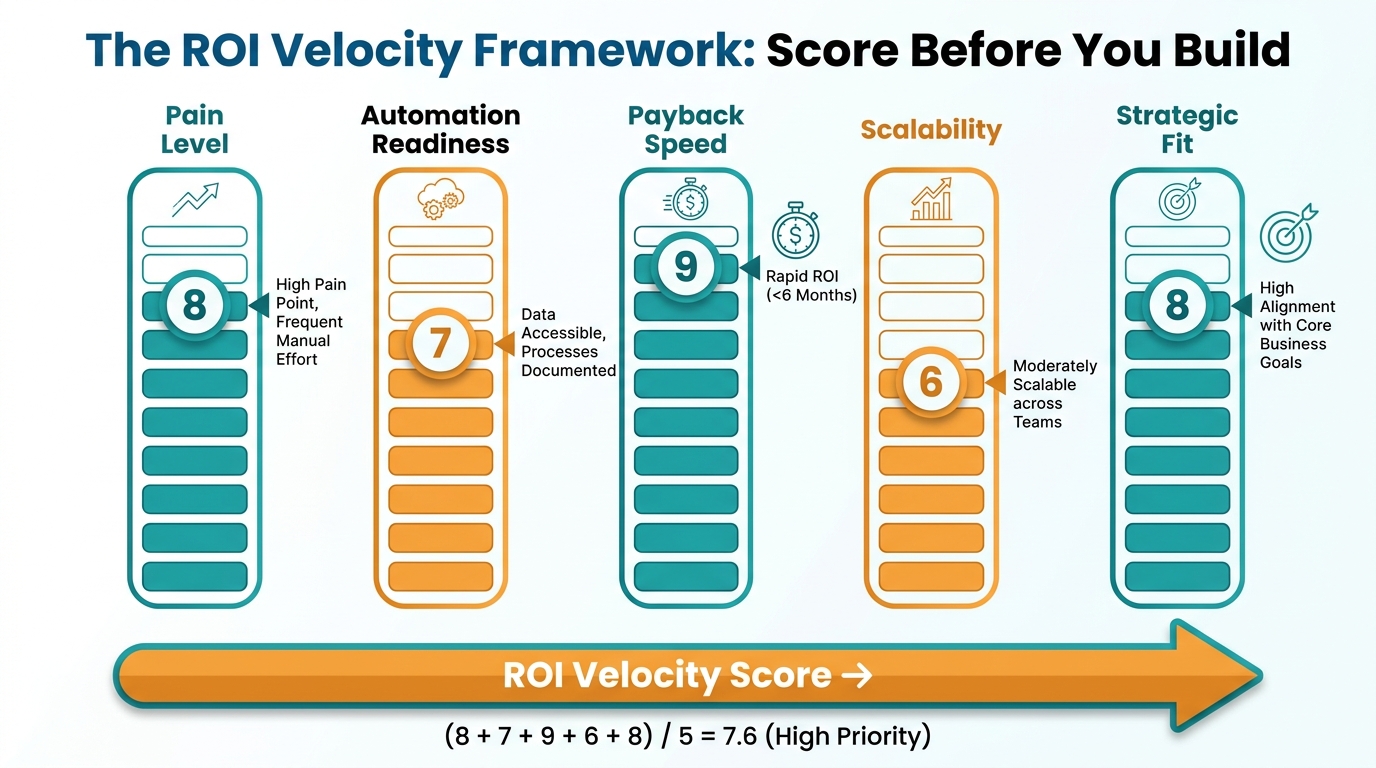
The framework below uses five factors, each scored 1–10, to produce an ROI Velocity Score. Workflows scoring 35 or above should be prioritized. Those below 20 should be deprioritized or redesigned first.
Factor 1: Pain Level (1–10)
How much measurable operational friction does this workflow currently create? Quantify it: how many hours per week are spent on it, how many errors occur, how many complaints or escalations trace back to it? High-pain workflows create the largest baseline to improve against — and the clearest before/after story when automation is applied. Score high if the process generates visible cost, delay, or error in current form.
Factor 2: Automation Readiness (1–10)
Is the data structured? Are the decision rules clear and documentable? Does the process follow consistent, repeatable patterns? AI automation thrives on well-defined inputs and outputs. A workflow where every case is unique, judgment-heavy, or data-sparse is a poor near-term candidate regardless of how painful it is. Score high if the process is rule-based, data-rich, and follows predictable patterns at least 70% of the time.
Factor 3: Payback Speed (1–10)
How quickly will benefits be measurable after deployment? Workflows with clear, quantifiable outcomes — hours saved, invoices processed, tickets resolved — will show ROI signals within weeks. Workflows with fuzzy outcomes — “improved employee experience,” “better strategic decision-making” — may take years to validate. Score high if you can draw a straight line from deployment to a measurable financial or efficiency number within 90 days.
Factor 4: Scalability (1–10)
Quick wins that don’t scale create a ceiling. An automation that saves 10 hours per week in one department is a good proof point. The same automation template deployed across six departments becomes a meaningful ROI story. Score high if the workflow pattern repeats across multiple teams, geographies, or business units with minimal customization required.
Factor 5: Strategic Alignment (1–10)
Does this automation free up capacity or generate insight in an area that’s genuinely important to the business’s next 12–18 months? Automations that align with active growth priorities get organizational attention, resources, and adoption. Those that address low-priority functions may deliver technically but languish from neglect. Score high if leadership considers the function a current bottleneck or a competitive pressure point.
Using the Score in Practice
A workflow scoring 40–50 should be the first project on your list. It’s high pain, highly automatable, fast to return, scalable, and strategically relevant. A workflow scoring 25–35 is worth tackling in the second wave, once you have organizational momentum and proof points from Wave 1. Anything below 20 is a later-stage project — either it needs process redesign before automation, or it’s simply not the right priority right now.
The discipline of scoring before building is what separates organizations that stack win after win from those perpetually chasing ROI that stays just out of reach.
The 4 Fastest-Returning Workflow Categories (With Real Benchmarks)
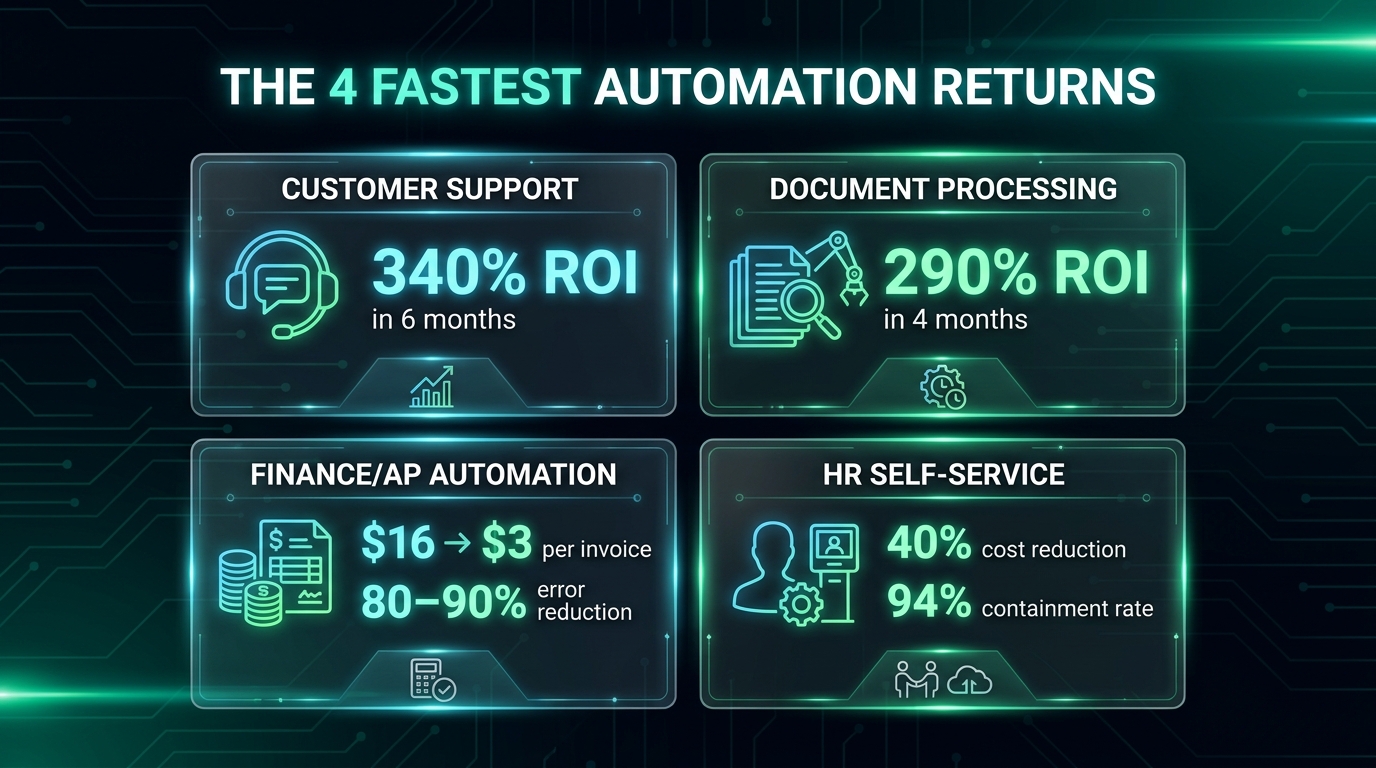
Industry data from 2026 consistently surfaces the same four workflow categories as the fastest paths to demonstrable ROI. Each has a combination of high volume, rule-based decision-making, clear baselines, and measurable outputs that make automation both technically tractable and financially legible.
1. Customer Support Automation
Customer support leads almost every industry analysis for speed of AI ROI. The reasons are structural: support workflows are high volume, driven by predictable inquiry patterns, and already measured obsessively via metrics like average handle time (AHT), first contact resolution (FCR), and cost per ticket. This creates an unusually clear before/after picture.
Benchmark data: Zendesk-cited research put customer support AI ROI at 340% within six months. A financial services provider that automated 55% of inbound inquiries saw response speed improve by 48%. Klarna’s widely-cited deployment generated savings equivalent to 700 full-time employees and contributed $40 million in profit impact. ServiceNow saved 410,000 hours — roughly $17.7 million in labor value — through support automation. Rachio, an irrigation technology company, deployed AI agents across chat, voice, and email, achieving 95–99.8% accuracy within weeks and cutting support costs by 30% while eliminating the need for seasonal hiring.
The key success pattern across these cases: automation was applied to containable inquiry types first — password resets, order status, billing questions, policy lookups — rather than complex resolution cases. This creates fast wins while building the data foundation for expanding automation to more nuanced interactions.
2. Intelligent Document Processing
Document-heavy operations — contracts, invoices, insurance claims, compliance filings, onboarding paperwork — represent some of the most labor-intensive and error-prone work in any organization. They’re also among the most automatable, because the structure of the information (even in unstructured documents) is predictable enough for modern AI to extract and classify reliably.
UiPath-published data cited 290% ROI within four months for intelligent document processing deployments. Ramp, the corporate finance platform, automated the processing of 400,000 invoices and 5 million receipts monthly, saving 30,000 manual hours and maintaining 90% accuracy. Pfizer saved 16,000 hours through enterprise document search and processing automation. Average processing time reductions of 70% are consistently reported across enterprise deployments.
The operational case is straightforward: a document that takes 8 minutes to manually process and verify costs roughly $4–6 in fully-loaded labor. At 10,000 documents per month, that’s $40,000–60,000 in monthly labor. Automation at 70% time reduction recaptures $28,000–42,000 monthly — paying for a mid-range IDP tool in weeks, not months.
3. Finance and Accounts Payable Automation
Finance automation — particularly accounts payable, invoice matching, and financial close processes — is where AI delivers some of its most auditable and executive-visible results. CFOs already speak the ROI language, which makes internal advocacy easier and adoption faster.
The per-invoice processing cost benchmark tells the story clearly: industry data places the average manual cost per invoice at $15–16. AI-assisted automation brings that to $3 — an 80% reduction. For an organization processing 5,000 invoices monthly, that’s $60,000–65,000 in monthly savings, or $720,000–780,000 annually from a single workflow. Error rates drop 80–90% in the same deployment, reducing the downstream cost of corrections and audit risk.
Financial close cycles — the month-end process of reconciling accounts and producing reports — have seen cycle-time reductions exceeding 90% in documented enterprise cases. Bank CenterCredit cut report errors by 40%, reduced analytics time significantly, and accelerated decision-making by 50%, saving 800 hours per month. McKinsey research found that AI-powered demand forecasting in supply chain and finance functions improves accuracy by 40–60%, reducing carrying costs and over-purchasing.
4. HR Self-Service Automation
Human resources departments handle an enormous volume of repetitive, policy-based inquiries — benefits questions, time-off requests, onboarding checklists, payroll queries, policy lookups. The content is predictable, the decision trees are documentable, and the volume is high enough to generate meaningful returns from automation.
IBM’s AskHR deployment is the defining case study in this category: the system handled 94% of HR inquiries without human intervention, reduced HR operations costs by 40%, and cut support ticket volume by 75%. ServiceNow’s HR automation saved 410,000 hours in a single year. Industry projections for 2026 suggest that AI will handle more than 50% of routine HR tasks across organizations that have deployed purpose-built tools.
The compounding effect in HR automation is worth noting: every hour recaptured from routine inquiry handling is an hour an HR team member can spend on retention strategy, talent development, culture work, or complex cases. The cost reduction is real, but the quality shift — from administrative triage to strategic function — is the longer-term argument for investment.
How Company Size Changes Your ROI Timeline
One of the most under-discussed dimensions of AI automation ROI is how dramatically company size changes the expected timeline, range of outcomes, and appropriate strategy. The benchmarks that apply to a 50-person professional services firm look almost nothing like those relevant to a 5,000-person enterprise — and conflating them leads to miscalibrated expectations in both directions.
The SMB Advantage: Speed and Simplicity
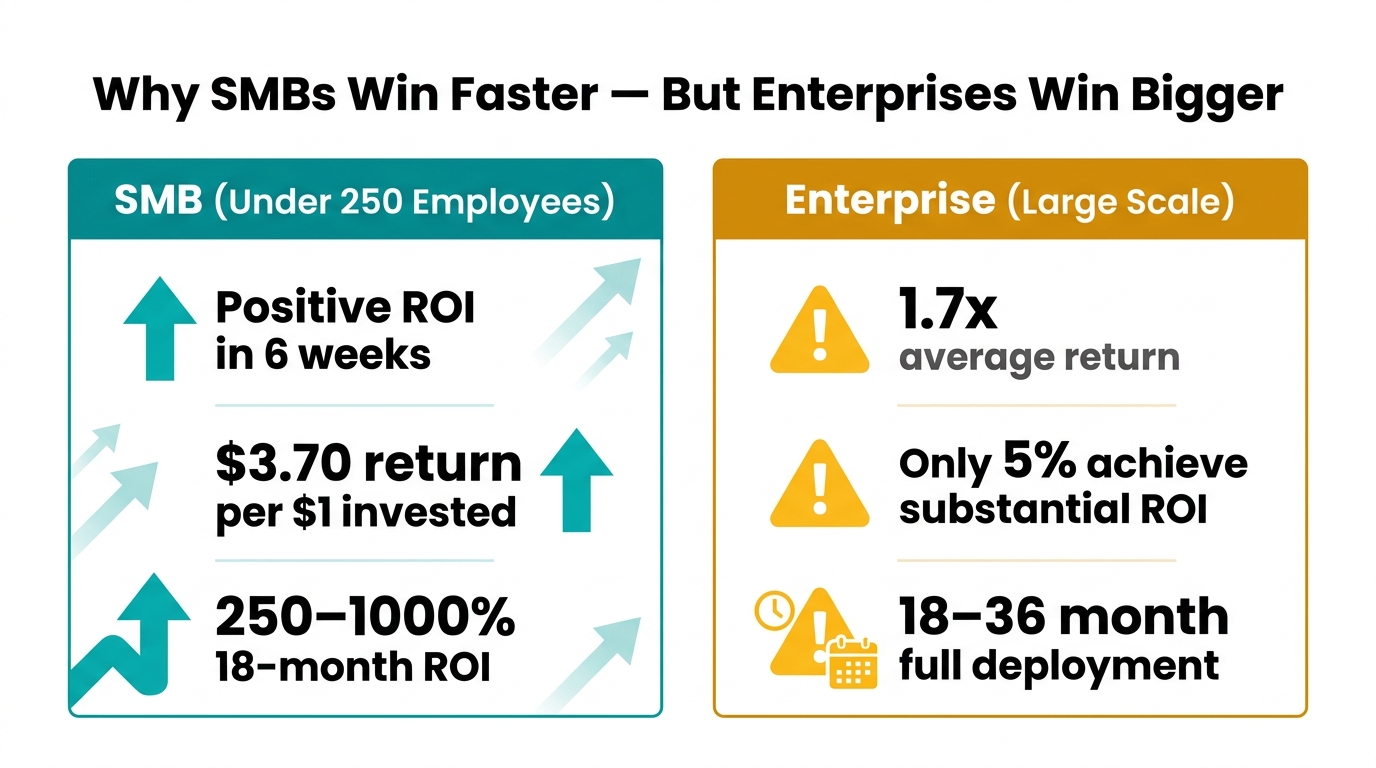
Small and mid-sized businesses (under 250 employees) have a structural advantage when it comes to time-to-ROI: fewer approval layers, less legacy infrastructure, and faster deployment cycles. According to 2026 data, SMBs report positive ROI in as little as six weeks from initial AI automation deployment, with an average return of $3.70 for every $1 invested. Over an 18-month horizon, that figure reaches 250–1,000% depending on the workflow and business model.
The workflows SMBs prioritize tend to be customer-facing — chatbots and support automation, AI-generated marketing content, scheduling and booking automation — because these have the most immediate and visible impact on revenue and customer experience. Sixty-six percent of SMB adopters report saving $500–$2,000 per month; 58% save 20 or more hours per month.
The limitation for SMBs is scale: these gains are real but bounded by the size of the operation. An SMB saving 20 hours per week has a legitimate win. The same pattern applied across a 200-person company would be transformational — but requires more infrastructure, more change management, and a longer runway to achieve.
The Enterprise Challenge: Scale vs. Speed
Enterprise organizations face almost the inverse problem. They have the scale to generate massive returns from automation, but that scale also introduces layers of complexity — legacy systems, data governance requirements, cross-functional dependencies, change management overhead — that slow the path to ROI.
The top-line number for enterprises looks strong in aggregate: 72% of large enterprises have adopted AI automation in at least one function, and median three-year ROI on well-implemented deployments runs 300–330%. But the distribution of outcomes is highly skewed. Research consistently finds that only 5% of enterprises achieve substantial ROI at scale. The majority report partial returns, delayed timelines, or returns that don’t survive a rigorous attribution analysis.
The root cause isn’t that AI doesn’t work at enterprise scale. It’s that enterprises tend to deploy in ways that prioritize ambition over velocity — large, integrated programs that touch multiple systems and require cross-departmental buy-in before any single component can go live. By the time the first value signal arrives, the original sponsors may have moved on, the budget may have been revised, and the organizational appetite for the project may have eroded.
The Midmarket Sweet Spot
Companies in the 250–2,000 employee range occupy an interesting position: large enough to have high-volume workflows that generate meaningful automation returns, but small enough to deploy and measure with relative speed. This is arguably the cohort where the ROI Velocity Framework delivers the most consistent results — the workflows are large enough to matter, the implementation is contained enough to execute cleanly, and the measurement is straightforward enough to be credible.
For midmarket organizations, the playbook is to target one department at a time, build a proof-of-concept with documented ROI, and use that proof point to unlock resources for the next department. This “accordion model” of gradual expansion has consistently outperformed big-bang enterprise automation programs in time-to-ROI benchmarks.
The Hidden Cost Traps That Quietly Wreck AI ROI
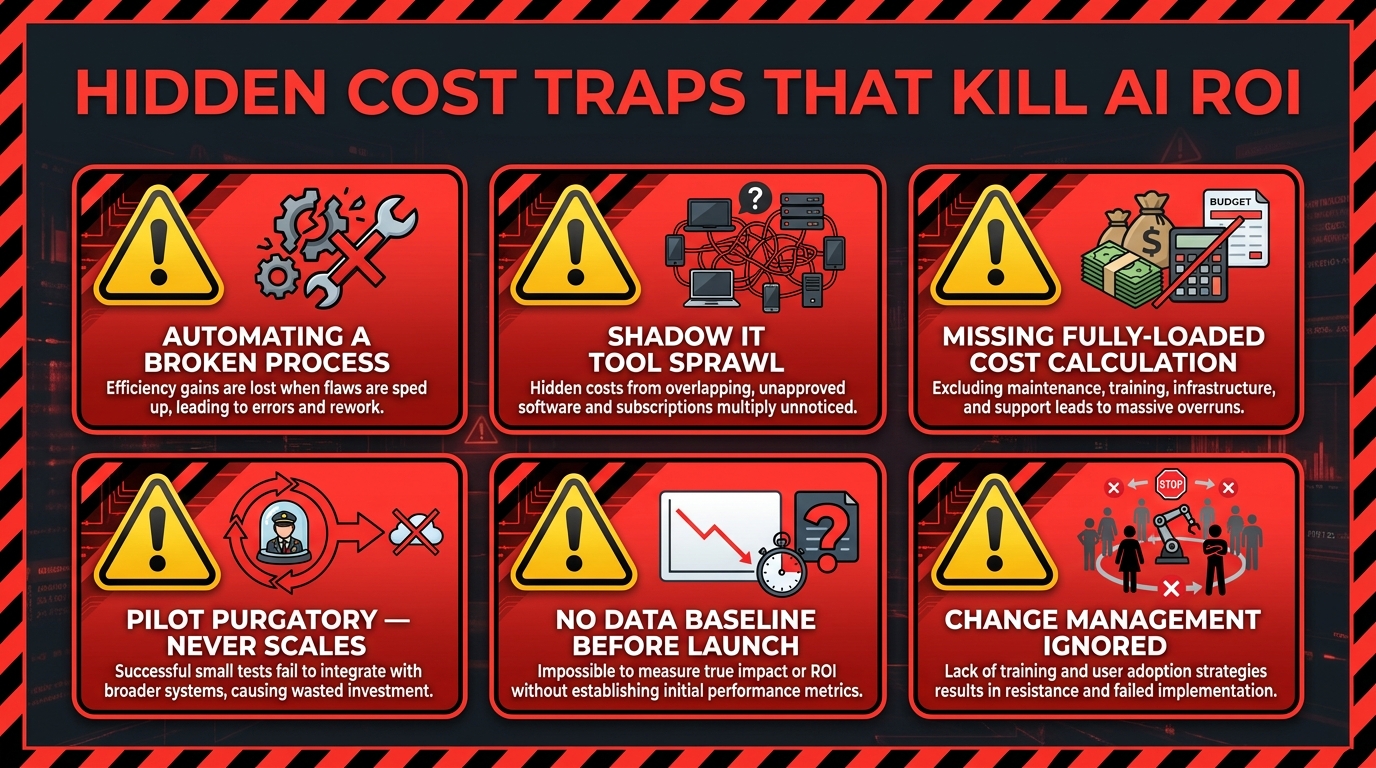
Even well-chosen automations can fail to deliver ROI if hidden cost factors erode the returns before they’re captured. These traps aren’t theoretical — they account for a significant portion of the 80% failure rate, and they tend to appear after the initial deployment enthusiasm has faded.
Trap 1: The Fully-Loaded Cost Blind Spot
The most common miscalculation in AI automation ROI is using base salary as the labor cost benchmark, rather than fully-loaded cost. Fully-loaded cost — which includes benefits, payroll taxes, office space, equipment, management overhead, and training — typically runs 1.35–1.55 times base salary. For a $60,000 employee, that’s $81,000–93,000 in actual cost to the organization.
This matters because the ROI calculation changes substantially. An automation saving 10 hours per week from a $60,000 employee generates $15,000 annually in base-salary terms but $20,000–24,000 in fully-loaded terms. Both are real returns, but the gap affects whether a project clears the internal payback hurdle and how many projects you can justify running simultaneously.
Trap 2: Shadow IT Tool Sprawl
As AI automation tools have become more accessible — many requiring little or no coding — individual teams frequently adopt them independently without IT governance. Marketing uses one AI writing tool. Sales uses a different one for proposals. Finance uses yet another for report generation. Each generates local value, but the aggregate cost — licensing fees, redundant training, inconsistent data, security exposure, and the time spent managing multiple vendors — often exceeds the savings.
Organizations that experience AI tool sprawl typically discover it when they audit total spend against documented ROI. The individual tools can’t be easily measured in aggregate, the data they produce doesn’t flow into central systems, and the organization can’t build on the outputs of any single tool because they’re not connected. Governance policies for AI tool adoption aren’t bureaucratic overhead — they’re ROI protection.
Trap 3: No Baseline Before Deployment
It’s extraordinarily difficult to prove ROI from an automation if you didn’t document what the process looked like before you automated it. Yet many organizations deploy AI tools without establishing a documented baseline — and then find themselves unable to demonstrate return when leadership asks for it three months later.
Best practice is to time at least 10 instances of each target workflow before deployment, capturing total time including interruptions and handoffs. Frequency data — how many times the workflow runs per week, per month — should come from 90 days of historical data rather than estimates. These two inputs, multiplied against fully-loaded cost, create a defensible baseline number that makes the post-deployment ROI case automatic.
Trap 4: Change Management as an Afterthought
Technology deployment without adoption is zero ROI. This is the most human element of the hidden cost problem. If the team that’s supposed to use an automated system doesn’t trust it, doesn’t understand it, or actively routes around it, the investment produces nothing regardless of how technically sound the implementation is.
Adoption failure is particularly acute with AI tools because they often require users to modify long-standing habits and accept AI-generated outputs as authoritative — a cognitive adjustment that many people resist without active support. Organizations that invest in change management, training, and internal champions consistently report higher adoption rates and faster time-to-ROI than those that treat deployment as a technology project rather than an organizational change.
Trap 5: The Maintenance Cost Gap
AI automations are not “set and forget” systems. Models drift as underlying data changes. Integrations break as vendors update APIs. Edge cases accumulate as business conditions evolve. The ongoing cost of maintaining an AI automation — monitoring performance, retraining models, updating integrations, managing exceptions — is typically underestimated by 30–50% in initial business cases.
Industry data puts average hidden cost per failed AI initiative at $4.2–8.4 million for enterprise projects. Even for smaller deployments, maintenance costs that weren’t anticipated in the original ROI model can quietly reduce actual returns to a fraction of projected figures. Build a maintenance budget — typically 15–25% of initial implementation cost per year — into every business case from the start.
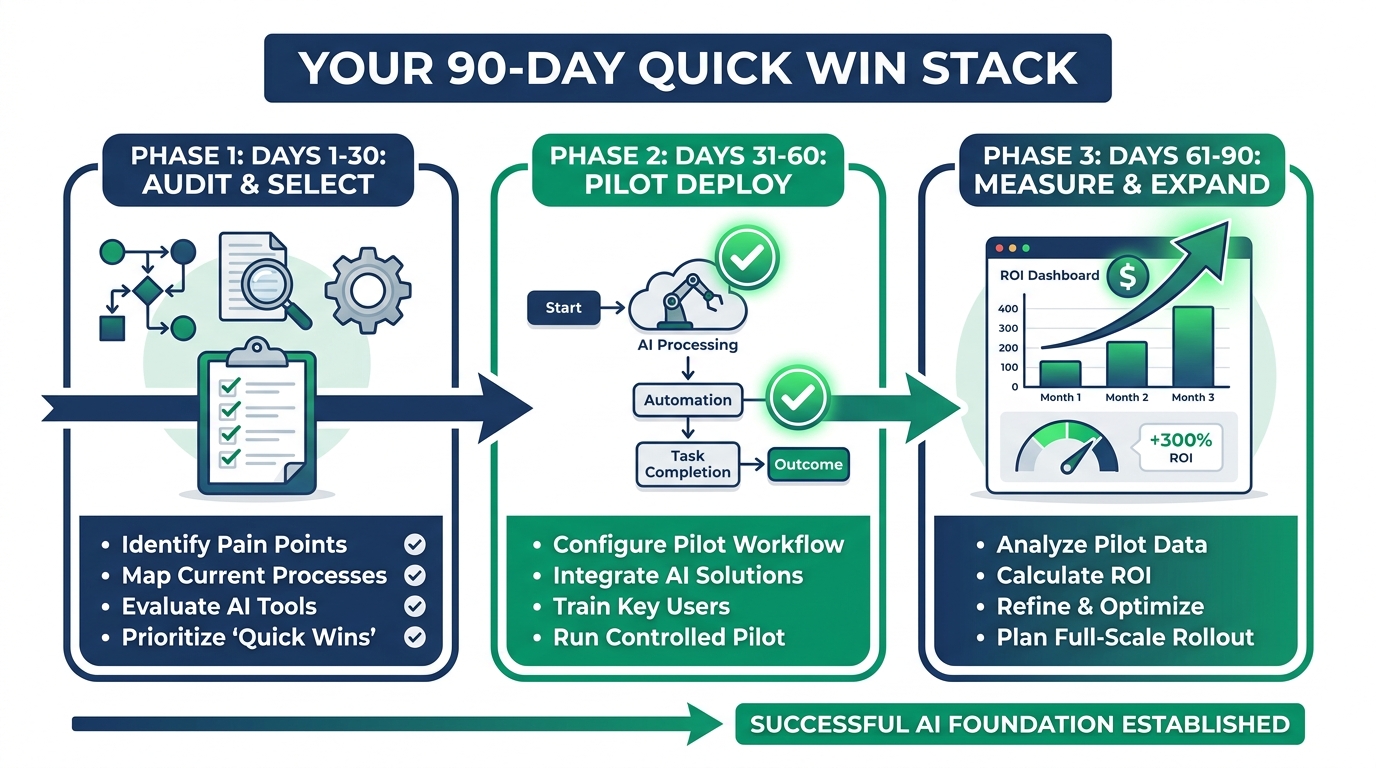
Building Your 90-Day Quick Win Stack
The 90-day framework isn’t a shortcut to long-term AI transformation — it’s the mechanism for generating the proof points and organizational momentum that make long-term transformation possible. Most successful enterprise-scale AI programs started with a 90-day sprint on a single, well-chosen workflow. The returns from that sprint funded and justified the next sprint, and so on.
Days 1–30: Audit and Select
The first 30 days are not about technology. They’re about clarity. The goal is to identify the two or three workflows that score highest on the ROI Velocity Framework and to document their current-state performance with enough rigor to support a before/after comparison.
Key activities:
- Run a workflow audit across the departments most likely to yield fast returns: customer support, document processing, finance operations, HR self-service.
- Time each candidate workflow across at least 10 real instances. Capture total elapsed time including handoffs, not just active processing time.
- Pull 90 days of volume data for each workflow. How many times per week does it run? How many people touch it?
- Calculate the fully-loaded labor cost baseline for each workflow (volume × time × fully-loaded hourly rate).
- Score each workflow on the five-factor ROI Velocity Framework. Select the top two.
- Map any process redesign work required before automation can be applied effectively.
The output of this phase is a one-page business case for each selected workflow: current cost, projected post-automation cost, estimated payback period, and the metrics that will confirm success.
Days 31–60: Pilot Deployment
With a clear target and documented baseline, this phase is about getting something working and measuring it. The emphasis is on speed and containment — not perfection. Deploy in a controlled scope. One team, one process, one measurable outcome.
Key activities:
- Select tooling appropriate to the workflow. For customer support, this likely means a conversational AI platform with existing integrations. For document processing, an IDP tool with pre-trained models. For AP automation, a finance-specific workflow tool. Avoid building from scratch during the 90-day sprint.
- Identify an internal champion — someone on the team who will be the primary user and adoption advocate. This person is as important as the technology selection.
- Configure, test, and deploy to a controlled user group. Monitor error rates, exception patterns, and adoption behavior daily in the first week.
- Continue measuring against your pre-deployment baseline. Track hours saved, errors reduced, and volume handled by the automation vs. manually.
- Document every exception and failure mode. These are inputs to refining the automation, not reasons to abandon it.
The goal of this phase is not a polished product. It’s a working system with real performance data that can be compared against the baseline you established in Phase 1.
Days 61–90: Measure, Refine, and Expand
This phase converts the pilot into a proof point and the proof point into a scaling roadmap. By day 90, you should have enough data to calculate a real — not projected — ROI number, and a clear picture of what would happen if you applied the same pattern to additional workflows or departments.
Key activities:
- Calculate realized ROI against the baseline: (Hours saved × fully-loaded hourly rate − implementation cost) ÷ implementation cost × 100. Compare to your projection.
- Identify the three to five exceptions or failure modes from the pilot that, if resolved, would increase automation coverage. Prioritize fixing those before expanding.
- Document the deployment pattern: what decisions were made, what tools were selected, what integrations were required, what change management worked. This becomes the template for the next sprint.
- Present results to leadership with a concrete proposal for the next 90-day sprint — either expanding the current automation to additional teams or deploying the same methodology to the second workflow identified in Phase 1.
Organizations that follow this structure consistently see their second-wave automations deploy 30–50% faster than the first, because the team has internalized the framework and the internal skepticism that often slows Wave 1 has been replaced by documented proof.
The Measurement Architecture Most Companies Get Wrong
ROI is a math problem, but measuring it accurately requires a data structure that most organizations don’t have in place before they start automating. The result is a measurement gap: companies deploy AI, generate real returns, and then can’t credibly demonstrate those returns because they didn’t track the right things from the beginning.
The Three Measurement Horizons
AI automation ROI doesn’t arrive all at once. It compounds across three distinct time horizons, each requiring different metrics:
30–60 days (Operational signals): Time saved per workflow instance, error rate reduction, volume handled by automation vs. manually. These are the most immediate, most granular, and most compelling numbers for internal skeptics. They don’t require financial modeling — they’re direct measurements of the work being done.
3–6 months (Financial impact): Annualized labor cost savings, reduction in rework and correction cost, change in customer-facing metrics like response time and satisfaction scores (where applicable). This is where the business case starts to speak in CFO language and where the conversation shifts from “is this working?” to “how do we do more of this?”
12–24 months (Strategic value): Capacity redeployed to higher-value work, revenue impact from faster cycle times or improved accuracy, competitive positioning gains. These are harder to measure precisely, but they’re the most durable argument for sustained investment in AI automation as a business capability rather than a cost-cutting exercise.
The Measurement Formula
The core ROI formula for AI automation is:
ROI = [(Annual time saved × fully-loaded hourly cost) + Cost reductions + Revenue increases − Total investment cost] ÷ Total investment cost × 100
Total investment cost includes not just licensing fees but implementation time (at fully-loaded cost), integration work, change management activities, training, and first-year maintenance — which is frequently 15–25% of the initial implementation cost.
A more sophisticated version of this formula weights different return types differently, reflecting that some returns are more certain than others:
Comprehensive ROI = (Financial ROI × 40–60%) + (Operational ROI × 25–35%) + (Strategic ROI × 15–25%)
This approach prevents organizations from counting uncertain strategic returns at face value and inflating their ROI projections in ways that create credibility problems when actual returns are measured.
Build Your Measurement Cadence
Measurement without a cadence is measurement that never happens. Establish a simple tracking rhythm from day one:
- Weekly: Utilization rate (what % of target workflows are running through automation vs. manually), error rate, exception volume.
- Monthly: Hours saved, labor cost reduction, adoption rate by user/team.
- Quarterly: Full ROI calculation against baseline, comparison to projection, and a documented recommendation for the next quarter (expand, refine, or replace).
Scaling From Quick Wins to Sustained Returns
The 90-day sprint model generates momentum, but momentum isn’t the same as sustained transformation. The organizations that convert quick wins into durable competitive advantage do three things consistently that others don’t.
They Build a Center of Excellence
A Center of Excellence (CoE) for AI automation isn’t a large bureaucracy. In many companies it’s two or three people — part-time in smaller organizations — whose job is to own the deployment methodology, maintain the tool portfolio, track ROI across all active automations, and manage the pipeline of future projects.
Without a CoE, what tends to happen is that successful automations get adopted by the departments that deployed them and then forgotten at the organizational level. No one knows what tools the company has, what they cost, what they’re doing, or what they’re delivering. The company is paying for multiple overlapping tools, generating returns in silos, and making no progress on the cross-functional patterns that would generate enterprise-scale returns.
A CoE changes this by creating a single source of truth for automation activity — and a single advocate for the investment required to expand it.
They Treat Data as Infrastructure
Every AI automation generates data. The workflow logs, exception reports, accuracy metrics, and performance benchmarks from each deployed automation are an asset — if they’re captured, centralized, and analyzed. Organizations that build data infrastructure around their automation programs are able to identify patterns across workflows, improve automation performance systematically, and make evidence-based decisions about where to automate next.
Those that don’t build this infrastructure find themselves repeating the same exploratory work for each new automation, unable to apply lessons learned from one deployment to the next, and unable to answer basic questions like “which of our automations is generating the highest return per dollar invested?”
They Reinvest Returns Into Capacity
The organizations generating the most durable ROI from AI automation have a deliberate policy of reinvesting a portion of automation savings into the capacity to deploy more automations. This might mean dedicating saved labor hours to process improvement work, using cost savings to fund CoE headcount, or allocating a percentage of documented ROI to the next automation sprint.
This creates a self-funding flywheel: automation savings pay for more automation, which generates more savings, which fund more automation. Companies that treat automation returns as pure cost reduction — taking savings directly to the bottom line without reinvestment — typically plateau after the initial wave. Those that reinvest build a compounding advantage.
Red Flags That Signal an AI Project Is Heading for Failure
Not every automation that starts should finish. Recognizing the warning signs of a failing project early enough to course-correct — or cut losses — is a critical skill that separates sophisticated automation programs from those that perpetuate expensive mistakes.
Red Flag 1: No Measurable Baseline
If a project launched without a documented before-state — and you’re now three months in — this is urgent. It’s not too late to establish a current-state baseline and measure forward from it, but every day you wait makes the eventual ROI case weaker. Prioritize this immediately.
Red Flag 2: Adoption Below 40% at 60 Days
If fewer than 40% of intended users are using the automation regularly at the 60-day mark, the project is in trouble. This is almost never a technology problem at this stage — it’s an adoption problem. Investigate whether users understand the system, whether they trust its outputs, and whether the process requiring them to use it is actually easier than their workaround. Address the root cause, not the symptom.
Red Flag 3: Exception Rate Above 30%
An automation handling exceptions manually more than 30% of the time isn’t automating — it’s adding a technology layer to manual work. Exceptions above this threshold typically indicate that either the process wasn’t ready for automation (poor automation readiness score) or the AI model wasn’t trained on sufficiently representative data. Both are fixable, but they require a deliberate intervention, not continued monitoring.
Red Flag 4: No Path to Scaling
A pilot that has no documented scaling plan by day 60 has entered pilot purgatory. If you can’t describe in concrete terms how this automation would be expanded — to which teams, on what timeline, with what resources — the project will likely stagnate after the pilot phase regardless of how well it performs locally. Define the scaling path before the pilot concludes.
Red Flag 5: The ROI Story Keeps Changing
If the projected ROI keeps being revised forward — “we’ll see returns by Q2” becomes “Q3” becomes “by year-end” — this is a signal that either the underlying assumptions were wrong or the measurement framework is inadequate. Conduct a clean retrospective against the original business case. If the fundamental assumptions don’t hold, it’s better to acknowledge this and recalibrate than to continue defending a projection that has lost credibility.
The Measurement Trap: When Your ROI Numbers Are Right But Your Conclusions Are Wrong
There’s a final, counterintuitive failure mode worth examining: organizations that measure accurately but draw the wrong strategic conclusions from their data. This happens more often than most practitioners acknowledge, and it tends to cause expensive misdirection at the scaling phase.
Correlation vs. Causation in Automation ROI
An automation deployed in a customer support team that coincides with a product improvement, a seasonal drop in inquiry volume, or an improvement in first-call resolution from better training will generate a measured improvement — but that improvement isn’t solely attributable to the automation. This seems obvious, but organizations under pressure to demonstrate AI ROI sometimes attribute too much to the automation and not enough to the other factors.
The solution is controlled measurement: run the automation in a subset of the team and compare against a control group that doesn’t use it, or use pre-period/post-period analysis with explicit acknowledgment of confounding factors. Measurement that can’t survive basic scrutiny will be challenged — often at the worst possible moment, when budget decisions are being made.
The Redeployment Assumption
Almost every AI automation business case includes an assumption that labor time saved will be redeployed to higher-value work. In some organizations, this happens naturally and demonstrably. In others, saved time is simply absorbed into the ambient workload without any strategic redirection. This distinction matters enormously for the long-term ROI case.
If automation saves a team 15 hours per week but those 15 hours aren’t directed toward any specific higher-value activity, the financial case rests entirely on cost reduction — which is real, but limited. If those 15 hours are directed toward retention calls, strategic analysis, or revenue-generating activity, the ROI case expands dramatically. Build the redeployment plan before deployment, not after.
Conclusion: Sequencing Is the Strategy
The organizations that generate the fastest ROI from AI process automation aren’t the ones with the biggest budgets, the most sophisticated technology stacks, or the most ambitious visions. They’re the ones that do a simple but demanding thing consistently: they choose the right workflows in the right order and measure the results with enough rigor to build on them.
The data is clear on what that looks like in practice. Customer support automation delivers 340% ROI in six months. Intelligent document processing returns 290% in four months. Finance AP automation cuts per-invoice costs by 80%. HR self-service deployments reduce operational costs by 40% while improving the quality of work the team can do. These aren’t projections — they’re documented results from organizations that got the sequencing right.
The same data is clear on what failure looks like: automating processes before they’re ready, deploying without a baseline, skipping adoption work, underestimating maintenance costs, and letting pilots expire without scaling paths. These patterns account for the 80%+ failure rate that the industry continues to report year after year.
The gap between those two outcomes isn’t technical sophistication. It’s strategic discipline. It’s the willingness to score workflows before building them, to measure with rigor from day one, to spend the first 90 days on proof points rather than ambition, and to treat the returns from each sprint as fuel for the next.
If your organization is at the beginning of this journey, start with the ROI Velocity Framework and score your candidate workflows today. If you’re already mid-deployment and not seeing returns on the timeline you projected, the red flags in this guide are a diagnostic checklist worth working through before the next budget cycle.
Either way, the speed of your ROI is not a function of how fast the technology moves. It’s a function of how clearly you can answer the question every winning automation starts with: which workflow do we run first?
Key Takeaways
- 80.3% of AI automation projects fail — most because of poor workflow selection and sequencing, not poor technology.
- The four fastest-returning categories are customer support (340% ROI/6 months), document processing (290% ROI/4 months), finance/AP automation, and HR self-service.
- Score workflows before you build using the five-factor ROI Velocity Framework: Pain Level, Automation Readiness, Payback Speed, Scalability, and Strategic Alignment.
- SMBs see positive ROI in 6 weeks on average; enterprises face longer timelines but only 5% achieve substantial returns at scale — sequencing discipline is the differentiator for both.
- The 90-day sprint model — audit and select, pilot deploy, measure and expand — is the most reliable path from zero to documented ROI.
- Hidden costs including shadow IT sprawl, missing baselines, change management failures, and underestimated maintenance erode returns from otherwise sound deployments.
- Reinvesting automation savings into the next sprint creates a compounding flywheel; treating every return as pure bottom-line capture causes programs to plateau.