Most Intelligent Process Automation initiatives start with genuine momentum. A compelling vendor demo. A pilot that wows the team. Executives nodding in boardroom meetings about “transforming operations.” Then, somewhere between the proof of concept and the quarterly review, reality arrives — and it rarely matches the slide deck.
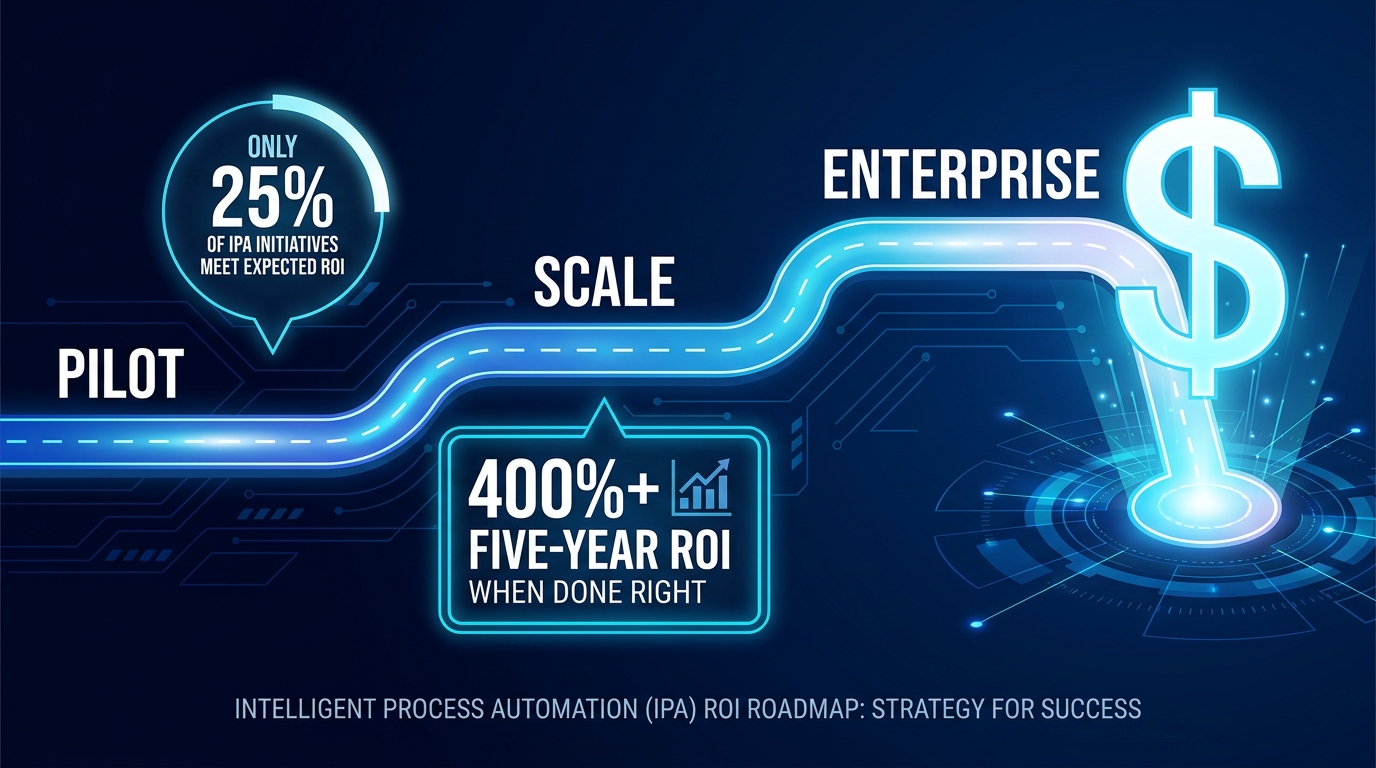
The numbers are sobering. Research consistently shows that only about 25% of IPA initiatives meet their original ROI expectations. A mere 16% ever scale to enterprise-wide deployment. Up to 70-90% of enterprise automation projects are classified as underperforming or outright failures — not because the technology doesn’t work, but because the financial model, governance structures, and measurement frameworks were never built to survive contact with reality.
This is not a technology problem. It’s a business case problem. And it’s fixable.
This roadmap is written for the people who sit between the automation vendors and the finance committee: the operations leaders, transformation directors, and program managers who need to build an IPA business case that gets approved, survives implementation, and produces returns that actually compound over time. We’ll walk through every phase — from the first CFO conversation to board-level proof — with the specific numbers, frameworks, and traps that most implementations either overlook entirely or discover too late.
The IPA ROI conversation in 2026 has matured. Vague promises about “efficiency gains” don’t move budgets anymore. What follows is what does.
What CFOs Actually Want to See Before Signing Off on IPA
The moment an IPA business case hits a CFO’s desk, it gets evaluated through a very specific lens — one that most technology-led teams aren’t naturally calibrated to. CFOs are not skeptical of automation because they distrust the technology. They’re skeptical because they’ve been burned before by project budgets that ballooned, timelines that slipped, and “productivity savings” that never showed up as actual headcount reductions or margin improvements.
The Four Financial Metrics That Move Decisions
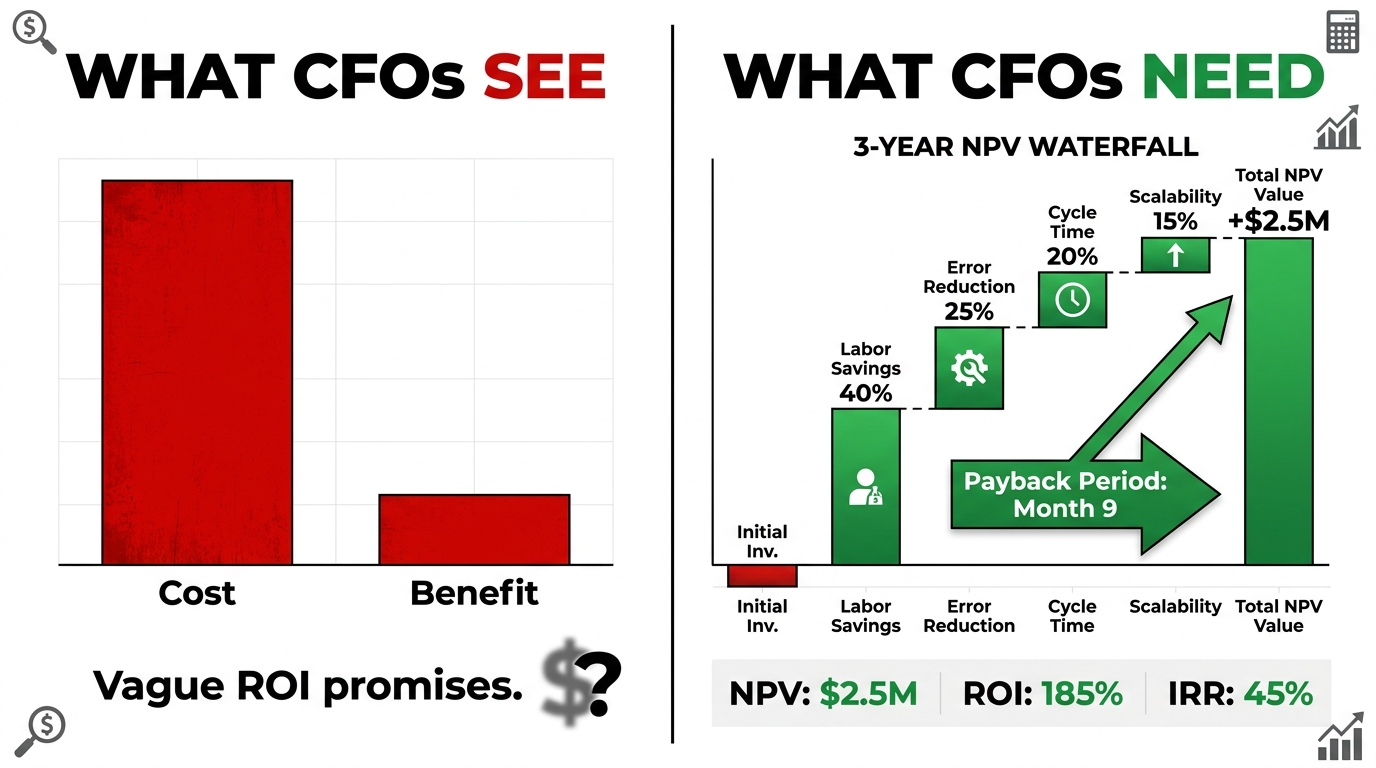
A defensible IPA business case in 2026 needs to lead with four core financial constructs — not general productivity narratives:
- Net Present Value (NPV) over a 3-5 year horizon. This forces the team to think beyond year-one savings and account for ongoing costs, model drift, and maintenance overhead. An IPA initiative that looks great in year one but deteriorates in year three is a liability, not an asset.
- Internal Rate of Return (IRR) compared against the company’s cost of capital. If your IPA program’s IRR doesn’t clear the hurdle rate, it competes poorly against other capital allocation decisions. This calculation is non-negotiable in mature finance functions.
- Payback Period expressed in months, not years. CFOs want to know when the initiative becomes self-funding. For well-scoped IPA pilots, this should be achievable in 4-14 months depending on the use case and industry.
- Total Cost of Ownership (TCO) broken into a minimum of three years. Single-year cost models consistently understate the true investment, which is why so many initiatives appear more attractive at approval than they prove out in practice.
Scenario Modeling: Conservative, Expected, and Optimistic
One of the clearest signals of a mature IPA business case is scenario modeling. Rather than presenting a single set of projections, leading programs present three distinct cases — each with explicitly stated assumptions.
The conservative case assumes lower automation rates, higher exception handling requirements, and a longer-than-expected ramp. The expected case uses validated benchmarks from comparable deployments. The optimistic case illustrates the ceiling if adoption is strong and processes are well-prepared. This framing does something critical: it pre-empts the CFO’s objection before it’s raised and demonstrates that the team understands the risk landscape, not just the upside.
Hard Benefits vs. Soft Benefits — and Why the Mix Matters
Finance functions in 2026 are increasingly suspicious of automation business cases dominated by “soft” benefits — things like employee satisfaction, strategic flexibility, and future capability building. These are real, but they don’t pay back capital.
A fundable business case typically structures benefits in a clear hierarchy:
- Hard, cashable benefits: Direct labor cost reduction (where headcount is actually reduced or redeployed), error-related rework costs eliminated, and penalty avoidance from compliance failures.
- Hard, non-cashable benefits: FTE capacity released for higher-value work (can be monetized as cost avoidance if you can prove the alternative was hiring).
- Soft benefits: Customer experience improvements, employee engagement gains, strategic agility. These belong in the case, but not as primary justification.
Research from 2026 benchmarking studies shows the strongest IPA business cases split their projected benefit value roughly as follows: 40-50% labor savings, 15-25% error reduction and rework elimination, 10-20% cycle time acceleration, and 20-35% scalability and capacity redeployment. That’s the mix that gets funded.
The Real Cost Stack — Mapping TCO Beyond Licensing
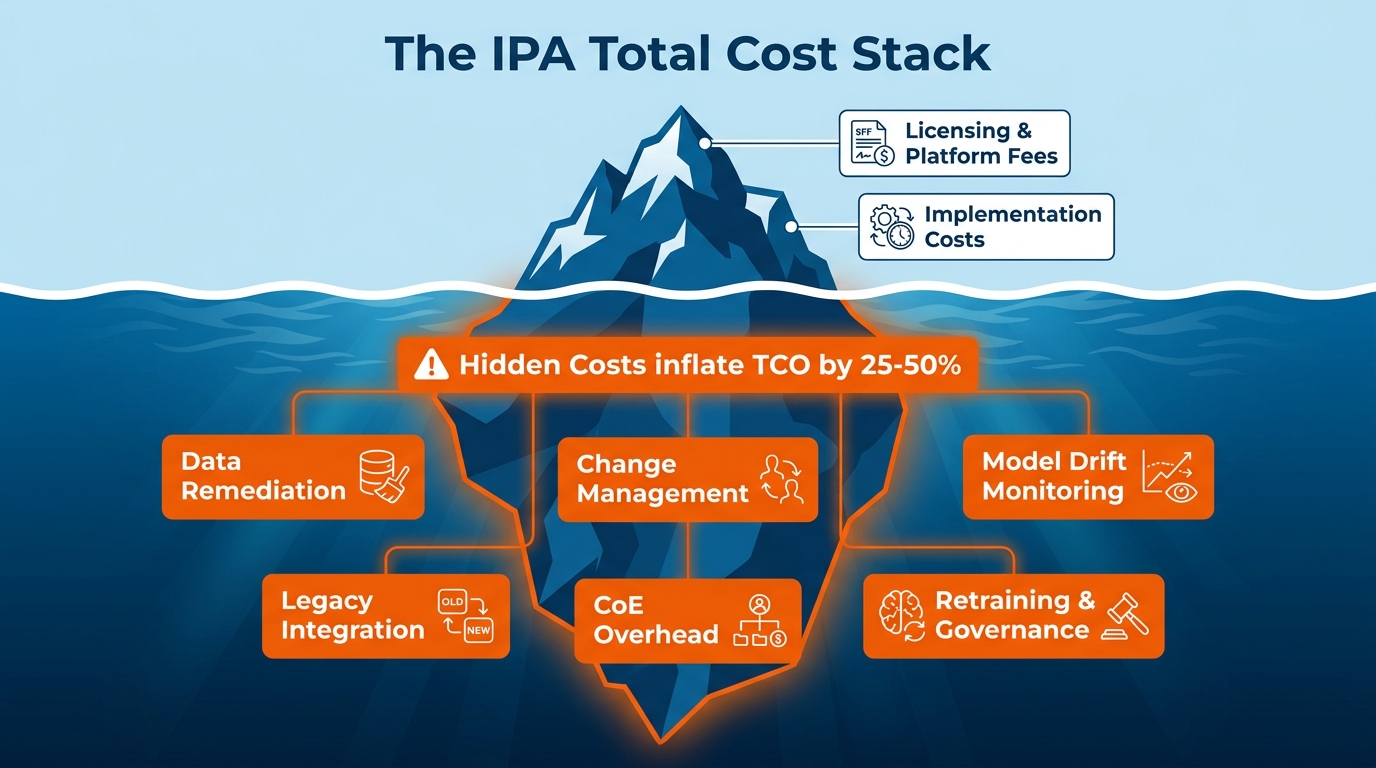
The most consistent pattern in failed IPA programs is not technological underperformance — it’s cost overruns that weren’t anticipated because the initial TCO model was incomplete. Hidden costs routinely inflate the real total cost of ownership by 25-50% above the approved budget, and they tend to surface at the worst possible moments: mid-implementation, when there’s no appetite to pull back and no room left in the budget.
Tier 1: Visible Costs (What Makes It Into Every Budget)
These are the costs teams reliably account for — they appear in vendor proposals and integration scoping documents:
- Platform licensing: The annual or per-bot subscription fees from vendors like UiPath, Automation Anywhere, ServiceNow, or Microsoft Power Automate. These are usually the most visible line item in the business case.
- Implementation and professional services: System integrator fees, configuration work, and initial workflow development costs. These often run 1.5-3x the first year of licensing for complex deployments.
- Infrastructure and cloud compute: The compute costs for running AI models, orchestration layers, and data pipelines. These scale non-linearly as deployments grow, and teams frequently underestimate them by 30-40%.
Tier 2: Semi-Visible Costs (Sometimes Included, Often Underweighted)
- Internal IT time: The hours your IT team spends on integration, security reviews, testing, and ongoing maintenance. These rarely appear as a cash cost, but they represent significant opportunity cost and can consume 20-30% of a senior developer’s annual capacity.
- Process documentation and redesign: Before you can automate intelligently, processes need to be mapped, cleaned, and often fundamentally redesigned. This work is consistently underestimated in timelines and budget.
- Training and onboarding: End-user training, administrator certification, and the productivity dip that follows any significant workflow change.
Tier 3: Hidden Costs (Almost Never in the Original Budget)
These are the costs that sink otherwise solid programs:
- Data remediation: Cited as the top obstacle in 85% of AI and automation failures, poor data quality means that before IPA can work effectively, the underlying data infrastructure often needs significant investment. This can range from tens of thousands to millions of dollars depending on the data landscape.
- Legacy system integration: APIs that don’t exist, custom connectors that need to be built, and middleware layers that were never designed for intelligent automation. These integration gaps add 20-30% to implementation timelines and costs.
- Model drift and retraining: AI models within IPA systems don’t stay accurate indefinitely. Business processes change, exception patterns shift, and the models need ongoing monitoring, retraining, and validation. Few initial budgets include a line item for this.
- Center of Excellence (CoE) overhead: Scaling IPA enterprise-wide requires a governance function — a team responsible for standards, prioritization, vendor management, and quality assurance. This is a recurring operating cost that starts modest and grows with program scope.
- Change management: The full cost of communications, stakeholder engagement, process adoption campaigns, and the management time required to drive behavioral change. This is covered in more detail in a later section, but budget under-allocation here is the single most common reason implementations achieve technical success but operational failure.
The practical implication: when building your TCO model, add a minimum 30% contingency buffer to your Tier 1 and Tier 2 estimates, and build Tier 3 costs from first principles — not as a percentage of the visible cost stack.
Phase 1 — Pilot ROI: Choosing Processes That Pay Back Fast
The pilot phase — typically covering the first 90 days to six months of an IPA program — sets the trajectory for everything that follows. A well-chosen pilot creates political momentum, validated benchmarks, and a replicable template for scaling. A poorly chosen pilot generates technical complexity, missed timelines, and a finance committee that becomes permanently skeptical of the program.
The Process Selection Scorecard
Experienced IPA program teams don’t select pilot processes based on which ones the business stakeholder champions most loudly. They use a scoring model that evaluates processes against four criteria:
- Volume and frequency: High-volume, high-frequency processes generate the most raw savings per hour of automation. Processes that run hundreds or thousands of times per day deliver measurable results quickly.
- Standardization: Processes with clearly defined rules, predictable inputs, and limited exception handling are easiest to automate successfully. For a first pilot, resist the temptation to automate the most complex, high-stakes process in the organization.
- Data readiness: The process needs to be fed by data that is clean, structured, and accessible. A process with perfect candidate characteristics on paper becomes a nightmare if the underlying data is fragmented across five legacy systems.
- Business impact and visibility: The pilot needs to generate results that matter to a senior stakeholder and are easy to explain. The best pilots combine strong financial returns with a story that resonates in a board update.
Realistic Pilot ROI Benchmarks
Based on 2026 benchmarking data across enterprise deployments:
- Well-scoped pilots targeting invoice processing, data reconciliation, or customer query routing typically achieve payback in 2.5 to 6 months.
- Finance automation pilots (invoice matching, reconciliation) show documented savings of approximately $124,800 per year for 20-person teams, with one detailed case study showing 420% Year-1 ROI with a 2.5-month payback on a $175,000 annual savings target.
- Coding and developer productivity pilots show some of the highest task-level gains — up to 55.8% faster coding speed — though these are harder to convert directly to headcount savings.
- Customer support automation: documented 15% productivity improvement at the task level, with containment rates exceeding 84% in advanced deployments (meaning 84 out of 100 interactions handled without human intervention).
What the Pilot Must Prove Beyond the Numbers
The pilot phase exists to answer three questions that the business case couldn’t definitively answer in advance: Can we actually automate this process with our current data and systems? What is our real exception rate, and how do we handle it? And critically — how long does adoption actually take?
Teams that treat the pilot purely as a proof of technology miss the opportunity to validate the assumptions that underpin the full business case. The pilot’s documentation — actual cycle times before and after, actual exception rates, actual ramp time, actual FTE hours recaptured — becomes the evidence base for scaling. Treat it accordingly.
Phase 2 — Scaling ROI: Why the Second Wave Is Harder Than the First
If the pilot is the IPA program’s honeymoon, Phase 2 is the marriage — and like most marriages, it requires significantly more work than anticipated. The expansion phase, typically running from months 4 through 9, involves extending from one proof-of-concept process to 5-10 processes across two or three departments. This is where a majority of IPA programs stall permanently.
The Scaling Paradox
Here’s the dynamic that traps most programs: the first pilot was selected specifically because it was automatable — high volume, well-structured, data-ready. When teams try to replicate that success across the next ten processes, they discover that those first-cut candidates were the low-hanging fruit. The next batch of processes is messier, more exception-prone, more politically contested, and more dependent on data quality improvements that take time to implement.
The result is a pipeline that looks full on a project management dashboard but delivers returns much more slowly than the Phase 1 trajectory suggested. Senior stakeholders, who benchmarked expectations on the pilot ROI, become frustrated. Budget reviews arrive before the Phase 2 processes have matured enough to show results. Programs get cut or deprioritized — not because they failed, but because the ROI communication strategy didn’t account for the natural shape of a scaling curve.
Building the CoE to Protect Phase 2 Returns
The single most important structural investment an organization can make between pilot and scale is establishing a Center of Excellence. The CoE’s role is not primarily to build automations — it’s to create the conditions under which automations can be built, maintained, and measured consistently across the enterprise.
A functioning CoE in Phase 2 handles:
- Process intake and prioritization: A standardized scoring system for evaluating new automation candidates so that resources are directed to high-ROI opportunities rather than whoever asked most recently.
- Standards and reusable components: Common libraries, integration patterns, and governance templates that reduce the development time for each successive automation. This is where Phase 2 ROI begins to compound — each new automation is cheaper to build than the last.
- Performance monitoring: Bot performance dashboards that catch degradation before it becomes a business problem. Without this, automated processes silently accumulate errors as upstream systems change.
- Exception management protocols: Clear decision trees for handling the cases that fall outside the automation’s designed parameters. Unmanaged exceptions are one of the primary causes of process failure in scaled deployments.
Phase 2 ROI Benchmarks
Programs that successfully navigate the scaling phase typically achieve the following by the end of month 9:
- 5-10 live automated processes generating measurable returns
- 20-50% reduction in process cycle times across automated workflows
- Cumulative FTE hours recaptured equivalent to 2-4 FTE positions, redeployed to higher-value work
- Error rates reduced by 50-70% on automated process steps (full 90%+ reduction is typically a Phase 3 outcome as exception handling matures)
Phase 3 — Enterprise ROI: Compounding Returns and the Governance That Protects Them
Enterprise-wide IPA deployment — the 9-to-24-month phase — is where the ROI math changes fundamentally. Programs that reach this stage don’t just accumulate additive savings from individual automations. They start generating compounding returns as process interdependencies are automated, data quality improvements feed better AI model performance, and the organization’s operational capacity genuinely expands without proportional headcount growth.
The Compounding Return Mechanism
The difference between a 200% IPA ROI and a 400-650% IPA ROI is almost entirely explained by how well an organization captures compounding returns in Phase 3. These compounding effects come from three sources:
Cross-process data flywheel: As more processes run through the IPA layer, the system accumulates richer operational data. This data improves the accuracy of AI models, reduces exception rates over time, and enables predictive capabilities that weren’t possible when the system was processing only a fraction of the workflow volume. The automation gets smarter — and more valuable — the longer it runs.
Redeployment multiplier: FTE capacity recaptured in Phases 1 and 2 that gets redeployed to revenue-generating or strategic activities creates value that compounds independently of the automation investment. A customer service team that spends 40% less time on routine queries and 40% more time on complex retention conversations generates measurable revenue impact that can be attributed back to the IPA program — if you’ve instrumented the measurement correctly.
Infrastructure cost declining per unit: Once the platform, integrations, and governance infrastructure are in place, the marginal cost of adding each new automation decreases significantly. A new automation that would have cost $150,000 to implement in Phase 1 might cost $30,000-40,000 in Phase 3, dramatically improving the unit economics of the program over time.
Governance as a Financial Control
At enterprise scale, governance is not an administrative formality — it’s a direct financial control mechanism. Programs without robust governance frameworks consistently see their returns erode through three specific mechanisms:
- Bot sprawl: Automations built without standards accumulate technical debt and maintenance costs at rates that eventually consume the savings they generate.
- Uncaptured value: Without attribution frameworks, the business impact of Phase 3 automations becomes impossible to measure, making it impossible to justify ongoing investment or demonstrate program health to the finance committee.
- Regulatory exposure: As automated processes touch regulated activities (financial reporting, patient data, HR decisions), governance failures create compliance risk that can exceed the total value of the program in penalty and remediation costs.
Industry-by-Industry ROI Benchmarks
One of the most common mistakes in building an IPA business case is using generic ROI benchmarks rather than sector-specific evidence. IPA economics vary substantially by industry — driven by regulatory context, process complexity, data infrastructure maturity, and the specific automation use cases most relevant to each sector. Here’s what the 2026 data shows:
Financial Services (BFSI)
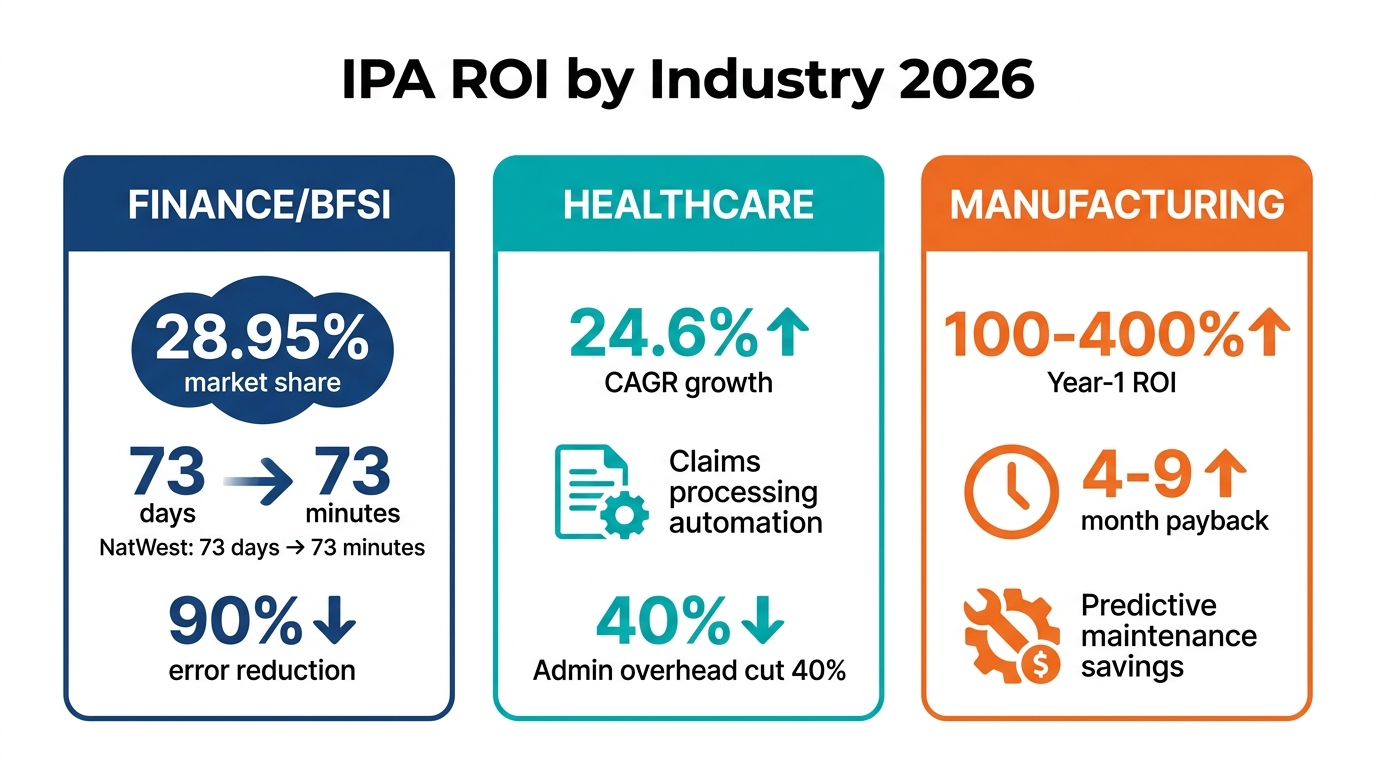
Financial services leads the IPA market, commanding approximately 28.95% of global IPA revenue share. The combination of high transaction volumes, strict regulatory requirements, and significant manual compliance overhead makes BFSI an exceptionally high-ROI environment for intelligent automation.
The most impactful use cases in 2026:
- KYC (Know Your Customer) and onboarding: Document extraction, identity verification, and compliance checks that previously required multiple human reviewers can be automated with AI-enhanced document processing, reducing onboarding time by 60-80% and compliance staff overhead significantly.
- Loan origination and underwriting: Rules-based underwriting enhanced with ML-driven risk scoring reduces manual review requirements and accelerates decision timelines.
- Finance close and reconciliation: IBM Finance documented greater than 90% cycle-time reduction in finance close processes through IPA, with $600,000 in annual savings reported in 2026 benchmarking studies.
- The NatWest benchmark: One of the most cited enterprise IPA case studies shows NatWest reducing project approval lead times from 73 days to 73 minutes through intelligent automation of governance workflows — a reduction of over 99.9%.
For financial services organizations building business cases, realistic Year-1 ROI targets range from 200-380% on well-selected processes, with 3-5 year returns reaching 400-650% in programs that scale effectively.
Healthcare
Healthcare IPA is growing at a 24.6% CAGR projected through 2031, driven by acute administrative burden, reimbursement complexity, and chronic workforce shortages that make automation economically essential rather than optional.
The highest-impact healthcare automation use cases in 2026 include:
- Claims processing and insurance reconciliation: Automated verification of procedure codes, payer rules, and eligibility dramatically reduces denial rates and accelerates revenue cycle performance.
- Prior authorization: One of the most time-intensive administrative bottlenecks in US healthcare, prior auth automation can reduce clinician and administrative staff burden by 40-60% per authorization request.
- Surgical scheduling and OR optimization: AI-enhanced scheduling that accounts for equipment availability, surgeon preferences, case complexity, and patient prep requirements can improve OR utilization by 15-25%.
- Clinical documentation support: Ambient AI documentation tools that automate clinical note generation from patient encounters are showing strong adoption, with providers reporting 1.5-2 hours per day returned to clinician time.
Healthcare IPA ROI is often expressed in terms of cost avoidance rather than direct savings — a framing that resonates with health system CFOs who think in terms of prevented spending rather than revenue generation.
Manufacturing
Manufacturing IPA delivers some of the most dramatic ROI figures in the benchmarking literature, with Year-1 returns of 100-400% reported on well-executed deployments. The high ROI reflects both the large scale of manufacturing operations (where small percentage improvements in process efficiency translate to large absolute savings) and the relatively high baseline cost of manual monitoring, quality control, and supply chain management.
Key manufacturing use cases and their typical payback periods:
- Predictive maintenance: IoT sensor data analyzed by ML models to predict equipment failure before it occurs, with documented payback periods of 4-9 months.
- AI-enhanced quality inspection: Computer vision systems that replace or augment manual visual inspection, with payback periods of 6-12 months.
- Supply chain automation: Purchase order generation, supplier communication, and inventory replenishment automation that reduces procurement overhead and improves on-time delivery performance.
- Cobot and collaborative robot integration: Human-robot collaboration systems on production lines, with payback periods of 8-14 months for well-specified applications.
The Measurement Framework That Makes IPA ROI Defensible
The gap between “automation is working” and “automation ROI is proven” is almost always a measurement problem. Organizations that can defend their IPA returns with precision — at a quarterly business review, an audit, or a board presentation — have invested in a measurement framework from day one, not as an afterthought when the program comes under pressure.
The Four-Layer Measurement Architecture
A robust IPA measurement framework operates across four distinct levels, each feeding the one above it:
Layer 1 — Task Level: The most granular measurement layer captures performance at the individual task or transaction level. Key metrics include minutes saved per task, error rate before and after automation, and task completion rate. This layer provides the raw evidence for productivity claims and is the foundation of the financial model.
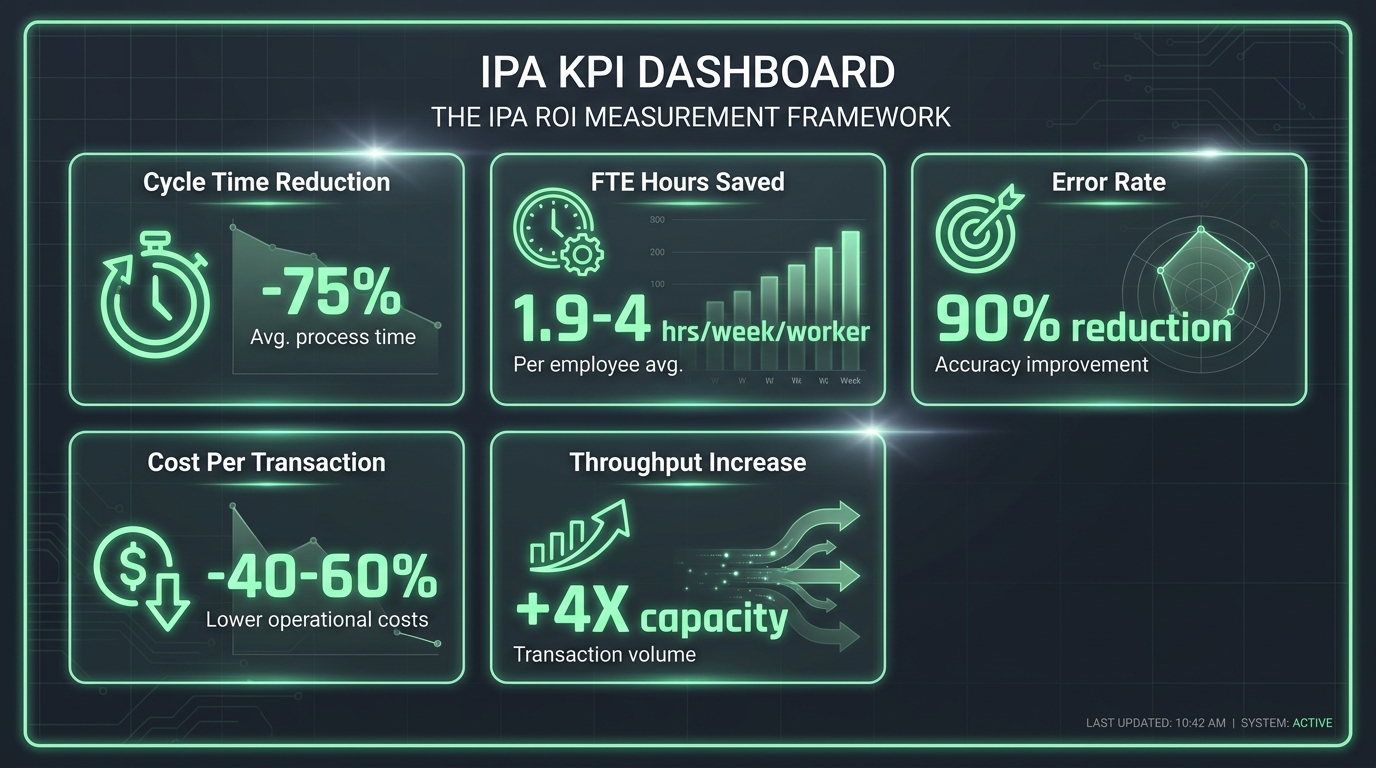
Layer 2 — Worker and Team Level: This layer aggregates task-level savings into workforce-level impact. The most useful metric is hours saved per worker per week — a number that can be validated through time studies or activity-based analysis. The 2026 benchmark range for well-implemented IPA is 1.9 to 4 hours saved per worker per week for Copilot-style AI augmentation, rising significantly for full process automation. This layer is where you bridge from task efficiency to FTE capacity impact.
Layer 3 — Process and Function Level: At this level, measurement shifts to end-to-end process performance: cycle time from initiation to completion, throughput volume, cost per transaction, and containment rate (what percentage of process instances complete without human intervention). Benchmark targets at this level for mature IPA implementations include 75-85% cycle time reduction and containment rates above 84%.
Layer 4 — Financial and Strategic Level: The layer that executives and finance committees consume. This includes total cost savings realized (against the baseline), NPV of the program to date, return on automation investment per process, and contribution to strategic objectives (compliance posture, customer experience scores, revenue metrics). This layer requires clean attribution — you need to be able to draw a defensible line from the Layer 1 task metrics to the Layer 4 financial outcomes.
Setting Baselines Before You Automate
One of the most common measurement failures in IPA programs is neglecting to establish robust baselines before automation goes live. Without a credible pre-automation baseline for each key metric, every post-automation number is contestable. Did cycle time really improve, or did the volume of work change? Did error rates fall because of the automation, or because a process change happened simultaneously?
Baselines should be collected for a minimum of 4-6 weeks pre-automation, covering actual transaction volumes, actual processing times (not standard times — actual times, pulled from system logs), error rates, and FTE hours consumed. This baseline becomes the denominator in every ROI calculation you’ll make for the life of the program.
The 5 Hidden Cost Traps That Inflate Your TCO
Even teams that build thorough cost models encounter surprises. These five traps appear with enough consistency across enterprise IPA programs that they deserve explicit attention in any business case development process:
Trap 1: The Data Remediation Underestimate
Poor data quality is the single most frequently cited obstacle in automation failures — appearing in 85% of cases per Gartner analysis. Most teams acknowledge data quality as a risk; far fewer actually cost out the remediation required to bring data to a state where AI models can rely on it. Data cleansing, deduplication, schema standardization, and governance framework implementation can consume 15-25% of the total program budget in organizations with significant legacy system complexity. Budget for it explicitly, or it will consume funds allocated to other activities.
Trap 2: The Integration Tax
Modern enterprises run an average of 175-200 software applications. IPA systems don’t exist in isolation — they need to read from and write to these existing systems, and the integrations are rarely as straightforward as vendor demonstrations suggest. Legacy systems that predate modern API standards require custom connectors. Security reviews add time and cost. Middleware that was never designed for automation traffic creates bottlenecks. The integration tax typically adds 20-30% to implementation timelines and a corresponding cost overrun.
Trap 3: Model Drift and the Retraining Cycle
AI models within IPA systems are not static. Business processes evolve — forms change, exception patterns shift, regulatory requirements update — and the models that power intelligent automation need continuous monitoring and periodic retraining to maintain their performance. This is not a one-time cost; it’s an ongoing operational expense that most initial budgets completely omit. A rough planning benchmark: allocate 15-20% of the initial model development cost as an annual retraining and monitoring budget.
Trap 4: The Scaling Cost Surge
Infrastructure costs — particularly cloud compute — scale non-linearly in many IPA architectures. A system handling 10,000 transactions per day doesn’t cost 10 times as much as one handling 1,000 — it often costs 15-20 times as much, because parallel processing requirements, redundancy needs, and peak load management create step-change cost increases. Teams that plan infrastructure costs based on pilot-phase consumption are frequently shocked by the numbers when they hit scale.
Trap 5: The CoE Underinvestment Cycle
Centers of Excellence are frequently funded as projects rather than as permanent operational capabilities. When budget pressure arrives (and it will), CoE headcount is reduced — and the programs that depend on the CoE for prioritization, governance, and bot maintenance begin to degrade. This is a false economy. Every dollar cut from CoE investment in a mature program typically generates $3-5 in increased maintenance costs, missed opportunities, and performance degradation within 12-18 months.
Change Management as an ROI Variable — Not an Afterthought
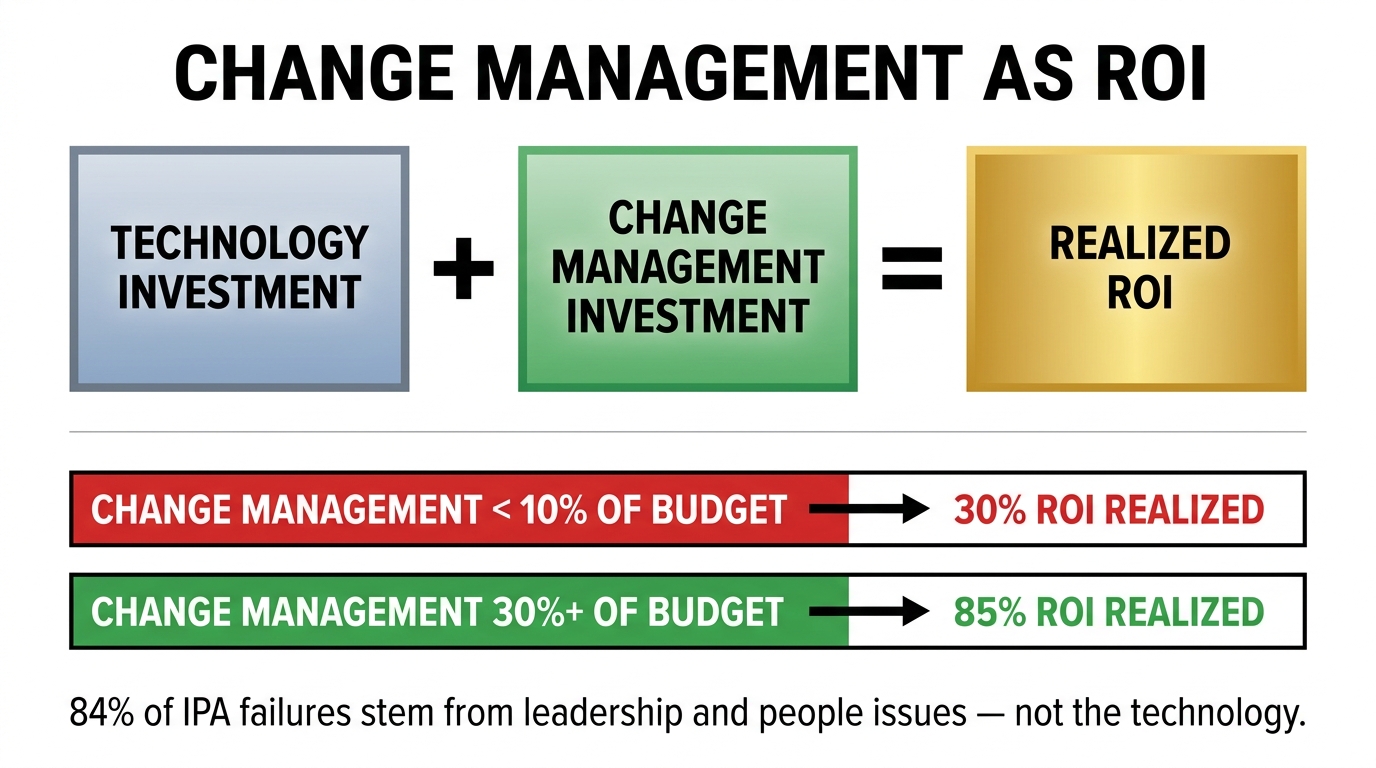
The research on IPA failure is unambiguous on one point: 84% of automation failures stem from leadership and organizational issues — not technology. Misaligned stakeholders, insufficient executive sponsorship, inadequate training, and workforce resistance are collectively responsible for more unrealized ROI than any technical limitation of the automation platforms themselves.
Despite this, change management remains one of the most chronically underfunded elements of IPA programs. The average enterprise automation budget allocates less than 10% to change management activities. Programs that actually realize their projected ROI typically allocate 25-30% or more.
The Economic Case for Change Management Investment
The connection between change management investment and ROI realization is not soft or anecdotal — it can be modeled and measured. Consider the mechanism:
An IPA system that processes invoices 70% faster than the manual process only delivers that 70% improvement if the humans in the adjacent workflow actually use the outputs of the automated process at the pace the system makes possible. If the team receiving automated outputs still follows their old review cadence — checking everything manually, waiting for end-of-day batch reviews — the cycle time improvement exists in the automation layer but doesn’t flow through to the business outcome.
Process adoption is not automatic. People in established workflows have developed habits, informal quality checks, and workarounds that exist for reasons — sometimes good ones. Change management’s job is to understand those reasons, address the legitimate concerns, and build new workflows that capture the value the automation creates.
The Three Change Management Levers That Drive ROI
Executive sponsorship with teeth: Programs with genuine executive sponsorship — where a senior leader is accountable for the program’s business outcomes and visibly engaged — consistently outperform programs where sponsorship is nominal. The difference isn’t just cultural. Executive sponsors unblock resource allocation decisions, resolve cross-functional conflicts, and signal to middle management that adoption is expected, not optional. Research indicates that executive sponsorship evaporates within six months in 56% of failed IPA programs.
Role-level impact communication: Generic change communications (“we’re automating some processes to improve efficiency”) generate anxiety without context. High-performing programs communicate specifically to each affected role: what will change in your day-to-day work, what will stay the same, what is the organization doing with the time you recapture, and how does this affect your role security. This specificity reduces resistance and accelerates adoption.
Workflow redesign, not just automation: The most sophisticated change management programs don’t just train people on how to work with a new automated system. They redesign the surrounding workflow so that the way humans interact with the automated process is optimized for the new pace and output format the automation enables. This is the difference between an automation that technically works and one that delivers its projected ROI.
Building Your IPA ROI Dashboard — KPIs That Actually Matter
Every IPA program accumulates data. The programs that sustain board-level support over the long term are the ones that have synthesized that data into a clear, consistent dashboard that tells a coherent story about program health and financial performance. Here is the KPI structure that most reliably translates program activity into executive-level confidence:
Financial Health KPIs
- Cumulative ROI (%) against business case projection: Are you ahead or behind? By how much? What’s the revised forecast?
- Cost per transaction (automated vs. manual): The most powerful single metric for demonstrating IPA economics. If your automated invoice processing costs $0.45 per transaction versus $8.50 manually, that story tells itself.
- Annual run-rate savings: The annualized financial benefit of all live automations, updated monthly. This is the number that gets cited in board presentations.
- Payback period tracking (actual vs. planned): Are individual processes paying back on schedule? Early warning system for underperforming automations.
Operational Performance KPIs
- Process cycle time (before vs. after): The most intuitive measure of automation impact. Benchmark targets range from 20% improvement on complex processes to over 90% on highly automatable ones.
- Automation rate: What percentage of transactions complete without human intervention? This metric directly drives the financial model. Every percentage point increase in automation rate translates to measurable labor cost savings.
- Error rate and exception volume: Automation that reduces error rates by 90% is operating well. Automation that has been running for 12 months and still has a 30% exception rate has a process design problem that needs investigation.
- Bot uptime and availability: Automated processes that aren’t running aren’t saving anything. System reliability is a financial KPI, not just a technical one.
Strategic and Workforce KPIs
- FTE hours recaptured and redeployed: How many hours of human attention have been returned to higher-value work? How has that time been deployed? This metric closes the loop on the workforce narrative that was central to the original business case.
- Automation pipeline value: The projected annual savings of processes in the development and approval queue. This forward-looking metric demonstrates program momentum and justifies continued CoE investment.
- Employee experience scores in automated teams: If the teams working alongside automation are reporting higher engagement and lower routine-task burden, it’s a leading indicator of sustainable adoption. If scores are declining, it’s an early warning of resistance that will eventually affect ROI.
Reporting Cadence That Keeps Stakeholders Engaged
A practical dashboard cadence for enterprise IPA programs: monthly operational metrics reviewed by the CoE and process owners; quarterly financial performance reviewed by program sponsors and finance; annual strategic review at board or executive committee level that includes program NPV, pipeline assessment, and a forward-looking investment case for the next phase.
The consistency of reporting matters as much as the content. Programs that produce reliable, predictable updates build the institutional trust that sustains long-term investment. Programs that only report when things are going well — and go quiet when they’re not — generate the suspicion that erodes executive support at exactly the moment the program needs it most.
From Business Case to Board-Level Proof: Putting the Roadmap Together
The organizations that capture the full value of Intelligent Process Automation — the ones achieving 400-650% five-year ROI while others struggle to move beyond pilot — are not running fundamentally different technology. They are running fundamentally different programs. The distinction lives in how they structure the financial case, what they include in their cost models, how they select and sequence processes, how they invest in governance and change management, and how they measure and communicate results over time.
Here is the distilled roadmap, built from everything covered in this piece:
Before you start: Build a CFO-ready financial model using NPV, IRR, and payback period over a 3-5 year horizon. Include three scenarios. Map the full TCO including all Tier 1, 2, and 3 costs and add a 30% contingency on the visible stack. Establish the business case benefit split (40-50% labor savings, 15-25% error reduction, 10-20% cycle time, 20-35% scalability).
Phase 1 (0-6 months): Select one pilot process using the four-factor scorecard. Establish baselines for all key metrics before go-live. Target payback in under six months. Document everything — actual performance data, not projected. Treat the pilot as evidence generation for the Phase 2 funding conversation.
Phase 2 (4-9 months): Establish the CoE before scaling begins, not after. Build the intake and prioritization process. Set realistic expectations with stakeholders about the shape of the scaling ROI curve — it will plateau temporarily before accelerating. Invest in change management at the 25-30% budget level, not the 10% level.
Phase 3 (9-24 months): Activate the compounding return mechanisms — cross-process data quality improvements, infrastructure unit economics, and FTE redeployment tracking. Maintain governance rigor. Report financial performance quarterly against the original business case. Build the forward-looking pipeline case to justify sustained investment.
Ongoing: Monitor model drift. Fund the CoE as an operational capability, not a project. Keep the measurement framework clean — the integrity of your data is the integrity of your ROI story. When the program delivers, document it in the format that the finance committee uses to make investment decisions — because the best evidence you have for the next phase of IPA investment is the defensible, auditable proof that this one worked.
The gap between IPA programs that deliver and those that don’t is not a technology gap. It has never been a technology gap. It is a planning, measurement, and organizational discipline gap — one that this roadmap is built to close.