


There is a particular kind of confusion that catches Amazon sellers off guard — usually around month six or month twelve. Revenue is climbing. The Seller Central dashboard shows green numbers. Orders are coming in steadily. And yet, somehow, the bank account never quite reflects what the business should be generating.
It is one of the most common and least-discussed problems in Amazon selling: the gap between accounting profit and actual cash. Sellers watch their top-line revenue grow and assume the business is healthy. Meanwhile, fees accumulate in layers they never fully mapped, inventory capital sits locked in Amazon warehouses, advertising spend creeps upward without clear attribution, and payout cycles create a structural lag between earning and receiving.
This is not a beginner’s problem. Sellers doing $500,000 a year run into this. Sellers doing $2 million a year run into this. It is a structural issue baked into how Amazon’s marketplace operates — and the sellers who escape it are not necessarily smarter or more experienced. They just decided to treat unit economics as seriously as they treat product research.
This post unpacks the full cost structure of selling on Amazon in 2026: every fee layer, every cash timing trap, every margin leak that does not show up obviously on a simple P&L. It is not a light read. But if you sell on Amazon — or are thinking about it — understanding this math is more important than any listing hack or ranking trick.
The Fee Stack Nobody Totals Up Front
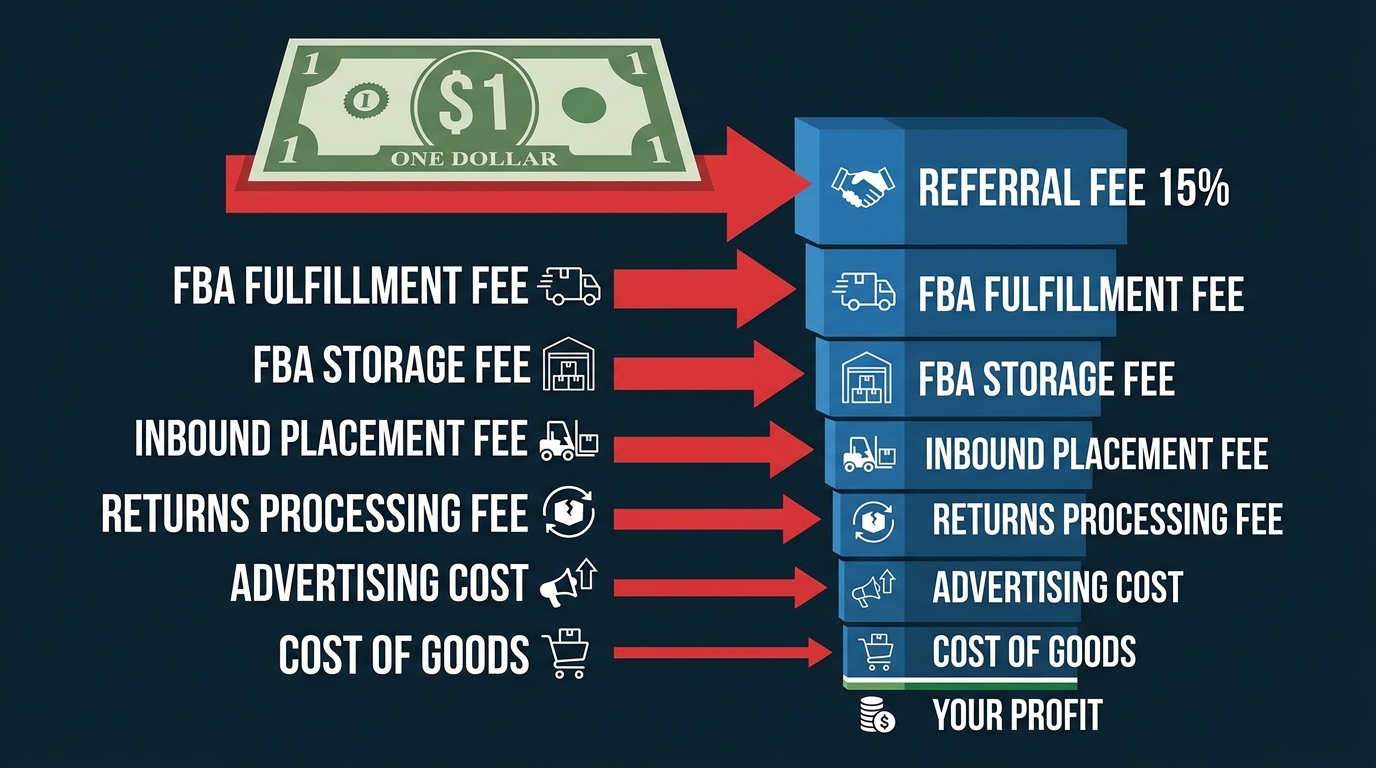
Most sellers know Amazon charges fees. Few sellers have sat down and added every single one up against a real product at a real price point. When you do, the result is often jarring.
Amazon’s fee structure is not designed to be opaque — but it is layered in a way that makes the total easy to underestimate, especially when you are evaluating a product before launch and relying on back-of-napkin math.
Referral Fees: The Entry-Level Deduction
Every sale on Amazon starts with a referral fee — a percentage of the total sale price paid to Amazon for marketplace access. The standard rate across most categories sits at 15%, though it ranges from 8% (consumer electronics) to 17% (clothing and accessories) depending on the category you sell in.
Sellers often remember to account for this. What they undercount is what the percentage applies to: it is taken on the full retail price including any gift wrap or mandatory fees passed to the customer, not just the “product” portion. If you sell a $39.99 item in a 15% referral category, that is $6.00 out of every sale before anything else is deducted.
FBA Fulfillment Fees: The Weightier Hit
Fulfillment by Amazon charges a per-unit fee that covers picking, packing, and shipping each order. These fees are tiered by size and weight. A small standard-size item weighing under 4 oz typically incurs an FBA fee around $3.06–$3.30. A large standard-size item in the 3–20 oz range runs $4.75–$5.40. Anything heavier or larger climbs steeply from there.
The trap sellers fall into is calculating FBA fees based on their product’s base weight — not its dimensional weight, and not accounting for the packaging they actually use. Amazon measures the greater of actual weight and dimensional weight (length × width × height ÷ 139). A lightweight product with bulky packaging gets hit with dimensional weight fees that can significantly exceed what the seller anticipated.
In 2026, Amazon also applies an inbound placement fee — a charge that applies when Amazon splits your inventory shipment across multiple fulfillment centers. Sellers who previously benefited from sending to a single destination now see this fee added to inbound shipping costs, ranging from $0.21 to $0.42 per unit for most standard items, and more for large or heavy goods.
Monthly Storage Fees: The Cost of Holding
Amazon charges a monthly per-cubic-foot storage fee for inventory sitting in its fulfillment centers. Standard-size rates run approximately $0.78 per cubic foot for most of the year, rising to $2.40 per cubic foot during the peak October–December period. Oversized items carry lower per-cubic-foot rates but generate larger absolute charges due to their volume.
These numbers seem manageable in isolation. They become painful when multiplied by slow-turning inventory. A seller holding 500 units of a product with a 90-day sell-through rate is paying storage for roughly half that inventory at any given time. Add peak-season surcharges, and a single SKU that is moving slowly can generate hundreds of dollars in monthly storage charges before the seller has processed that as a line-item cost.
Aged Inventory Surcharges and Long-Term Storage
Amazon applies an aged inventory surcharge to units that have been in a fulfillment center for more than 181 days. At 181–270 days, the surcharge runs $0.50 per cubic foot (applied monthly on top of the regular fee). At 271–365 days, it rises to $1.50 per cubic foot. Units beyond 365 days face a $6.90 per cubic foot charge — effectively a forcing function designed to make holding dead inventory financially untenable.
The problem is that sellers who do not actively monitor age-of-inventory reports often do not notice these surcharges building up until they have already accumulated. By the time the damage shows on the account, the total can be significant.
Other Fees in the Stack
Beyond these major categories, the complete fee stack also includes returns processing fees (charged when Amazon processes customer returns in certain categories), closing fees (a flat fee applied per sale in media categories), high-volume listing fees for accounts exceeding 1.5 million active SKUs, and minimum referral fees in categories where the percentage-based fee would otherwise be negligibly low.
When a seller adds up referral fees (15%), FBA fulfillment fees ($3.50–$6.00 for a typical product), storage (variable), inbound placement fees, and any returns-related costs, it is not unusual for the total fee burden to represent 35–45% of the retail price — before accounting for the cost of goods, advertising, or any overhead.
The practical implication: A product selling at $24.99 in a 15% referral category, with a standard-size FBA fee of $4.75 and reasonable storage allocation, is already paying $8.50+ to Amazon per unit. That leaves $16.49 maximum to cover cost of goods, advertising, and profit. At a typical cost of goods ratio of 25–30%, that is $6.25–$7.50 for the product itself — leaving a margin of $8–9 before PPC. At industry-average advertising spend, that margin often halves.
The Real Cost of a Stockout (Beyond Lost Sales)
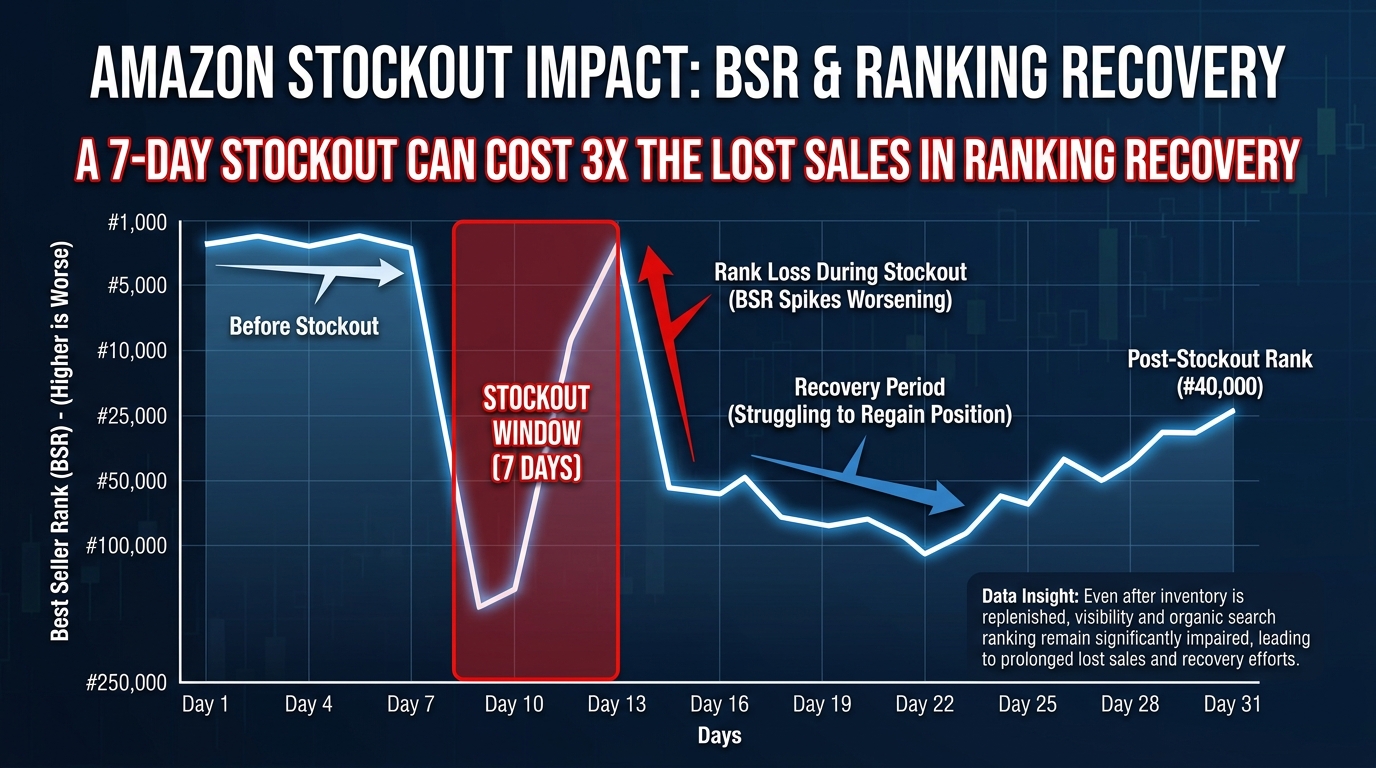
Running out of stock is the event every Amazon seller dreads — and for good reason. The immediate, visible cost is obvious: you cannot sell units you do not have. But the full cost of a stockout extends well beyond the revenue missed during the out-of-stock window, and most sellers significantly underestimate it.
Ranking Loss Is Not Temporary — It Compounds
Amazon’s algorithm assigns your product a position in search results based on a combination of sales velocity, conversion history, relevance signals, and more. When you go out of stock, your sales velocity drops to zero. Your rank deteriorates — and it does not deteriorate gently. A product that has been climbing steadily in BSR (Best Seller Rank) can fall thousands of positions within days of going out of stock.
The deeper problem is that ranking recovery is not linear. It takes time for sales velocity to rebuild after restocking, and that rebuild period effectively requires you to re-earn your position. During that window, you are often running higher advertising spend to compensate for lost organic visibility — spending more ad dollars to generate the same sales you were generating organically before the stockout. The result is a period of compressed margins just when you most need cash flow to replenish inventory.
Studies of Amazon BSR behavior suggest that a seven-day stockout can require three to four weeks of normal sales velocity to fully recover ranking position, depending on category competitiveness and listing history. In competitive categories, that recovery window can be longer — and during it, competitors capture market share they do not always give back.
Review Velocity and Social Proof Disruption
A less-discussed consequence of stockouts is the interruption of review accumulation. Reviews arrive at a rate proportional to sales volume. Every day your listing is out of stock is a day when no new reviews are being generated. In categories where review count meaningfully influences conversion rate, a stockout creates a compounding disadvantage: fewer reviews relative to competitors who kept selling, which leads to lower conversion rates once restocked, which slows the ranking recovery further.
Sponsored Ads Campaign Disruption
Sellers who run Sponsored Products campaigns face an additional complication. When a listing goes out of stock, Amazon typically pauses or suppresses the ASIN from ad auctions. When inventory is restored and campaigns reactivate, the campaign’s learning history — bid data, placement performance, keyword quality signals — has effectively been frozen or partially reset. Restarting campaigns in a competitive market often means re-entering bid auctions at a disadvantage, with potentially higher CPCs until the algorithm re-learns performance patterns.
Calculating the True Stockout Cost
A more complete stockout cost model would include: direct lost revenue during the out-of-stock period; the extra PPC spend required during the ranking recovery window; the opportunity cost of competitor market share captured and not returned; and the reset of advertising campaign efficiency. For a product doing $30,000/month in revenue, a seven-day stockout might appear to cost $7,000 in direct lost sales — but when recovery costs, ranking degradation, and advertising inefficiency are added, the true cost can easily be two to three times that figure.
The Inventory Planning Paradox
The challenge is that solving for stockouts requires holding more inventory — which increases storage costs, ties up working capital, and creates risk if demand shifts. The optimal inventory position is not “as much as possible” or “as little as possible.” It is a precise calculation based on lead time from supplier, sales velocity, sales velocity variance (seasonality and trend), and reorder points. Sellers who manage this with spreadsheet guesswork or gut feel consistently overshoot in some SKUs and undershoot in others — paying storage fees on one while suffering stockouts on the other simultaneously.
How Pricing Decisions Silently Kill Margins
Pricing on Amazon feels like a real-time competitive activity — and in many ways it is. Automated repricers, Buy Box algorithms, and aggressive competitors create pressure to price reactively. The problem is that reactive pricing, without a clear margin floor, is one of the most reliable ways to erode profitability without realizing it until the damage is done.
The Buy Box Pressure Trap
For sellers competing for the Buy Box — particularly resellers or brands that allow multiple sellers on their listings — price is a primary factor in Buy Box eligibility. The temptation to drop price by $0.50 or $1.00 to recapture the Buy Box is almost constant. Each individual price cut seems trivial. The cumulative effect over weeks and months is not.
Consider a product that launched at $29.99 with a 28% net margin. Competitive pressure pushes the price to $27.99. Then $26.49. Then $24.99. Each step seems survivable — but at $24.99, the referral fee decreases by a smaller absolute amount than the revenue did, FBA fees are fixed, and cost of goods does not change. The margin that was 28% is now 11%. The product is still selling. But it has quietly ceased to be worth selling.
Price Anchoring and Perceived Value Destruction
Beyond the fee math, price cuts carry a second cost that is harder to recover from: perceived value erosion. Amazon shoppers use price as a quality signal, particularly in categories where products are hard to differentiate on spec alone. A product that has been consistently available at $29.99 and then drops to $19.99 raises questions in the buyer’s mind that the listing itself cannot always answer. Conversion rates sometimes fall even as price falls — the opposite of what the seller expected.
This effect is especially pronounced for private label brands trying to establish category authority. Competing on price against well-reviewed incumbents rarely works the way new sellers hope. The incumbent has more reviews, more search history, and lower effective advertising costs per sale. Matching their price means matching their margin on lower volume — a losing combination.
The Coupon Cost That Gets Overlooked
Amazon’s coupon feature is widely used as a conversion tool — and it works. Products with active coupons typically see higher click-through rates from search results and improved conversion rates on the detail page. What sellers sometimes fail to fully account for is that Amazon charges a $0.60 fee per coupon redemption, added on top of the discount itself.
A seller running a 10% coupon on a $24.99 product is offering a $2.50 discount plus paying $0.60, for a total per-unit cost of $3.10 per redeemed coupon. If that coupon is running continuously and generating 200 redemptions per month, that is $620/month in coupon costs — an expense that often sits buried in “promotional costs” on the account and never gets properly analyzed against the incremental sales it drives.
Setting Minimum Price Floors — The Right Way
Sustainable pricing strategy on Amazon starts with a clearly calculated margin floor — the lowest price at which a product is worth selling given all costs. This floor should factor in: cost of goods at current supplier terms; all FBA and referral fees at that price point; average advertising spend per unit (a fixed cost allocation based on campaign performance); a storage cost allocation based on expected sell-through rate; and a minimum target margin percentage that the business requires to fund its operations and growth.
Sellers who have set this floor properly can confidently configure their repricers with a hard minimum and let competitive pricing happen above that line. Sellers who have not done this calculation are pricing their products based on what feels competitive — and often discovering months later that every unit they sold at “competitive” prices was sold at a margin that did not cover all their real costs.
The Working Capital Trap: Why Fast-Growing Sellers Run Out of Cash
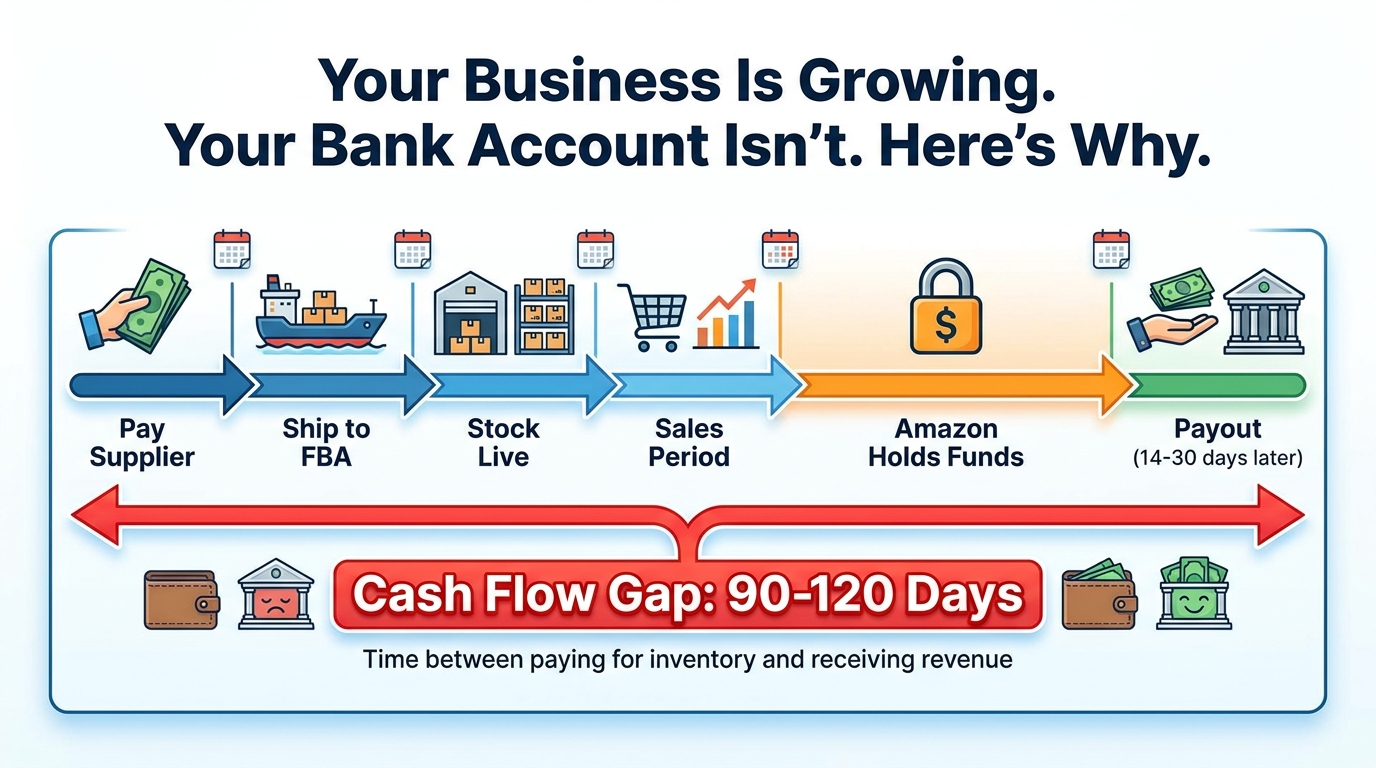
Growth on Amazon has a dirty secret: it consumes cash faster than it generates it. The faster you grow, the more cash you need — and the structure of Amazon’s payment and inventory cycle means that cash is almost always delayed relative to the capital you have deployed.
The 90-Day Cash Cycle Problem
Walk through the full cash cycle for a typical Amazon FBA seller. You place an order with your supplier, who typically requires a 30% deposit upfront and the remaining 70% before or upon shipment. For many overseas suppliers, production and lead time add 30–45 days from order to goods being ready to ship. Ocean freight from Asia to a U.S. port adds another 25–35 days. Customs clearance, domestic trucking, and FBA receiving can add 7–14 more days. From the moment you committed capital to the purchase order, it is now 75–95 days before your inventory is live and generating sales.
Amazon then holds your funds for a standard 14-day disbursement cycle, with an additional reserve maintained based on account age and sales history. For newer accounts, Amazon may hold funds for up to 30 days as a reserve. Add the time from first sale to last sale in a given sell-through period, and the gap between when you paid the supplier and when you received the revenue can span 90–120 days or more.
How Growth Amplifies the Gap
Here is where the trap closes. If your business is growing at 30% quarter over quarter, every inventory purchase is 30% larger than the last one. But the cash from the previous order may not have fully cleared before you need to commit capital to the next one. You are perpetually deploying more capital than you are recovering — not because the business is unprofitable, but because the cash cycle is out of phase with the growth cycle.
This is why a seller can be doing $1 million in annual revenue, showing a healthy margin on paper, and genuinely struggle to make payroll or fund the next purchase order without a line of credit. The business is profitable. The cash flow statement tells a different story.
Amazon’s Seller-Wallet and Payout Mechanics
Amazon maintains a “settlement” account where your earnings accumulate. Every two weeks, Amazon transfers the available balance to your linked bank account — but the available balance excludes amounts held in reserve, active A-to-Z guarantee claims, chargeback claims, and any active account health issues. Sellers with a history of A-to-Z claims or high refund rates may find a larger portion of their balance held in reserve, further compressing usable cash.
The reserve system exists to protect buyers — it is a legitimate feature of how Amazon operates. But it means that sellers cannot treat their Seller Central account balance as accessible working capital. The gap between what the dashboard shows and what the bank receives is often meaningfully larger than sellers expect.
Managing the Cash Gap: Practical Approaches
Sellers who navigate the working capital trap successfully typically use one or more of the following approaches. Amazon Lending provides term loans and lines of credit to eligible sellers based on account history and sales data — convenient because it does not require traditional bank underwriting, but rates vary and sellers should compare carefully. Revenue-based financing from third-party providers like Clearco, Wayflyer, or SellersFunding offers advances against future sales, often with faster approval timelines. Some sellers negotiate extended payment terms with suppliers — 60-day or 90-day net terms, or letters of credit — effectively shifting the cash timing burden back toward the supply chain. And disciplined sellers maintain a working capital reserve specifically sized to cover 90 days of inventory purchasing regardless of current account balance.
None of these solutions are free. Interest costs, factoring fees, and financing charges are all real costs that need to be factored into the unit economics — yet they rarely appear in standard P&L summaries.
Return Rates, Refunds, and the Hidden Drain on Your P&L
Returns are a cost of doing business on any e-commerce platform. On Amazon, however, the return policy — and the economics of processing those returns — creates a specific type of margin erosion that many sellers do not track with sufficient granularity.
Amazon’s Return Policy and Your Exposure
Amazon’s customer-first return policy allows buyers to return most items within 30 days for any reason — and in many categories, Amazon has extended this to 90 days for certain products. The seller bears the cost of this policy in multiple ways. First, the refund itself: depending on the return category and reason, Amazon may or may not charge the buyer a restocking fee. In most cases, the full purchase price is refunded to the customer, and the amount is clawed back from the seller’s account.
Second, the returned unit: when a customer returns a product, Amazon assesses its condition and either returns it to your sellable inventory, classifies it as unfulfillable (damaged or used), or — for certain programs — handles liquidation. Units returned in unsellable condition represent a complete loss of the unit’s cost of goods plus the original FBA fulfillment fee. In some categories (particularly electronics, clothing, and personal care), a meaningful percentage of returns arrive in conditions that prevent resale.
Returns Processing Fees
In 2024, Amazon introduced returns processing fees in categories with persistently high return rates, including apparel, footwear, and jewelry. These fees apply when a product’s return rate exceeds the category benchmark — an additional per-unit charge levied by Amazon to offset its handling costs. Sellers in affected categories now have a structural incentive to reduce return rates that goes beyond the lost revenue: the per-unit fee on returns compounds the effective cost of each return.
A seller in an apparel category with a 20% return rate on 1,000 monthly units is processing 200 returns per month. If each return results in a full refund ($34.99), a returns processing fee ($1.78), and a lost unit at cost ($8.00), the monthly return-related cost is approximately $8,954 — before accounting for any reprocessing, liquidation, or disposal costs on unsellable units.
Tracking Returns at the SKU Level
The critical practice that separates sellers who control their return-related losses from those who absorb them passively is SKU-level return tracking. Amazon’s seller analytics provides data on return rates by ASIN, including return reason codes submitted by buyers. Most sellers glance at this data occasionally. The disciplined ones run it monthly against each SKU, flag any ASIN with a return rate that deviates from category norms, and investigate the reason codes for patterns.
A product with a 15% return rate and “product not as described” as the leading reason code is telling you something specific about the listing — images or copy is setting expectations the product cannot meet. A product with a 12% return rate and “defective item” as the dominant reason code is a manufacturing or quality control problem. These are completely different root causes with completely different solutions, and you cannot distinguish between them without reviewing the data.
The Liquidation and Disposal Math
When unsellable returned inventory accumulates in an FBA warehouse, sellers face a choice: submit a removal order (pay Amazon to ship the units back to you, typically $0.97–$1.89 per unit), request disposal (Amazon destroys the units for a fee of $0.30–$0.97 per unit), or enroll in Amazon’s automated liquidation program (receive approximately 5–10% of the average selling price, minus fees). None of these outcomes recover the full cost of the goods. For sellers tracking true profitability, the expected liquidation or disposal value of returned units needs to be baked into the cost model as a periodic expected expense.
Advertising Spend: Where Sellers Overpay Without Knowing
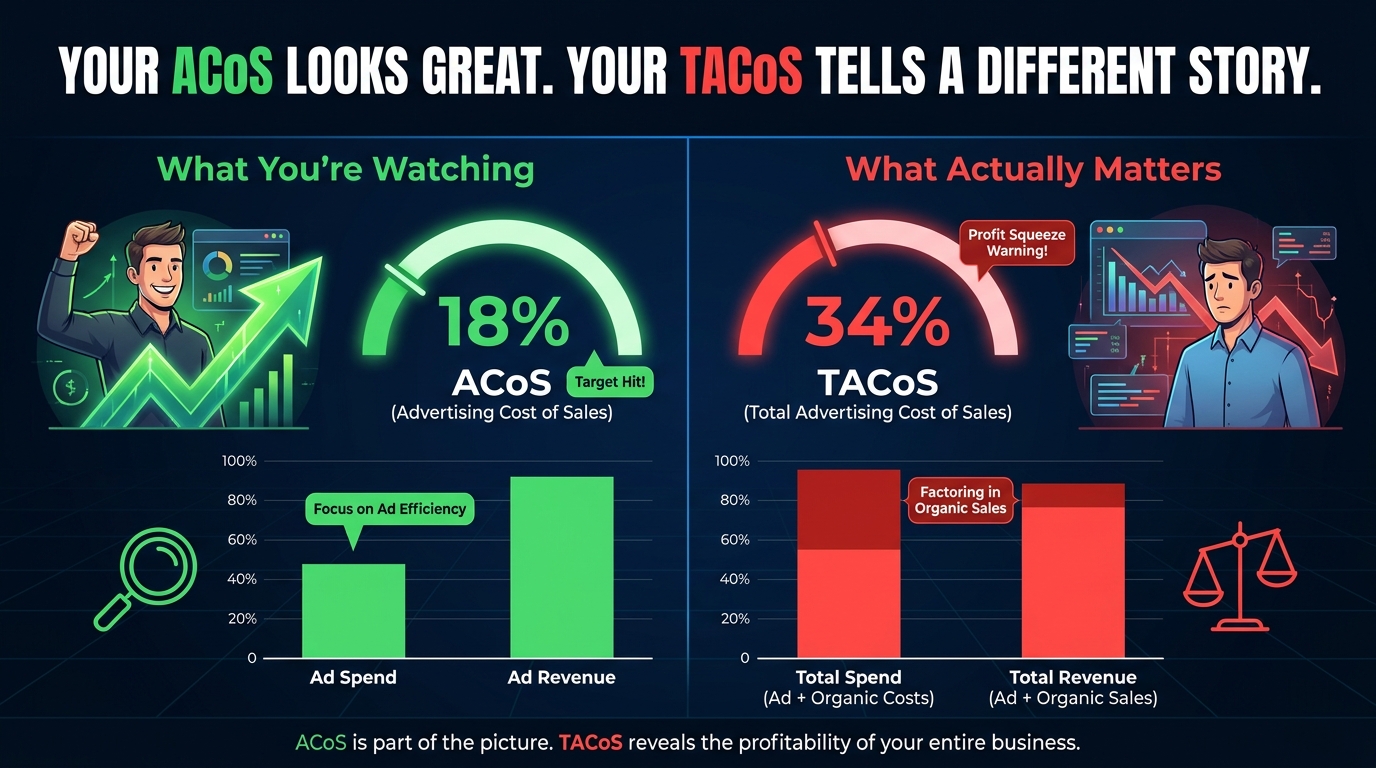
Amazon advertising has become a mandatory cost of doing business for the vast majority of sellers. The platform’s organic visibility has steadily contracted as sponsored placements have expanded — in many categories, the top four or five results on a search page are paid placements before a single organic result appears. If you are not advertising, you are not visible to a substantial portion of potential buyers.
The problem is not that sellers advertise. The problem is the metrics they use to evaluate whether advertising is working — and the decisions those metrics drive.
The ACoS Illusion
Advertising Cost of Sales (ACoS) is the default metric most Amazon sellers use to evaluate PPC performance. It expresses ad spend as a percentage of ad-attributed revenue. A campaign with $500 in spend that drove $2,500 in attributed sales has an ACoS of 20%. This seems straightforward.
The problem is that ACoS is calculated only on ad-attributed sales — meaning sales that Amazon’s attribution model credits to a specific ad click. It does not account for organic sales. A seller might have an ACoS of 18% that looks efficient, while their Total Advertising Cost of Sales (TACoS) — ad spend divided by total revenue, including organic — is 32%. That 32% tells a meaningfully different story about the role advertising is playing in the business.
If advertising is driving both directly attributed sales and substantial organic ranking lift that generates organic sales, a relatively high ACoS can be acceptable — the organic sales it enables make the total picture profitable. If advertising is driving attributed sales but not improving organic velocity (no improvement in BSR, no growth in organic keyword positions), then a high ACoS is simply expensive demand generation with no compounding benefit. These two scenarios require completely different strategic responses, but ACoS alone cannot distinguish between them.
Keyword Overlap and Budget Waste
One of the most persistent sources of wasted advertising spend is keyword overlap across campaigns. A seller with multiple active campaigns — broad match, phrase match, exact match, auto campaigns — will often find that the same search term is triggering ads in multiple campaigns simultaneously. The result is that the seller is bidding against themselves in Amazon’s ad auction, paying different CPCs for the same keyword depending on which campaign won the impression, with no consolidated view of the true total spend on that term.
Regular search term report analysis — pulling the actual search terms customers used to trigger ads across all campaigns, and cross-referencing duplicate coverage — is one of the highest-ROI audit activities an Amazon seller can do. In sellers with complex campaign structures, reducing keyword overlap commonly frees up 15–25% of advertising budget that was previously generating redundant or cannibalistic impressions.
Bid Strategy Misalignment at the Campaign Level
Amazon’s campaign manager offers multiple automated bid strategies: dynamic bids down only, dynamic bids up and down, and fixed bids. Many sellers set campaigns to dynamic bids up and down — allowing Amazon to increase bids by up to 100% when it determines a click is likely to convert. This can improve conversion-weighted performance, but it also means actual average CPCs can be substantially higher than the default bid, with the additional spend often visible only in post-campaign reporting rather than during the campaign itself.
Sellers who set target bids assuming standard CPCs and then enable dynamic up-down bidding often discover their actual spend per click was significantly above budget assumptions — a discrepancy that only becomes apparent when the monthly ad report is reconciled against Seller Central payouts.
Attribution Windows and the 7-Day Default
Amazon’s default attribution window for Sponsored Products is 7 days — meaning a sale is credited to an ad click only if the purchase happens within 7 days of the click. This is relatively tight. For products with longer consideration cycles (higher-priced items, complex purchases, or anything where shoppers typically research across multiple sessions), the 7-day window may systematically undercount ad-influenced sales. Sellers relying on ACoS data from the default window may be undervaluing campaigns that are actually driving purchase decisions — and cutting spend that is working.
The Product Mix Problem: Why SKU Count Is a Margin Killer
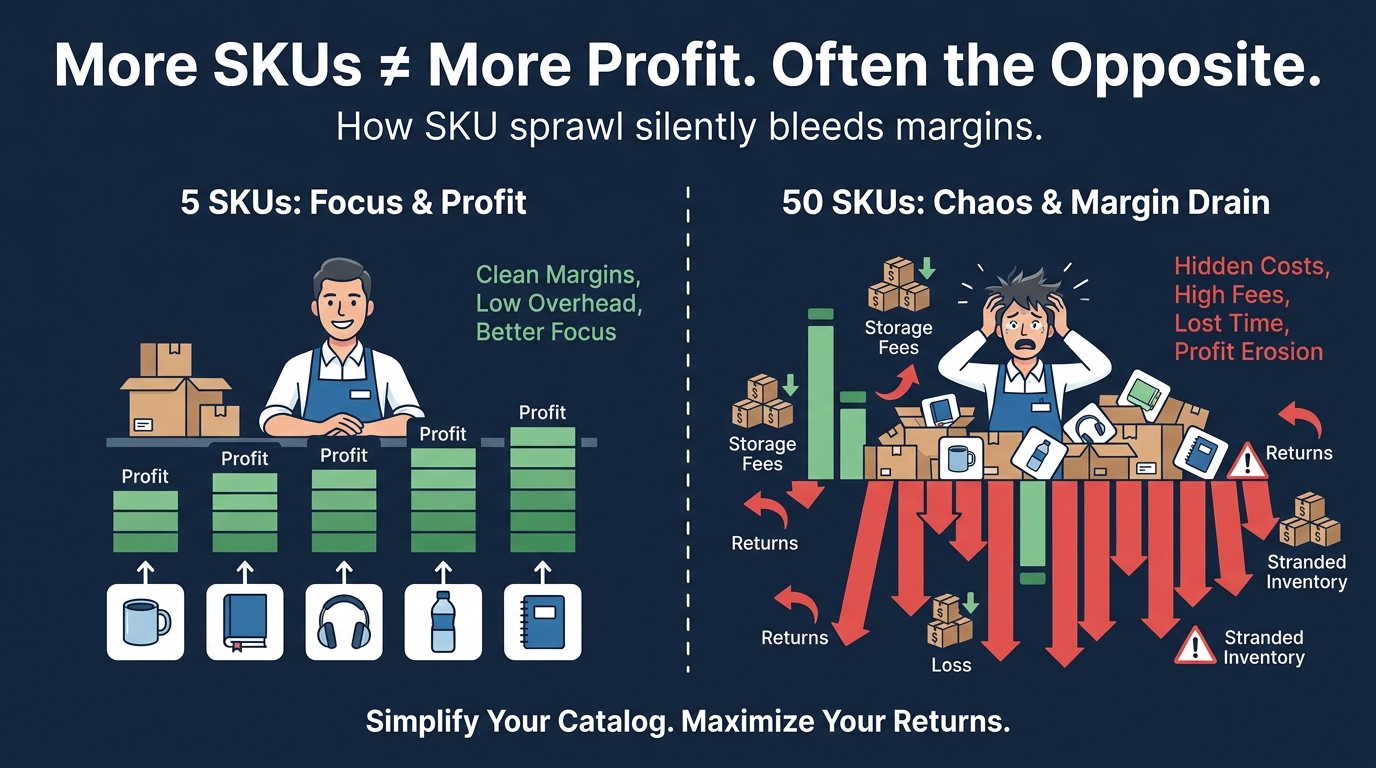
Expansion feels like growth. Adding new products, new variations, new bundles — it looks like the business is scaling. It generates activity in the seller account. It creates the feeling of momentum. And for many Amazon businesses, it is where profitability quietly falls apart.
The Management Overhead of Each New SKU
Every ASIN you add to your catalog requires its own inventory planning, its own advertising campaigns, its own listing maintenance, its own review monitoring, its own pricing strategy, and its own return rate tracking. The marginal cost of managing each additional SKU is not zero — even if it feels low because you are handling it alongside everything else.
In practice, time and attention are the scarcest resources for most Amazon sellers. When attention is spread across 50 SKUs, each one receives approximately 1/50th of the analytical focus it would get in a smaller catalog. The SKUs that are quietly underperforming — the ones with slow turnover, high return rates, or advertising spend that exceeds their margin — do not get detected because nobody is looking at each one closely enough. They just keep bleeding, unit by unit, month by month.
Stranded Inventory: The Silent SKU Tax
Stranded inventory occurs when units are in an Amazon fulfillment center but cannot be sold — typically because the associated listing is inactive, suppressed, or has a policy violation. Stranded inventory still incurs storage fees. It generates no revenue. And it often persists for weeks or months because sellers with large catalogs do not check the stranded inventory report regularly enough to catch it.
Amazon monitors stranded inventory levels and — if the issue persists — may offer to liquidate or dispose of the units on the seller’s behalf, sometimes at rates the seller would not have chosen. Managing stranded inventory is primarily an operational discipline problem, not a technology problem. But it requires attention that thin-spread sellers rarely apply consistently.
The Variation Trap
Product variations — color variants, size variants, bundle configurations — are a specific form of SKU proliferation that creates its own economics trap. Reviews aggregate at the parent level, which is the primary benefit of variations. But inventory requirements are at the child (individual variant) level. Each size, each color, each bundle configuration requires its own purchase order in its own quantity.
A seller with a product offered in six colors needs to split their inventory purchasing across six variants. If they forecast incorrectly — which is almost inevitable because individual variant demand is harder to predict than aggregate demand — some variants will stock out while others accumulate aged inventory fees. The optimal inventory position across six variants is mathematically harder to maintain than the optimal position across one or two products. The return? Often minimal, because most of the purchase volume concentrates in two or three dominant variants anyway.
The Pareto Reality of Amazon Catalogs
Analysis of multi-SKU Amazon accounts consistently reflects a Pareto-like distribution: roughly 20% of SKUs drive 80% of revenue, and a similar or more extreme distribution applies to profit. The top-performing SKUs often have better review momentum, more developed advertising history, and stronger organic ranking — advantages that compound over time. Meanwhile, the tail of the catalog generates activity, storage costs, and management overhead disproportionate to its contribution to the bottom line.
The sellers who improve profitability most dramatically without necessarily growing revenue are those who deliberately cut catalog tail. They identify the SKUs in the bottom quartile of profitability — accounting for all real costs, not just gross margin — and sunset them systematically. Every removal frees up capital, storage capacity, and management attention for the products that actually drive value.
Building a Sustainable Unit Economics Model
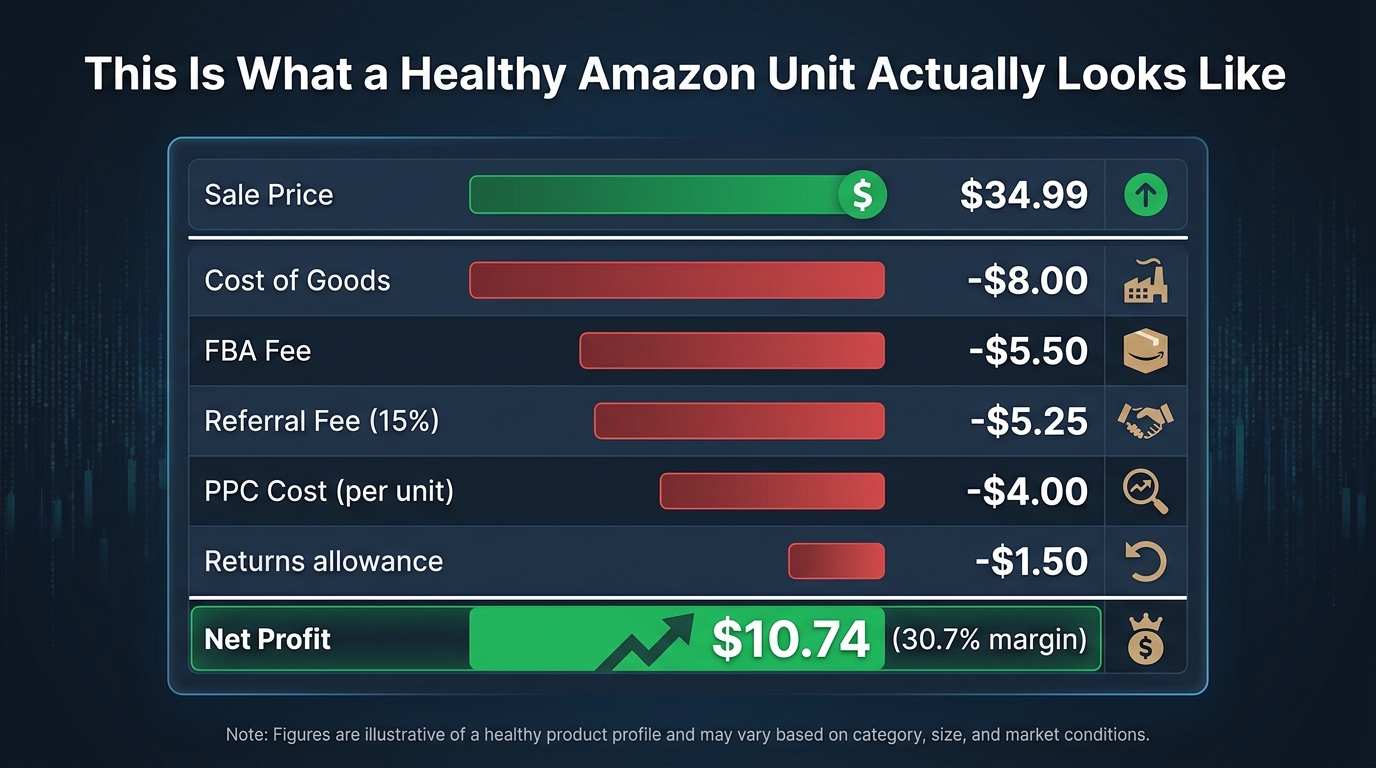
Everything discussed so far points to the same underlying need: a rigorous, comprehensive unit economics model that accounts for every cost layer — not just the obvious ones. Most sellers operate with a simplified margin calculation that significantly overstates actual profitability. The goal of this section is to lay out what a complete model looks like.
The Complete Unit P&L
A complete unit-level profit and loss statement for an Amazon product should include all of the following line items:
Revenue side: Average selling price (not list price — the actual realized average after coupons, promotions, and price variations).
Direct cost deductions:
- Amazon referral fee (percentage of average selling price)
- FBA fulfillment fee (per-unit, based on actual dimensional weight)
- Monthly storage cost allocation (monthly storage fee per cubic foot × unit volume ÷ expected monthly sell-through rate)
- Inbound placement fee allocation
- Returns cost allocation (return rate × [refund amount + returns processing fee + unit cost of goods × non-resaleable return percentage])
- Cost of goods (landed cost including manufacturing, freight, customs, and prep)
- PPC cost allocation (total monthly advertising spend on the ASIN ÷ units sold)
- Financing cost allocation (if using external capital to fund inventory, the interest cost per unit)
- Overhead allocation (a proportional share of any software subscriptions, agency fees, or employee costs attributable to the SKU)
The resulting number — after all of these deductions — is true net margin per unit. This number is almost always lower than what shows up in a simplified gross margin calculation, and it is the only number that tells you whether a product is genuinely profitable.
The Product Viability Threshold
For a product to be worth selling on Amazon in a sustainable way, it needs to clear a meaningful net margin threshold — not just a positive one. A product with a 5% net margin sounds profitable until you consider that a 10% increase in PPC competition, a supplier price increase at the next order, or a slight change in storage fees could push it below zero. Products need enough margin buffer to absorb cost variability without becoming loss leaders.
A commonly cited minimum threshold for private label products with standard FBA economics is 25–30% net margin after all costs. This is not a rule, but a rough benchmark that accounts for the cost volatility inherent in the Amazon channel. Products with thinner margins require either much higher volume (to dilute fixed costs) or significantly better operational efficiency to remain viable long-term.
When to Build the Model — Before Launch, Not After
One of the most consequential shifts a seller can make in their process is moving unit economics analysis from post-launch review to pre-launch product evaluation. The full model described above should be completed for every product before a purchase order is placed. Not an approximation — the actual numbers, using real supplier quotes, real FBA fee estimates from the Amazon fee calculator, real category referral rates, and realistic PPC cost assumptions based on keyword CPC data for the target search terms.
This shifts the product selection filter from “does this look popular?” to “does this actually make money?” The two questions have very different answers for a significant portion of the products sellers pursue.
What Profitable Amazon Sellers Actually Measure
There is a difference between the metrics Amazon Seller Central prominently surfaces — revenue, units sold, session count, conversion rate — and the metrics that actually determine whether an Amazon business is healthy. Profitable sellers tend to have a short list of measures they track obsessively, and those measures are different from what most dashboards emphasize.
Net Margin Per Unit, Not Gross Revenue
The most important single metric is net margin per unit, calculated as described in the previous section. Profitable sellers run this calculation at least monthly for every active SKU, and immediately flag any ASIN where net margin has fallen below their viability threshold. Revenue trends are monitored for context but not treated as the primary health signal.
Inventory Turn Rate
Inventory turn rate — the number of times per year that the inventory of a given SKU is sold and replaced — is a critical efficiency metric. High turn rates mean capital is cycling quickly back into usable cash. Low turn rates mean capital is sitting in warehouse storage, accruing fees and opportunity cost. Target turn rates vary by category and margin profile, but most healthy FBA businesses target a minimum of 6–8 turns annually for standard products, with faster-moving SKUs ideally turning 12 or more times.
TACoS, Not Just ACoS
As discussed, Total Advertising Cost of Sales (TACoS) — ad spend divided by total revenue — is more meaningful than ACoS as a measure of advertising efficiency relative to the whole business. Profitable sellers track TACoS monthly by ASIN. A rising TACoS signals that advertising is becoming a larger portion of total revenue, which either means organic velocity is declining (and ads are compensating) or advertising spend is growing faster than total sales. Either way, it warrants investigation.
Days of Inventory (DOI)
Days of Inventory on Hand — current FBA inventory divided by daily sales rate — tells you how long your current stock will last. Monitoring this against your product’s replenishment lead time (how many days from order placement to FBA-ready stock) tells you whether you are at risk of stocking out before the next shipment arrives. Sellers who track DOI proactively place reorder alerts at (lead time + safety stock buffer) days, ensuring restocking orders are triggered before the risk window opens.
Return Rate by SKU
Return rate, reviewed monthly at the SKU level, catches quality and expectation-misalignment problems before they compound. A product whose return rate has trended from 6% to 11% over three months is telling you something — either a quality issue has emerged, a new competitor’s product is making yours look inferior, or a listing change altered buyer expectations. Each of these requires a different response. You cannot act on a problem you are not measuring.
Working Capital Cycle Length
Profitable sellers also track their working capital cycle — the number of days between paying for inventory and receiving the resulting revenue into their bank account. This number changes as supplier terms evolve, as sell-through rates shift, and as Amazon’s payout policies are adjusted. Tracking it explicitly prevents the surprise of discovering a cash shortage during a growth period.
The Structural Advantage That Changes the Math
Understanding all of the cost layers, traps, and metrics in the preceding sections leads to a more fundamental question: given these economics, what actually creates durable advantage on Amazon? The answer is not a single tactic. It is a set of structural factors that compound over time and reduce the pressure every individual cost layer creates.
Supplier Relationships and Cost of Goods Control
The single largest lever in unit economics is cost of goods. Every dollar reduction in COGS (cost of goods sold) goes directly to the margin without being partially offset by additional fees. Sellers who invest in supplier relationships — consistent ordering, longer-term commitments, quality feedback loops, in-person factory visits — gain negotiating credibility that translates to better unit pricing over time. This is slow work, but it is compounding. A supplier who trusts your account and values your volume is more likely to offer priority production scheduling, better payment terms, and price consideration at the next order review.
Brand Registry and Content Differentiation
Amazon Brand Registry unlocks access to A+ Content, Brand Stores, and Sponsored Brand campaigns. Beyond the marketing benefits, Brand Registry provides intellectual property protections — specifically the ability to proactively search for and report counterfeit or unauthorized listings. For private label sellers, losing control of their listing to a counterfeit or inauthentic seller is a direct margin and brand equity event. Registry-enabled brand protection prevents the listing degradation that results when unauthorized sellers undercut prices or deliver inferior products under a brand’s ASIN.
Repeat Purchase and Customer Lifetime Value
Amazon’s Subscribe & Save program — available for consumable products — changes the unit economics calculation in a meaningful way. A customer who subscribes generates recurring revenue without recurring advertising cost. The PPC spend that acquired them is effectively amortized across every subsequent order they place on subscription. For consumable categories, tracking what percentage of revenue comes from Subscribe & Save versus one-time purchases gives a clearer picture of the business’s actual customer economics — and signals whether the product has the repeat-purchase profile that justifies higher customer acquisition costs.
The Flywheel Is Real — But It Requires Patience
Amazon’s marketplace does reward consistent performers. Products with sustained sales velocity, strong review histories, high conversion rates, and low defect rates receive algorithmic preference that reduces their effective advertising cost over time. The early stages of a product launch are typically the most expensive — high PPC spend, thin organic presence, limited social proof. Products that survive this window and establish strong organic positions experience a gradual shift in their economics: organic traffic grows, advertising becomes a supplementary rather than primary driver of sales, and the cost per acquisition falls.
This flywheel effect is real, but it requires surviving the capital-intensive early period without destroying margins in the process. Sellers who understand the full cost structure from the start can make the early-stage investment consciously, with clear eyes about what the payoff period looks like — rather than discovering the economics midway through and being surprised by the outcome.
Conclusion: Margin-First Thinking on Amazon
The Amazon marketplace offers genuine opportunity — a platform with hundreds of millions of active buyers, sophisticated fulfillment infrastructure, and category reach that no single seller could replicate independently. That opportunity is real. But the cost structure that comes with accessing it is also real, and it is more complex than the average seller maps before launching.
The sellers who build sustainable, cash-generative Amazon businesses in 2026 share a common orientation: they think about margin before they think about growth, and they insist on understanding the real economics of every unit they sell before deciding whether it is worth selling. They do not optimize for revenue. They optimize for net cash, measured accurately.
This sounds obvious. In practice, it is a significant departure from how most sellers approach the channel — especially in the early stages when revenue growth feels like the validation metric that matters. Revenue is easy to generate at thin or negative margins. Profit, on Amazon, requires deliberate construction.
Key Takeaways for Sellers in 2026
- Calculate the full fee stack before launch. Add up referral fees, FBA fulfillment fees, inbound placement fees, storage cost allocation, returns allocation, and advertising cost allocation. Compare this total against your landed COGS and your target selling price. If the margin is below 25%, re-examine the product or the pricing.
- Track TACoS, not just ACoS. Your advertising efficiency against total revenue is the signal that matters. ACoS alone flatters campaigns that are compensating for organic rank loss.
- Build a cash flow model alongside your P&L. Know your working capital cycle. Know when your supplier payment is due relative to when Amazon will deposit your revenue. Plan your reorder timing to prevent the cash gap from forcing decisions you would not otherwise make.
- Audit your SKU catalog quarterly for true net margin. Every SKU that falls below your viability threshold — after all real costs — is a candidate for sunsetting. Freeing that capital and management attention for your highest-margin products is a growth strategy, even if it feels like a retreat.
- Treat returns as a data source, not just a cost. Monthly ASIN-level return rate review, with reason code analysis, catches problems early enough to address them before they compound into significant financial damage.
- Set pricing floors before you set repricers. Know the lowest price at which each product is worth selling, with full costs loaded. Configure any automated pricing below that floor as an impossibility, not a competitive option.
Amazon selling in 2026 is not a simpler channel than it was five years ago. It is more competitive, more expensive to advertise in, and more operationally complex. But complexity cuts both ways. The sellers who invest the effort to understand their economics fully — and who build their decisions around accurate cost data rather than revenue signals — have a meaningful structural advantage over those who do not. That advantage compounds. And compounding, on Amazon as everywhere else, is how businesses actually win.