
Ask an Amazon seller how the business is doing and you’ll usually hear a revenue number. “We did $80K last month.” “We crossed seven figures this year.” Those numbers are real, and they’re easy to find because Seller Central puts them right on the dashboard.
Ask the same seller what they kept from each unit after every fee, every return and every ad click, and the answer usually takes longer. Sometimes it’s a guess. Sometimes it’s a number from a spreadsheet built two years ago, when the fee schedule looked quite different.
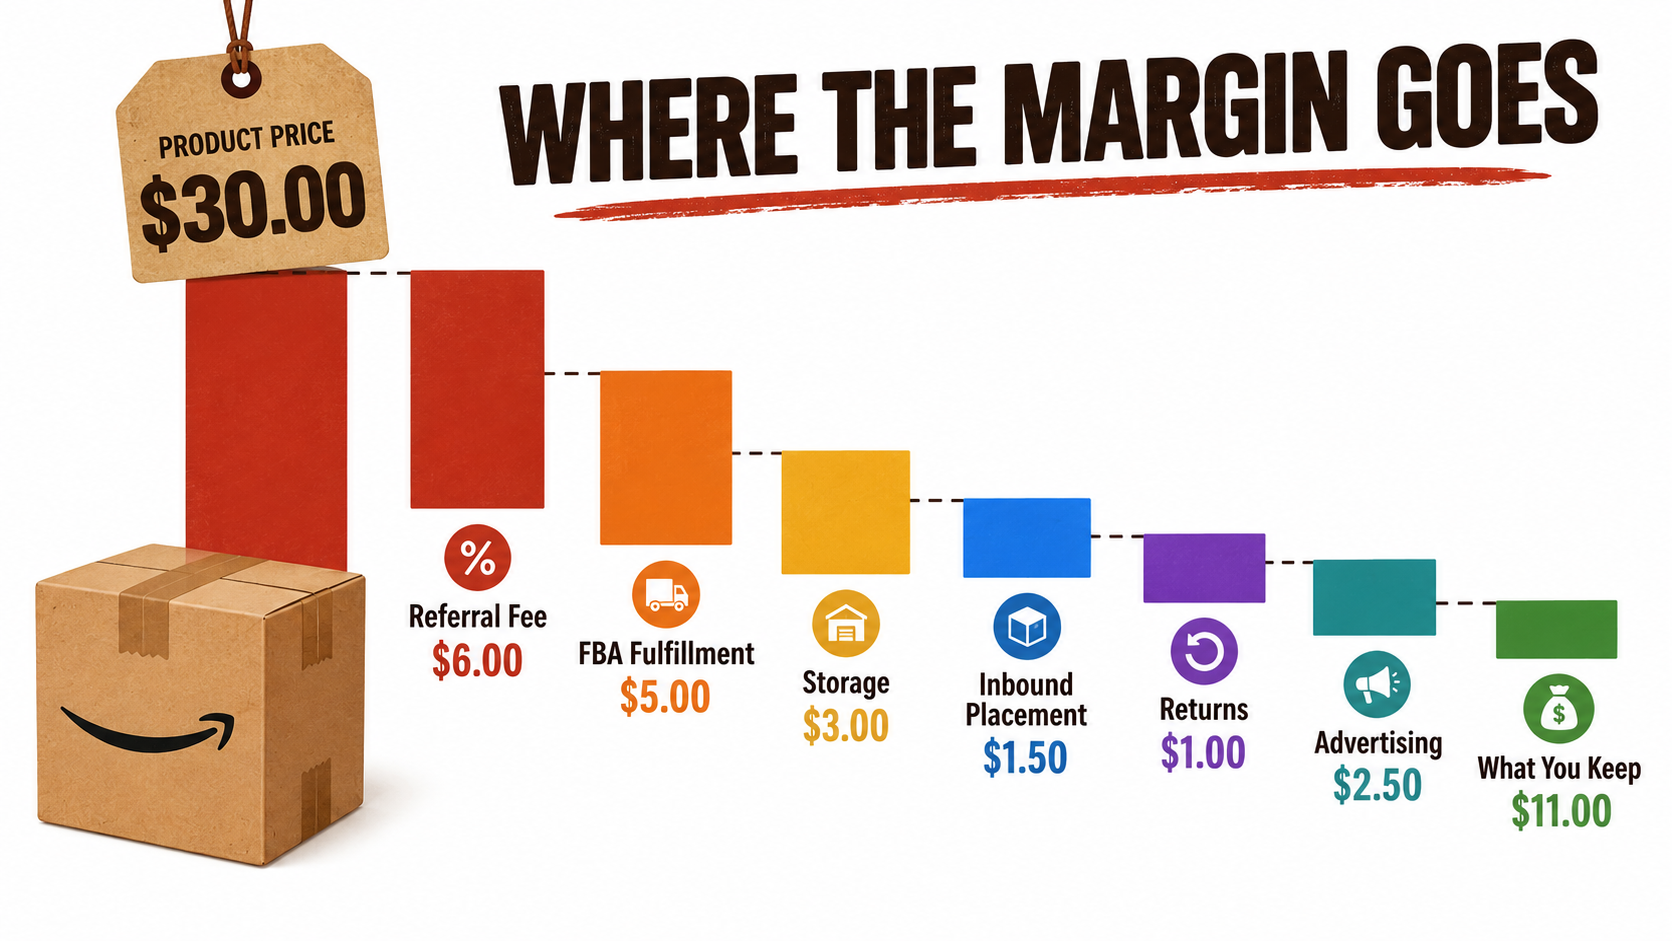
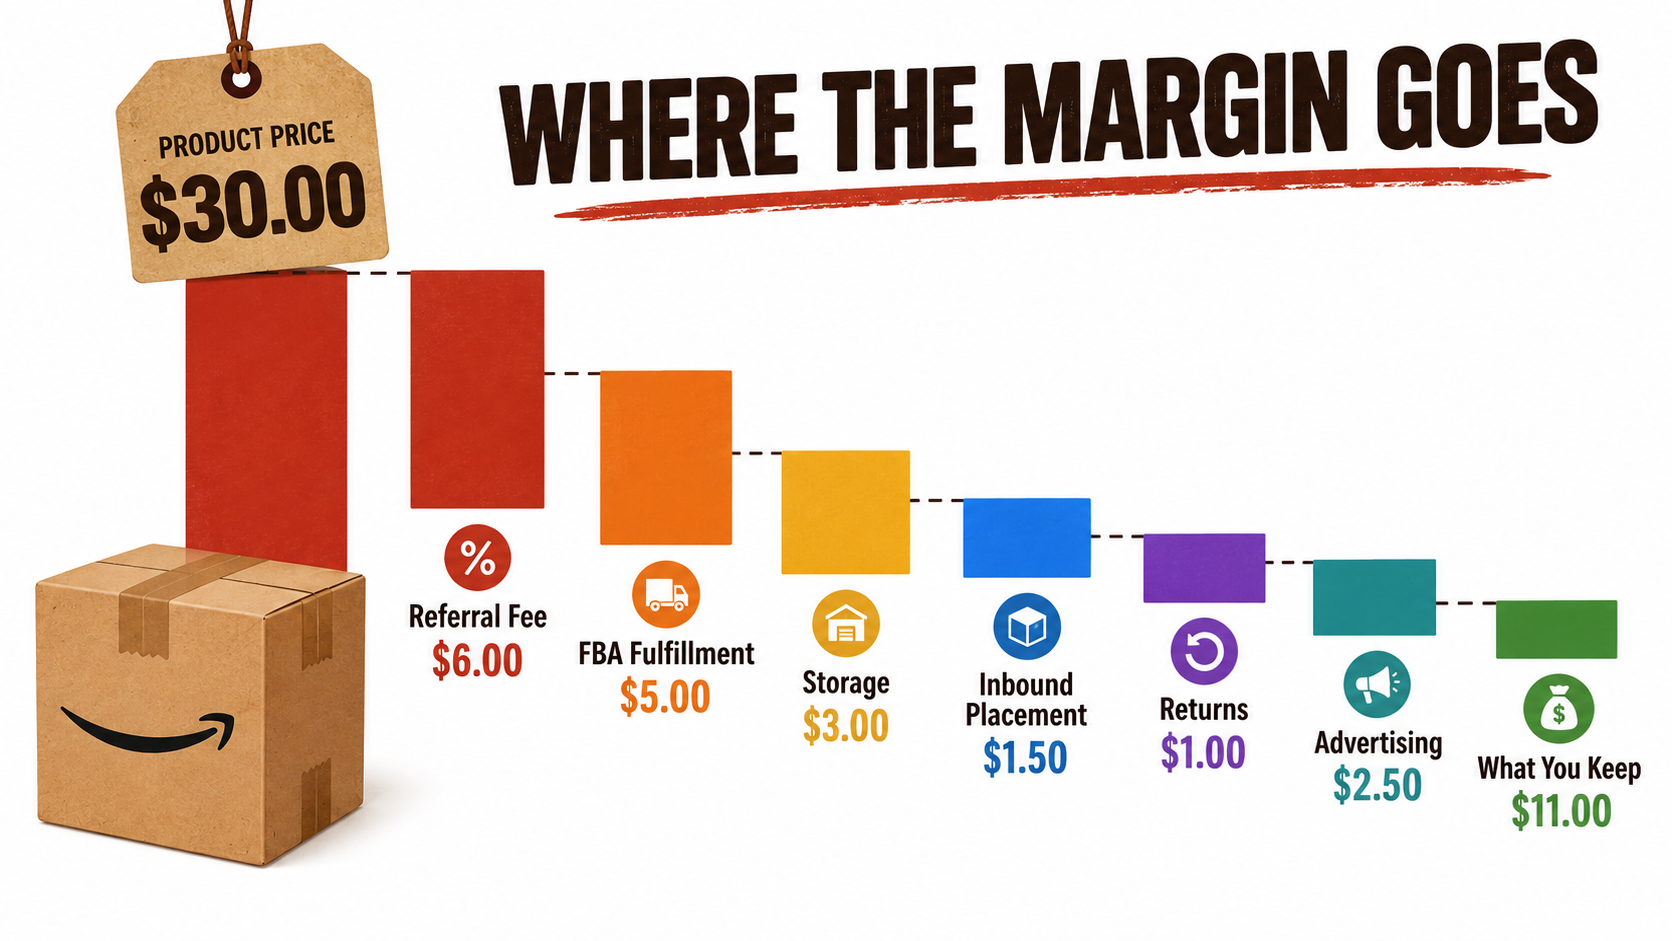
That gap between what you sell and what you keep is where Amazon businesses quietly succeed or fail. Amazon’s fee structure isn’t one fee. It’s a stack of separate charges, each triggered by a different behavior: how big your box is, how much stock you hold, how you ship it in, how often customers send it back, and how hard you push on advertising.
Over the past few years Amazon has added several new layers to that stack. These include an inbound placement service fee, a low-inventory-level fee, a storage utilization surcharge and a returns processing fee for products with high return rates. Each one is small when you look at it alone. Stacked on top of each other, they can turn a product that looks profitable into one that loses money on every sale.
This article doesn’t give you another list of growth tactics. It works through the fee stack one layer at a time, explains what triggers each charge and what you can control, and then shows how to build a contribution margin waterfall you can actually trust. Finally, it lays out a monthly audit routine for catching margin leaks before they add up.
A note on numbers: Amazon updates its rate cards regularly, often every January with smaller changes during the year. This article explains how each fee works and how to think about it. Always check exact rates against the current Seller Central fee pages for your marketplace and category before making pricing decisions.
Why the Revenue Number Misleads Amazon Sellers
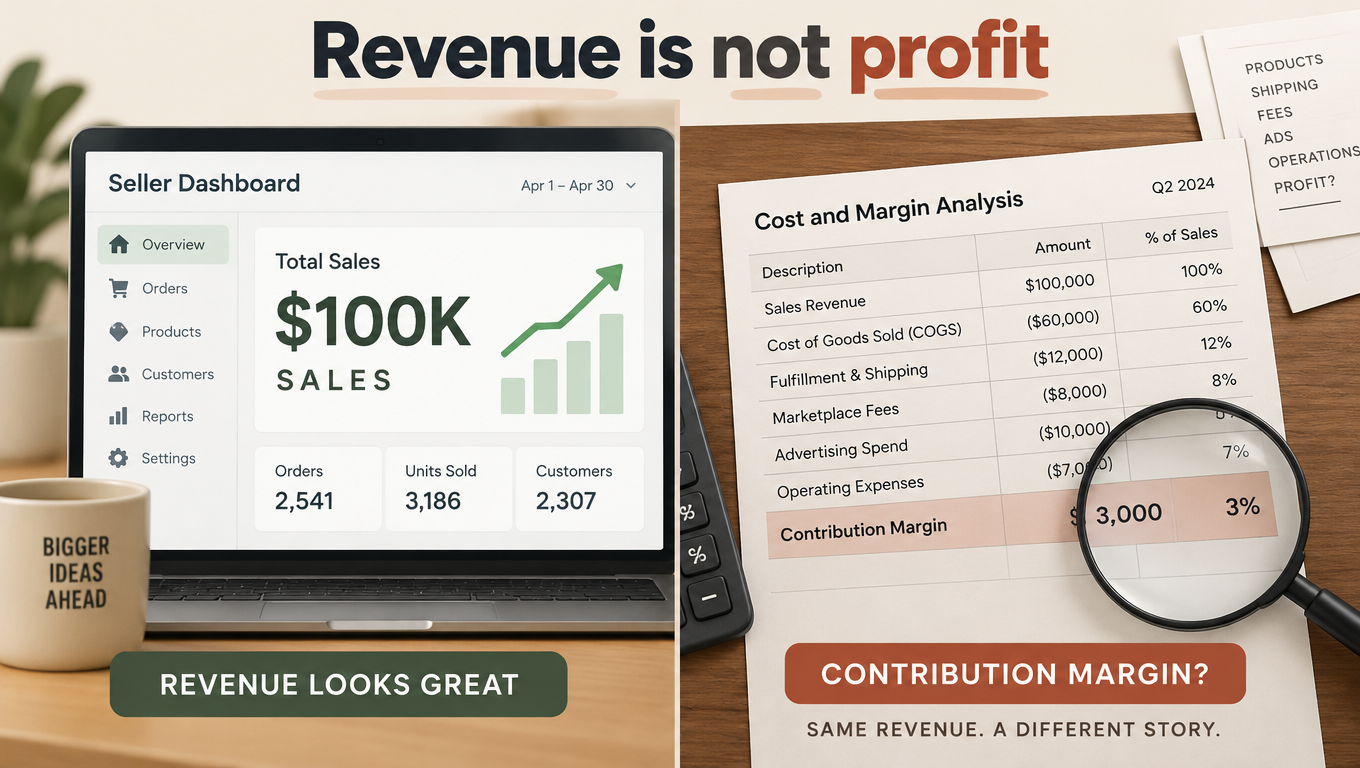
Revenue is the most visible number in an Amazon business, and that’s exactly why it misleads. It goes up when you discount. It goes up when you spend more on ads. It goes up when you add a SKU that loses money on every unit. None of that tells you whether the business is healthier.
The dashboard bias
Seller Central’s main views focus on sales, units ordered and sessions. Fees show up mostly in settlement reports, transaction views and payments summaries, which are spread across different screens and timeframes. That isn’t necessarily deliberate. Fees simply happen on different schedules: some per unit, some monthly, some when inventory arrives, some weeks after a sale when a return is processed.
The result is predictable. Sellers optimize what they see every day, which is sales. They check what they see less often, which is fees, only when cash in the bank doesn’t match what they expected.
Three numbers that matter more than revenue
To judge whether an Amazon business is healthy, three metrics tell you far more than the top line:
- Contribution margin per unit: the sale price minus every variable cost tied to that unit. That includes product cost, freight, Amazon fees, a share of returns and a share of advertising.
- Contribution margin as a percentage of revenue: this lets you compare SKUs with very different price points.
- Cash conversion cycle: how long money sits tied up in inventory, in transit and in Amazon’s payout schedule before it comes back to you.
A seller doing $50K a month at a 25% contribution margin has $12,500 available to cover overhead and profit. A seller doing $120K a month at 8% has $9,600. The bigger business is smaller where it counts, and it carries much more inventory risk.
Why this matters more now
When Amazon’s fee structure was simpler, a rough rule of thumb could work. You’d estimate that referral plus FBA fees came to about a third of the price, and that was close enough. That shortcut is much less reliable now. Several fees depend on how you behave, not on what you sell. Two sellers with the same product at the same price can pay very different total fees depending on inventory levels, inbound shipping choices and return rates.
So contribution margin isn’t a fixed property of a product. It’s the result of how you run the product, and that’s good news, because it means much of the stack is within your control.
Layer 1: Referral Fees, the Percentage You Can’t Avoid
The referral fee is the base layer of the stack. It’s Amazon’s commission for selling on the marketplace, charged as a percentage of the total sale price. It applies whether you use FBA or fulfill orders yourself.
How referral fees work
For many common categories in the US marketplace, the referral fee is 15% of the total sale price. Some categories use different rates, and some use tiered rates where the percentage changes above or below a price threshold. Most categories also have a per-item minimum referral fee, which has historically been $0.30 in the US.
The key detail many sellers miss is that the fee is calculated on the total sale price. That generally includes the item price plus any shipping or gift-wrap charges the customer pays. If you fulfill orders yourself and charge for shipping, you pay referral fees on that shipping revenue too.
Tiered categories and price-point decisions
In categories with tiered referral rates, the price you choose can change your percentage. Some categories have historically charged a lower rate for items under a price threshold and a higher rate above it. Others work the other way, charging a lower rate on the part of the price above a threshold.
This creates real pricing considerations. A product priced just above a tier boundary might pay a meaningfully higher referral percentage than the same product priced a dollar lower. Before you set a price, check the current referral fee schedule for your category and see where the boundaries fall.
What you can and can’t control
You can’t negotiate referral fees, and in most cases you can’t avoid them. You do have three indirect levers:
- Category accuracy: make sure products are listed in the correct category. Miscategorized products can be charged the wrong rate, and the fix in either direction depends on where the product truly belongs.
- Price positioning: in tiered categories, choose price points with the tier boundaries in mind.
- Bundling: raising the average order value through bundles doesn’t lower the referral percentage, but it spreads per-unit costs like fulfillment across more revenue. That improves margin on the overall transaction.
The subscription fee
Next to referral fees sits the account-level subscription. The Professional selling plan has long been $39.99 per month in the US. The Individual plan charges a per-item fee instead, historically $0.99 per unit sold. For any seller moving more than about 40 units a month, the Professional plan costs less. It also unlocks advertising, the Buy Box and most of the tools a real business needs. For most sellers this is a fixed overhead line rather than a variable cost, but it belongs in your monthly reconciliation.
Layer 2: FBA Fulfillment Fees and the Tyranny of Size Tiers
For sellers using Fulfillment by Amazon, the fulfillment fee is usually the second-largest Amazon charge per unit. It covers picking, packing, shipping to the customer and standard customer service. Unlike the referral fee, it isn’t a percentage. It’s a flat amount per unit, set by the product’s size tier and shipping weight.
How size tiers work
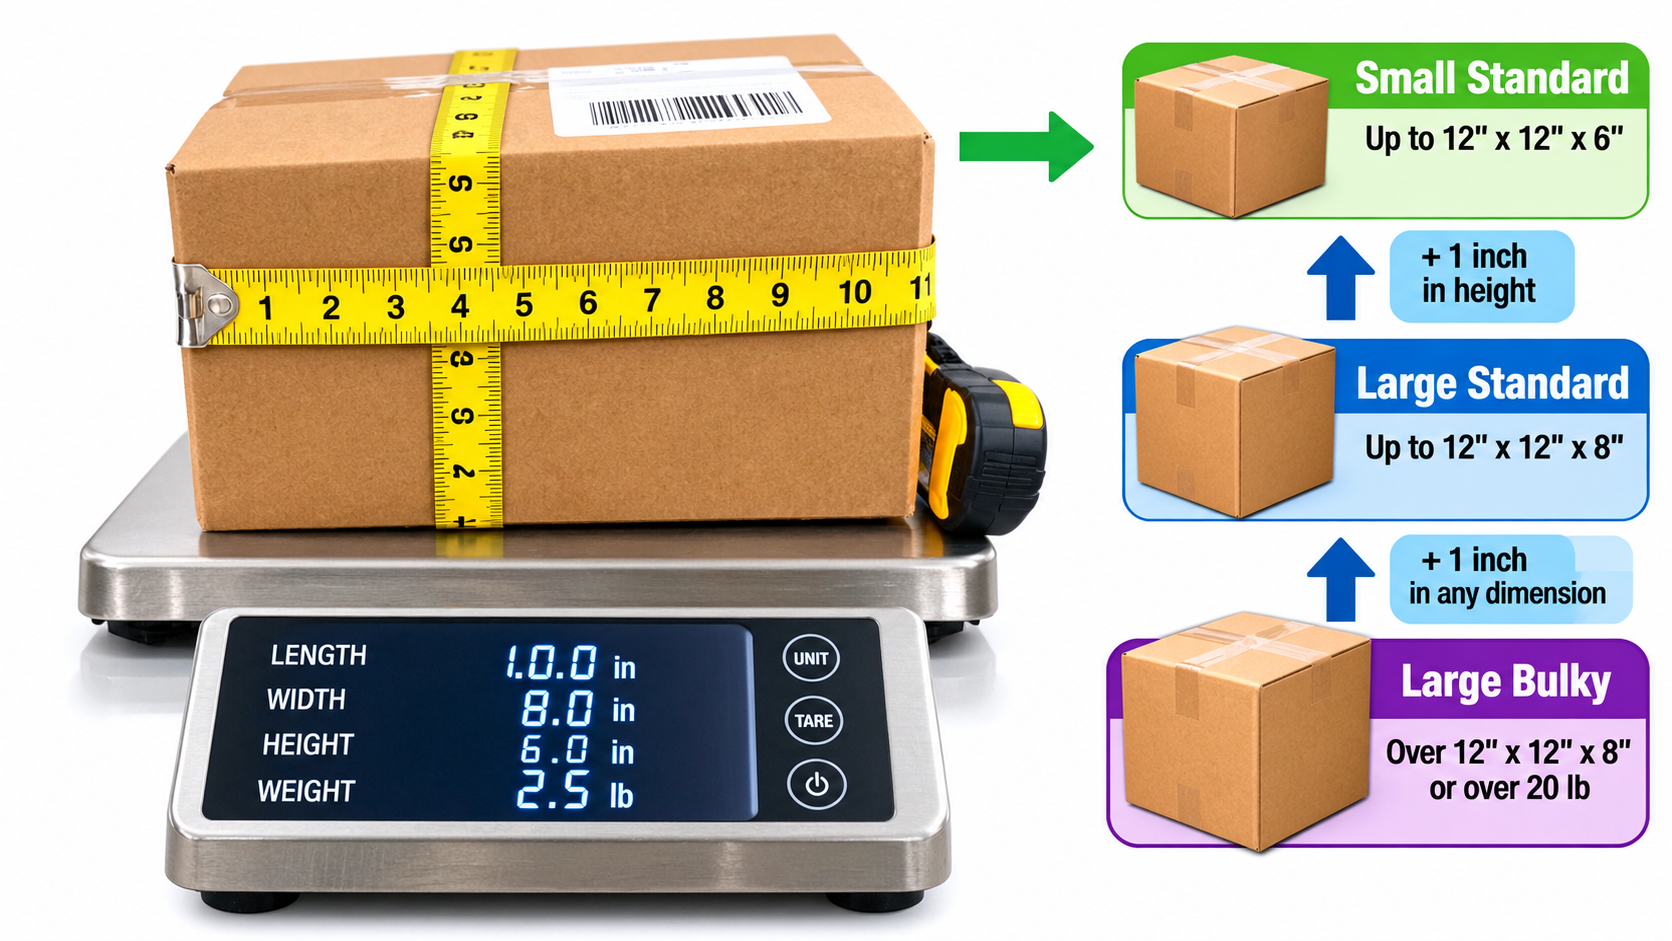
Amazon puts every FBA product into a size tier based on its packaged dimensions and weight. In the US these have included small standard, large standard, large bulky and several extra-large tiers. Within each tier, fees rise in weight bands.
The important point is that tier boundaries are hard cliffs. A product that measures just over the limit on one dimension moves into the next tier, and the fulfillment fee can jump by a meaningful amount for the sake of a fraction of an inch.
Dimensional weight
For many larger tiers, Amazon charges on the greater of the unit weight and the dimensional weight. Dimensional weight is calculated from the box’s length, width and height using a divisor. A light but bulky product, such as a pillow, a plastic storage bin or a padded case, can be billed as if it weighs much more than it does.
This is where packaging engineering pays for itself. Cutting a box by an inch on each side can lower dimensional weight enough to drop a weight band, or sometimes a whole size tier. Across thousands of units a year, that adds up to a real number.
Low-price FBA rates
Amazon has offered reduced fulfillment fees for low-priced products, generally items under a set price threshold. For sellers with cheaper products, those reduced rates can be the difference between a viable product and one that doesn’t work. If your price sits just above the threshold, it’s worth modeling whether dropping below it would increase what you keep per unit, given both the lower fee and any change in conversion.
The measurement problem
Amazon measures and weighs products at its fulfillment centers, and its measurements are what count for billing. Sometimes those measurements are wrong. A product can be measured with its box bulging, measured on a bad scale, or confused with a different SKU.
When that happens, you pay a higher fulfillment fee on every unit until someone notices. Sellers who don’t check their FBA fee per unit against their expected fee can overpay for months. We’ll come back to this in the hidden leaks section, but for now, keep a reference sheet of your own verified dimensions and weights for every SKU.
Practical levers for the fulfillment layer
- Design packaging around tier boundaries, not around what looks good on a shelf.
- Check the size tier and fulfillment fee Amazon has assigned to each ASIN against your own measurements.
- For bulky, low-weight products, test whether compressed or vacuum-sealed packaging lowers dimensional weight without hurting the customer experience.
- For very large or heavy items, compare FBA against fulfilling orders yourself or using a third-party logistics provider. The answer isn’t always FBA.
Layer 3: Inventory Fees, Where You Get Charged for Too Much and Too Little
Inventory fees are where Amazon’s fee structure has changed most, and where seller behavior matters most. Today you can be charged for holding too much inventory and also for holding too little. The profitable zone sits between two penalties.
Monthly storage fees
The base layer is the monthly inventory storage fee, charged per cubic foot of space your inventory takes up in Amazon’s fulfillment centers. Rates differ by size category (standard versus oversize) and by season. Storage costs considerably more in the October-to-December peak period than in January to September.
This means the same pallet of inventory costs more to hold in November than in March. Sellers who send in Q4 inventory too early pay peak rates on stock that isn’t selling yet.
The storage utilization surcharge
Starting in 2024, Amazon introduced a storage utilization surcharge. It applies on top of standard storage fees when a seller’s storage utilization ratio is high. That ratio compares the average daily volume of inventory you store with the average daily volume shipped over a trailing period, measured in weeks of supply. The surcharge has applied once that ratio goes above 22 weeks, with the rate rising at higher bands. Some sellers, such as new sellers and those with small inventory volumes, have been exempt.
In practice, this surcharge penalizes slow-moving inventory across your whole account, not just on individual SKUs. A handful of dead products can raise the ratio enough to increase storage costs on everything.
The aged inventory surcharge
Inventory that sits in fulfillment centers past certain age thresholds is charged an aged inventory surcharge (formerly called the long-term storage fee). The surcharge begins once inventory passes 181 days and rises in steps the longer it stays. For products that have stopped selling, the aged inventory surcharge can eventually be more than the product is worth.
The low-inventory-level fee
The other side of the squeeze is the low-inventory-level fee, introduced in 2024. Amazon charges it per unit shipped when a product’s inventory is consistently low compared with demand. As it launched, the fee applied when both short-term and long-term historical days of supply fell below 28 days. Exemptions covered new sellers, newly launched products and certain other cases.
Amazon’s stated reasoning is that low inventory forces it to ship from fulfillment centers farther from customers, which raises its costs. Whatever you think of the reasoning, the effect is clear. Sellers who run lean to avoid storage fees can now pay a per-unit penalty instead.
Finding the healthy band
Together, these fees create a target range. Too little stock relative to sales, and you pay the low-inventory fee. Too much, and you pay higher storage costs, the utilization surcharge and eventually aged inventory fees.
For most sellers the practical target is to keep fast movers comfortably above the low-inventory threshold, while keeping overall account-level weeks of supply below the utilization surcharge trigger. Doing that well usually requires:
- Forecasting at the SKU level rather than ordering by gut feel.
- Using off-Amazon storage, such as Amazon Warehousing and Distribution or a third-party warehouse, as a buffer so you replenish FBA in smaller, more frequent shipments.
- Liquidating, removing or bundling slow movers before they push up your account-wide ratio.
- Planning Q4 inbound shipments so stock arrives close to when demand starts rising, not weeks earlier.
Treat inventory fees as an operations metric
The biggest change in mindset is to stop treating inventory fees as a cost of doing business and start treating them as a scorecard for your supply chain. A rising storage-fee line or a new low-inventory fee is an operational signal. It tells you your forecasting, purchasing or inbound process needs attention.
Layer 4: Inbound Placement and the Cost of Getting Inventory In
Before a unit can earn anything, it has to get into Amazon’s network. Inbound logistics used to be mostly about freight costs. Since 2024, Amazon has added its own charge to that process.
The inbound placement service fee
The inbound placement service fee applies depending on how you choose to split your inbound shipments. When you create a shipment, Amazon offers placement options. If you send everything to one location or a small number of locations, Amazon charges a placement fee per unit for distributing the inventory across its network itself. If you accept Amazon’s optimized split, sending inventory to several fulfillment centers it chooses, the placement fee can be lower or zero.
The fee varies with the size tier, shipment size and the placement option you pick. For sellers who used to send everything to one warehouse to keep freight simple, this added a new per-unit cost.
The real trade-off: placement fee vs. freight complexity
Picking the optimized split isn’t automatically the cheaper choice. Sending smaller shipments to several fulfillment centers can raise your freight costs, add carrier pickups and make tracking harder. For LTL or full-truckload shipments in particular, splitting a load can cost more in freight than the placement fee would have saved.
The right answer comes from comparing:
- Total placement fee for the single-location option.
- Total freight cost for the multi-location option, including extra handling and carrier charges.
- The effect on receiving time, since inventory that takes longer to be received can’t sell.
Amazon’s partnered carrier and AWD options
Amazon offers partnered carrier programs and Amazon Warehousing and Distribution (AWD), its upstream storage service. AWD can automatically replenish FBA from bulk storage, and Amazon has offered incentives on fees for inventory moved this way. For some sellers, routing inventory through AWD lowers the combined cost of placement fees, storage and low-inventory risk. For others, a third-party warehouse gives more flexibility at a lower price.
The honest answer is that it depends on your volume, product size and how predictable your demand is. What matters is that you run the comparison, rather than defaulting to whatever option you set up three years ago.
Prep and labeling costs
Inbound costs also include prep: labeling, poly-bagging, bubble wrap and bundling. You can have Amazon do some of this for a per-unit fee, or do it yourself, at your supplier or at a prep center. Getting prep wrong costs money too. Non-compliant shipments can be charged for unplanned prep, delayed or refused.
Putting inbound costs in your unit economics
Many sellers include ocean or air freight from the factory in their landed cost, but leave out the domestic leg and the placement fee. Every cost incurred before the unit is available for sale belongs in the per-unit cost. A practical approach is to calculate a fully loaded inbound cost per unit for each shipment. That’s freight plus placement fee plus prep, divided by units. Track it over time, because it changes with your shipment decisions.
Layer 5: Returns, the Fee That Shows Up Weeks Later
Returns are the hardest layer to see because they happen after the sale, sometimes weeks later. A return can wipe out the profit from several successful sales, and most sellers underestimate how much each one costs.
The returns processing fee
Starting in 2024, Amazon introduced a returns processing fee for products whose return rates exceed a category-specific threshold. Historically, Amazon covered the cost of processing returns for most categories except apparel and shoes. Under the newer approach, products with unusually high return rates relative to their category can be charged a per-unit fee on returned units above the threshold.
The fee doesn’t apply to every return. It targets products that are returned much more often than similar products. That makes it a signal as well as a cost. If you’re paying it, something about the product, the listing or customer expectations is out of line.
The full cost of a single return
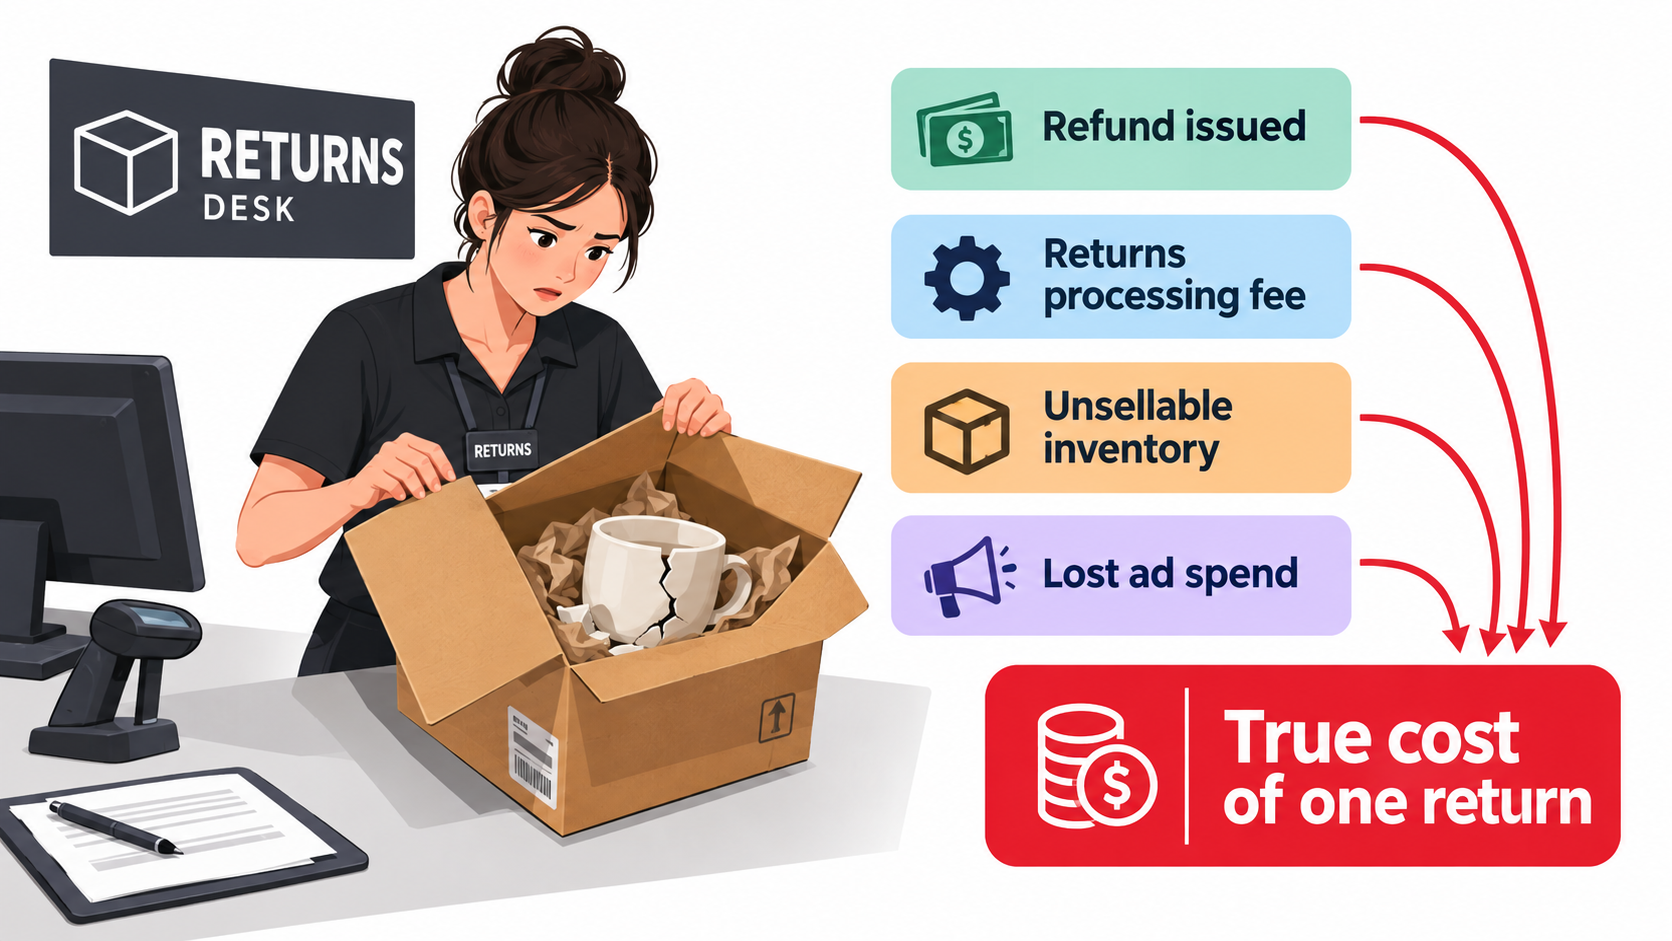
The returns processing fee is just one piece. The full cost of a return usually includes:
- The refund itself: the customer gets their money back, so the revenue disappears.
- Referral fee handling: Amazon generally refunds the referral fee but keeps a refund administration fee, historically the lesser of a fixed amount or a percentage of the referral fee.
- The original fulfillment fee: in most cases the FBA fulfillment fee isn’t refunded, because the fulfillment service was performed.
- Unsellable inventory: if the returned unit is damaged or opened, it may be classed as unsellable. You then pay to have it removed or disposed of, or you write it off.
- Advertising spent to get the sale: the ad cost that produced the order is gone for good.
- Returns processing fee: if the product is above its category’s threshold.
Add it up, and one return on a modest-margin product can cancel out the profit from several good sales.
Reading return reasons as product feedback
Seller Central shows return reasons for FBA returns. They’re imperfect, because customers often pick whichever reason is quickest. Patterns still show up. A cluster of “not as described” returns points to a listing problem: images, dimensions or claims that set the wrong expectations. “Defective” points to quality control. “Too small” or “too large” points to sizing information.
Every one of these is fixable, and fixing them lowers both direct return costs and the risk of crossing the returns processing threshold.
Fraudulent and abusive returns
Some returns aren’t genuine: an empty box, a different item, or a used product returned as new. Amazon has processes for sellers to request reimbursement when a returned item comes back damaged or different. Those claims require you to track returns and file on time. Sellers who never check their returns usually never recover this money.
Budgeting for returns
Every unit economics model should include a returns allowance per unit sold. Take the expected return rate and multiply it by the full cost of a return as broken down above. A product with a 3% return rate and a product with a 12% return rate aren’t the same business, even at the same price and the same fees.
Layer 6: Advertising, the Fee You Choose to Pay
Advertising isn’t technically an Amazon fee, but for most sellers it acts like one. For many competitive products, selling without sponsored ads is barely possible. So it belongs in your per-unit margin, not in a separate marketing budget looked at once a quarter.
ACoS vs. TACoS
Two metrics dominate Amazon advertising:
- ACoS (advertising cost of sale): ad spend divided by sales directly attributed to ads.
- TACoS (total advertising cost of sale): ad spend divided by total sales, both ad-attributed and organic.
ACoS tells you how efficient your campaigns are. TACoS tells you how much of your total revenue goes to advertising, and that’s the number that belongs in contribution margin. If your Amazon fees and product costs leave you a 30% margin before ads, and TACoS is 12%, your contribution margin after ads is about 18%.
Break-even ACoS
Every product has a break-even ACoS: the advertising cost of sale at which an ad-driven order makes exactly zero contribution. It equals your pre-advertising margin as a percentage of price. If your margin before ads is 28%, any campaign running above a 28% ACoS loses money on the orders it directly produces.
That isn’t always wrong. During a launch, or when ads drive enough organic ranking to lift total sales, a seller may deliberately run above break-even. It should be a decision with a time limit and a target, though, not a default that runs for years.
Advertising and the rest of the fee stack
Advertising connects to the other layers in ways that are easy to miss:
- Ads that drive impulse purchases from poorly matched traffic can raise return rates, which feeds back into Layer 5.
- Pushing ad spend hard while inventory is low can trigger stockouts and low-inventory fees, which feeds back into Layer 3.
- Cutting ads sharply on a product with heavy inventory can slow sales and push you toward aged inventory surcharges.
The best advertising decisions are made with the full fee stack in view, not on campaign metrics alone.
Deals, coupons and promotions
Promotional tools come with their own costs. Coupons have typically involved a per-redemption fee on top of the discount. Lightning Deals and other featured deals have carried their own participation fees, and for major events like Prime Day these can be higher. Each of these needs to go into the margin model for the period it runs. A promotion that lifts revenue 40% while turning contribution margin negative isn’t a successful promotion.
Layer 7: The Hidden Leaks Most Sellers Never Audit
Beyond the six visible layers is a set of smaller leaks. None of them looks significant alone, but sellers who never look for them almost always lose money to them.
Lost and damaged inventory
Inventory gets lost or damaged inside Amazon’s network: during receiving, during transfers between fulfillment centers, or in the warehouse itself. Amazon has policies to reimburse sellers for inventory it loses or damages. Many reimbursements happen automatically, but not all of them, and eligibility windows for claims are limited and have shortened over time.
Comparing units shipped against units received, and checking inventory adjustments against reimbursements, is basic work. It’s also the work most sellers skip. Many sellers use reimbursement auditing services for this, typically paying a percentage of what’s recovered.
Inbound shipment discrepancies
When Amazon receives fewer units than you shipped, there’s a reconciliation process for investigating the shortfall. If you don’t open an investigation within the allowed window, with proof of what you sent, the missing units may simply be written off. Keep packing lists, carton counts and carrier documentation for every shipment.
Dimension and weight errors
As covered in Layer 2, Amazon’s measurements decide your fulfillment fee. If a product is mismeasured into a higher tier, you overpay on every unit until it’s fixed. The check is simple: compare the fulfillment fee charged per ASIN with the fee you’d expect from your verified dimensions. If they don’t match, ask Amazon to remeasure the product.
Customer returns not refunded correctly
Sometimes a customer gets a refund but never actually returns the item. Sometimes the item comes back but isn’t put back into sellable inventory. Both are reimbursable in many cases, but only if someone is tracking refunds against returns received.
Removal and disposal fees
Removing or disposing of inventory costs money per unit. That’s often still cheaper than paying aged inventory surcharges, but these fees should be planned, not discovered on a settlement report. If you have slow movers, build removal costs into your exit plan.
Currency and payout timing
For sellers on international marketplaces, currency conversion adds another cost layer, whether through Amazon’s currency converter or a third-party provider. Payout timing also affects cash flow. Funds sit in your Amazon account under a reserve policy and pay out on a schedule. Neither is a “fee” in the usual sense, but both affect how much cash you actually have to run the business.
Building Your Contribution Margin Waterfall
With all the layers mapped, the next step is to put them into one view: a contribution margin waterfall for each SKU. It starts at the sale price and subtracts each cost in order until you reach what you keep.
The structure
A complete per-unit waterfall includes these lines:
- Sale price (average realized price, after any discounts)
- Minus product cost (cost of goods from the supplier)
- Minus inbound cost (international freight, duties, domestic freight, placement fee, prep, divided by units)
- Minus referral fee
- Minus FBA fulfillment fee
- Minus storage allocation (monthly storage, plus any surcharges, divided by units sold)
- Minus low-inventory fee allocation (if applicable)
- Minus returns allowance (return rate × full cost of a return)
- Minus advertising allocation (TACoS × sale price)
- Minus promotional costs (coupon fees, deal fees, divided by units sold)
- Equals contribution margin per unit
A hypothetical worked example
To show how this works, here’s an illustrative example. These figures are hypothetical and simplified, chosen to show the mechanics. They are not current Amazon rates. Swap in your own numbers from your current rate card and reports.
Imagine a household product priced at $30:
- Sale price: $30.00
- Product cost: $6.50
- Fully loaded inbound cost: $1.40
- Referral fee at 15%: $4.50
- FBA fulfillment fee: $5.20
- Storage allocation: $0.45
- Returns allowance (5% return rate × roughly $12 full cost per return): $0.60
- Advertising at 14% TACoS: $4.20
- Promotions allocation: $0.35
Total costs come to $23.20, leaving a contribution margin of $6.80 per unit, or about 22.7%.
Now look at what happens when several things go a little wrong at once. Inventory slips below the low-inventory threshold, adding a fee per unit. A packaging change pushes the product into a higher weight band, adding to the fulfillment fee. Return rates climb to 9%, and TACoS rises to 18% because a competitor enters the market.
None of these changes is dramatic. Together, they could easily cut contribution margin by half or more. The revenue line wouldn’t show any of it, and sales might even go up.
The lesson of the waterfall
The waterfall shows that margin is fragile in a specific way. It doesn’t usually collapse because of one big shock. It wears away through many small changes across different layers, each managed by different people or tools, or by nobody at all. That’s why the next step, a regular audit, matters more than any single optimization.
Tools vs. spreadsheets
Many profit analytics tools pull settlement data from Amazon and build per-SKU profit views automatically. They save a lot of time and are worth looking at for sellers with large catalogs. Still, it’s worth building the waterfall by hand in a spreadsheet at least once for your top SKUs. Doing it yourself forces you to understand every line, which makes it much easier to spot when a tool’s numbers look wrong.
A Monthly Amazon Margin Audit Routine
Knowing the fee stack is only useful if you check it regularly. The following routine is designed to take a few focused hours each month for a typical small-to-mid-size catalog, longer for larger ones.
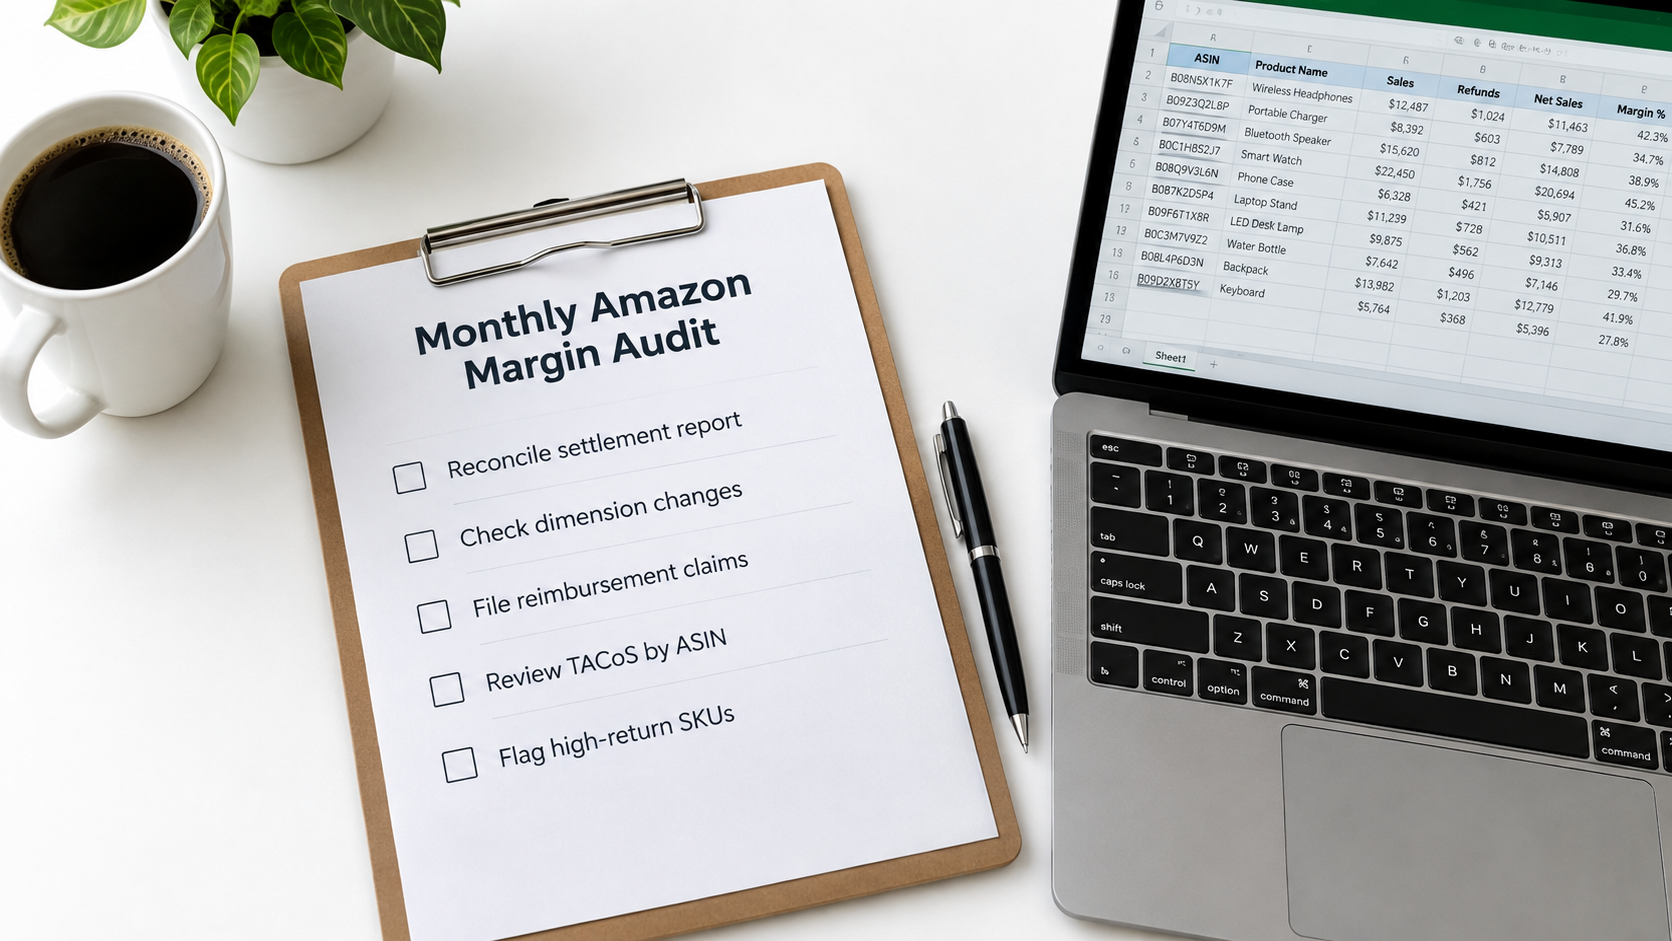
Step 1: Reconcile the settlement reports
Start with the money. Download the month’s settlement and transaction reports and group charges by type: referral fees, fulfillment fees, storage, surcharges, inbound placement, returns-related charges, advertising and promotions. Compare each category with the previous month and the same month last year. Any category growing faster than revenue needs a closer look.
Step 2: Check fee per unit by SKU
For your top SKUs by revenue, calculate the actual fulfillment fee per unit and compare it with the expected fee based on verified dimensions. Flag any SKU where the fee changed without a matching change in packaging. That’s your list for remeasurement requests.
Step 3: Review inventory health
Look at days of supply for each SKU and at your account-level storage utilization. Ask three questions:
- Which SKUs are at risk of falling below the low-inventory threshold in the next 30 days?
- Which SKUs are approaching the aged inventory window?
- Is account-wide weeks of supply moving toward the utilization surcharge trigger?
Turn the answers into replenishment orders, removal orders or targeted promotions.
Step 4: Audit returns
Pull the returns report and sort SKUs by return rate. For anything with a rising return rate, or one near the category threshold, read the return reasons and recent customer reviews. Then decide on one concrete fix: a listing update, a packaging change, a supplier quality conversation or a sizing chart. Also check that refunded orders have matching returns received, and file reimbursement requests where they don’t.
Step 5: File reimbursement claims
Review inventory adjustments for lost and damaged units, check inbound shipment discrepancies, and file any claims still inside their eligibility windows. Track how much you recover each month. Over a year it’s often a figure worth knowing.
Step 6: Review advertising against margin
For each major SKU, compare the month’s TACoS with its pre-advertising margin. Flag any SKU where advertising takes up so much of the margin that contribution is thin or negative. Decide whether that’s a deliberate investment, such as a launch or a ranking push with an end date, or a leak that needs bids and budgets cut.
Step 7: Update the waterfall
Finally, update the contribution margin waterfall for each top SKU with the month’s actual figures. Rank SKUs by contribution margin in dollars, not revenue. Most catalogs follow a familiar pattern: a small number of products make most of the contribution, and a long tail adds complexity, storage and risk while contributing little. That ranking should guide where you spend time, inventory budget and ad dollars next month.
Make the routine stick
The audit only works if it happens every month. Put it on the calendar, give it to one owner, and keep a simple log of what you found and fixed. Over time the log becomes a record of how your fee stack behaves. It also makes the next annual rate card change much easier to model, because you’ll already know which layers affect your business most.
Preparing for the Next Rate Card Change
Amazon’s fee structure keeps changing. New fees appear, existing ones are adjusted, and occasionally fees are cut or restructured. Sellers who handle these changes best are the ones whose unit economics are already mapped.
Build a scenario model
Once you have a waterfall for each top SKU, you can test scenarios. What happens if fulfillment fees rise by a set amount per unit? If referral rates change in your category? If storage gets more expensive? Running these scenarios ahead of time shows you which products have room to absorb increases and which are already on the edge.
Know your pricing power
When fees rise, sellers have three basic options: absorb the increase, raise prices, or cut costs elsewhere. Which option makes sense depends on your competitive position. Products with strong reviews, brand recognition and few close substitutes can usually pass on some of the increase. Commodity products in crowded categories usually can’t.
Knowing in advance which of your products fall into which group means you won’t be scrambling when an announcement lands.
Diversify thoughtfully
Some sellers respond to fee pressure by adding sales channels: their own website, other marketplaces, wholesale or retail. Diversification can lower dependence on one platform’s fee decisions. It also adds its own costs and complexity. The same contribution margin discipline applies to every channel. A new channel only helps if its unit economics work.
Watch announcements closely
Amazon typically announces major fee changes through Seller Central news and its fee update pages, often a month or more before they take effect. Read the full announcements, not just summaries. Exemptions, thresholds and timing details often decide whether a change affects you a lot or barely at all.
Conclusion: Manage the Stack, Not Just the Sales
Amazon remains one of the largest and most accessible sales channels available to brands and independent sellers. Selling there profitably, though, now depends less on growing revenue and more on managing a layered fee structure where your own decisions change what you pay.
Referral fees and fulfillment fees set the baseline. Inventory fees reward accurate forecasting and penalize both overstocking and running lean. Inbound placement fees turn shipping decisions into margin decisions. Returns processing fees put a price on listings that set the wrong expectations. Advertising, unless it’s managed against margin, can quietly take whatever is left.
Key takeaways
- Track contribution margin per unit, not just revenue. Build a full waterfall for every top SKU and update it monthly.
- Design packaging around size tiers. Small dimension changes can lower fulfillment fees on every unit for the life of the product.
- Manage inventory inside the healthy band. Stay above the low-inventory threshold on fast movers and below the utilization surcharge trigger account-wide.
- Run the inbound comparison. Compare placement fees with freight costs for each shipment instead of defaulting to one option.
- Treat returns as product feedback. Fixing listing accuracy and quality lowers costs and keeps products under returns processing thresholds.
- Put advertising in the margin. Use TACoS and break-even ACoS to make sure ad spend is a deliberate investment, not a leak.
- Audit for hidden leaks. Reconcile shipments, check fee-per-unit changes and file reimbursement claims within their windows.
- Verify every figure against the current rate card. Fees change, and decisions based on last year’s numbers can be expensive.
The sellers who do well over the long run are rarely the ones with the biggest revenue numbers. They’re the ones who know, for every product, what they keep from each sale and why. Build that visibility first, and every other decision, from pricing to inventory to advertising, gets easier to get right.