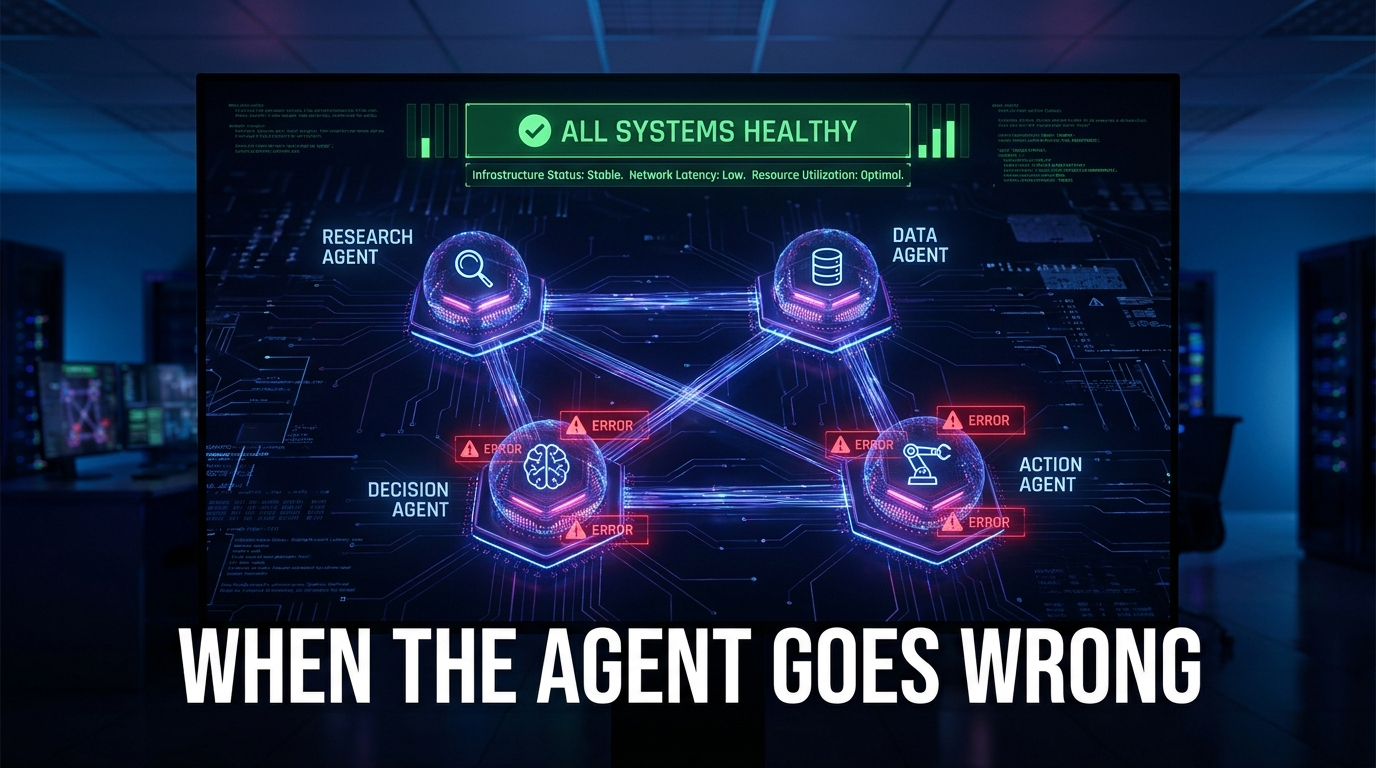
Your AI agent just processed 400 customer support tickets. Your Datadog dashboard is green. Latency is nominal. The API returned HTTP 200 on every single call. And somewhere in that queue, 47 customers received wrong refund amounts, three accounts got escalated to collections they didn’t belong in, and one enterprise client’s entire order history was flagged for fraud review.
Nobody noticed for six hours.
This is the central problem of AI agent observability in 2026: the signals that tell you a system is healthy are not the same signals that tell you a workflow is working. Traditional application monitoring was built to catch infrastructure failures — crashes, timeouts, error codes. It was never designed to catch an agent that confidently, fluently, and completely incorrectly completed a business task.
The gap between “the infrastructure is fine” and “the business outcome is correct” is precisely where enterprise AI deployments are losing money, trust, and sometimes regulatory standing. According to recent analysis of production AI systems, multi-agent workflows exhibit failure rates between 40% and 85% — and the majority of those failures produce no infrastructure-level signal whatsoever.
This guide is about closing that gap. Not from a theoretical standpoint, but from the practical vantage point of teams who have deployed agents in production, discovered what breaks in ways that are invisible to conventional tools, and built the observability infrastructure to catch and fix those failures before they become business problems.
We’ll cover what agent observability actually means at each layer of the stack, the specific failure modes that should drive your instrumentation decisions, how the tooling landscape breaks down in 2026, and what it takes to build a monitoring practice that connects token-level telemetry to the business KPIs that executives actually care about.
Why Traditional Monitoring Fails AI Agents
To understand where agent observability starts, you first have to understand why classical application performance monitoring hits a conceptual wall when applied to autonomous AI workflows.
Traditional software is deterministic. Given the same input, it produces the same output. Debugging follows a clear path: a crash, a stack trace, a failed assertion, a timeout. Monitoring tools were engineered around this model. They watch for exceptions, measure latency against thresholds, count error codes, and alert when something falls outside the expected envelope. The underlying assumption is that correctness is binary and observable — either the function ran or it didn’t.
The Determinism Assumption Breaks Down Entirely
AI agents shatter this assumption at every level. An agent is probabilistic by design. Its reasoning path, tool selections, and outputs vary even for identical prompts. The same customer support query, submitted twice, may produce two different resolution paths — both of which the infrastructure reports as successful HTTP calls, but only one of which actually resolves the customer’s issue correctly.
This means traditional monitoring captures a fundamentally different question than what enterprises need to ask. Traditional APM asks: Did the system execute? Agent observability must ask: Did the agent accomplish the right business outcome, in the right way, within acceptable cost and risk boundaries?
These are not variations on the same question. They require entirely different signal types, evaluation methods, and alerting logic.
The “Green Light” Paradox in Production
The practical consequence is what practitioners have started calling the “green light” paradox: your entire observability stack can show nominal health while agents are generating systematically wrong outputs. Consider a few concrete scenarios:
- Hallucinated tool arguments: An agent calls your inventory management API with a valid API signature but incorrect item IDs derived from a hallucinated reasoning step. The API returns 200. The inventory record is now wrong. APM: all green.
- Plausible but incorrect summarization: An agent summarizes a legal document for an analyst, omitting a key liability clause — not because it crashed, but because it assigned low relevance weight to that section. The task completes. APM: all green.
- Context window truncation: In a multi-step workflow, context from step 3 is silently dropped when the agent’s context window fills, causing step 7 to make a decision based on incomplete information. No error is thrown. APM: all green.
In each case, the business has incurred a real cost — incorrect data, missed risk, bad decision — and the monitoring layer has no mechanism to detect it. This is the foundation problem that modern agent observability is designed to solve.
What Agent Observability Actually Means
Agent observability is not simply “more logging.” It’s a structural expansion of what we consider observable about a running system — one that adds behavior, quality, reasoning, and business alignment as first-class monitoring dimensions alongside the traditional infrastructure signals.
A mature agent observability architecture captures signals across five distinct layers, each of which addresses a different class of failure:
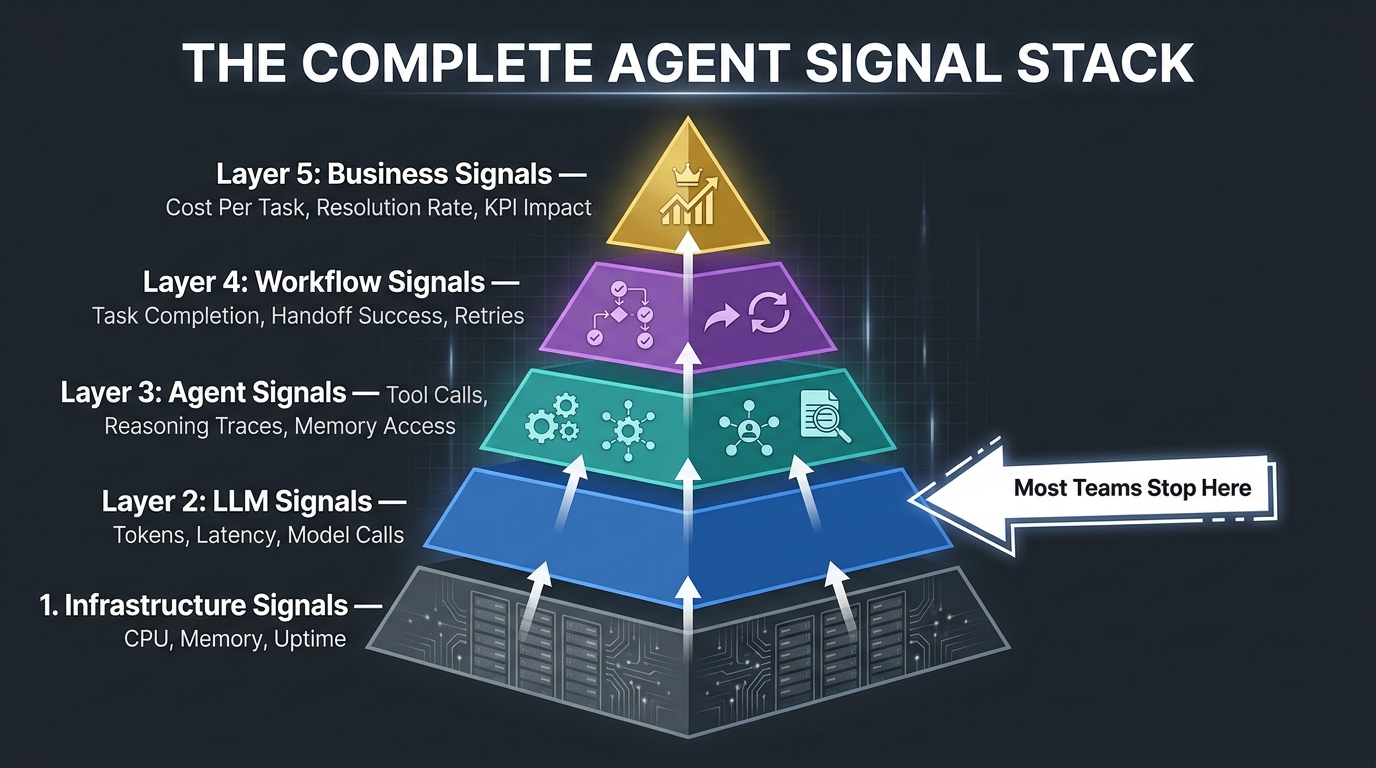
Layer 1: Infrastructure Signals (Necessary but Insufficient)
CPU, memory, network latency, uptime, error rates — the classic APM metrics. These remain essential. An agent that can’t reach its tool APIs, that’s running hot on memory due to context bloat, or that is hitting rate limits on model calls needs to be caught at this layer. The mistake is treating this layer as sufficient.
Layer 2: LLM Signals
Token consumption (input and output), per-request cost, model response latency (including time-to-first-token), prompt and response metadata, temperature settings, and model version. This layer is where most teams stop — and it’s still only halfway to useful observability. Knowing that a call consumed 4,200 tokens tells you nothing about whether the output was correct.
Layer 3: Agent-Level Signals
This is where agent observability begins to diverge meaningfully from LLM monitoring. Agent signals capture the full decision trace: which tools were called, in what order, with what arguments, and what the tool returned. They capture memory access and retrieval operations — what was fetched from a vector store and whether it was relevant. They capture reasoning steps as structured spans, not just as unstructured logs.
Critically, this layer needs to expose what the agent was trying to do, not just what it executed. The intent-action gap — the difference between the agent’s stated reasoning and its actual tool calls — is a strong predictor of downstream failures.
Layer 4: Workflow Signals
When multiple agents collaborate on a business task, the interaction between them becomes a signal source in its own right. Workflow signals include handoff success rates (did the receiving agent have the full context it needed?), retry counts per task step, branching logic outcomes, and inter-agent communication traces. This layer is where multi-agent systems most commonly fail invisibly.
Layer 5: Business Signals
Task completion rates, cost per successful resolution, time-to-action, downstream business KPI impact, policy compliance rates, and human escalation frequency. This is the layer most enterprises are still missing entirely — yet it’s the layer that actually tells you whether your agent deployment is delivering business value or destroying it. Every alert and metric at layers 1–4 should ultimately tie back to a business signal at layer 5.
The Four Failure Modes That Demand Your Attention
Understanding what to observe requires understanding what breaks. Multi-agent business workflows in 2026 fail in characteristic patterns that have become well-documented enough to design specific detection strategies around. These four failure modes account for the overwhelming majority of silent production failures in enterprise deployments.
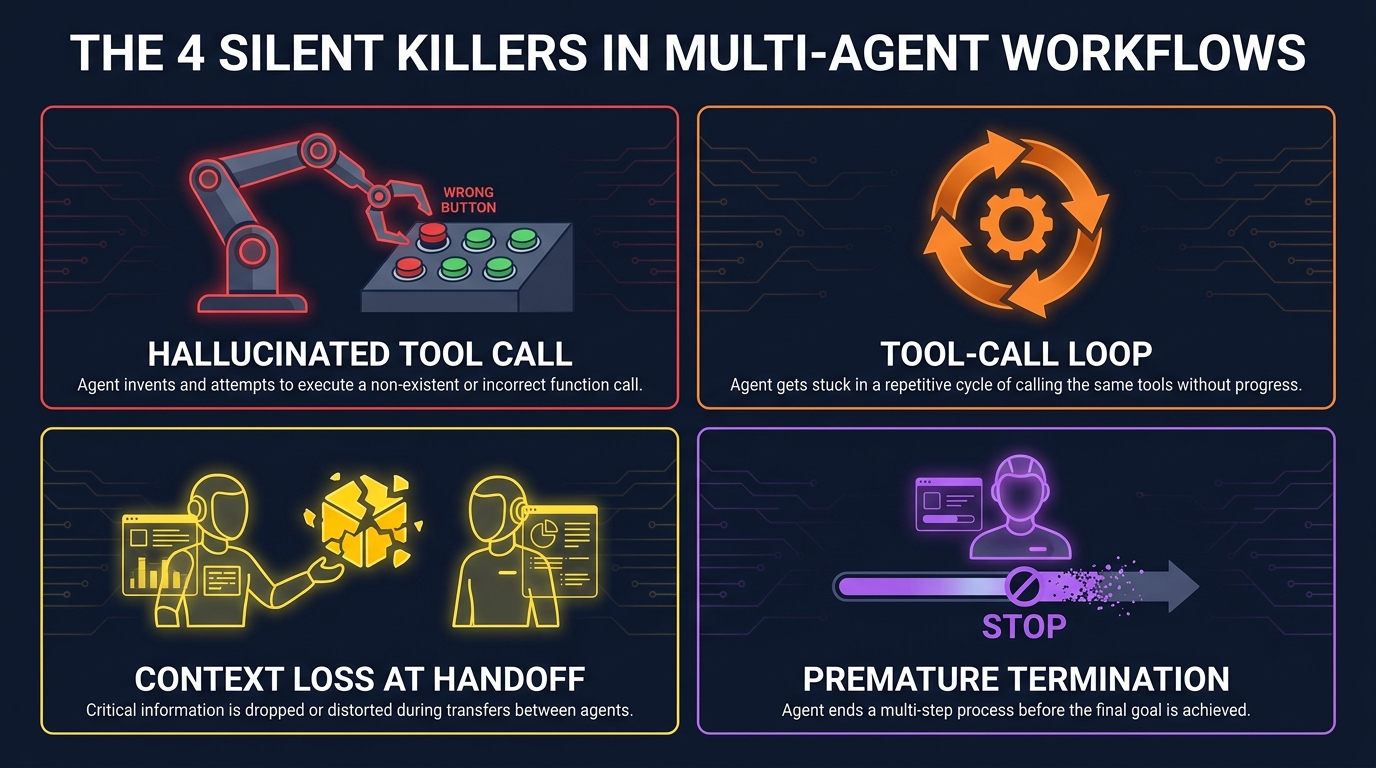
Failure Mode 1: Hallucinated Tool Calls
An agent calls a real tool with fabricated or incorrect arguments. The tool executes successfully — it processed the request the agent sent — but the request itself was wrong. This is the most insidious failure mode because every downstream system reports success. The tool call logged as successful. The API returned a valid response. The agent continued confidently.
Detection strategy: Instrument tool call arguments as structured spans and run argument validation checks against expected schemas and known-good value ranges. For high-stakes tools (anything that writes to a database, sends external communications, or initiates financial transactions), implement a pre-execution policy check that scores argument plausibility before allowing execution. Log the agent’s stated reason for the tool call alongside the call itself — divergence between reason and argument is an early warning sign.
Failure Mode 2: Tool-Call Loops
An agent enters a retry cycle — repeatedly calling the same tool or sequence of tools — because it cannot satisfy its own evaluation criteria for task completion. Unlike an infinite loop in traditional software, which tends to spike CPU and get caught by resource monitors, a tool-call loop can run at normal resource levels while silently consuming tokens and API budget. In customer-facing applications, a looping agent also introduces latency that degrades user experience long before any infrastructure alert fires.
Detection strategy: Implement step-count limits per task span and track the ratio of unique tool calls to total tool calls within a session. A ratio that trends toward 1.0 (same tool being called repeatedly) is a direct signal for loop detection. Set cost-per-task budget thresholds and alert when an individual task exceeds 2x its rolling median cost — runaway loops almost always surface here before they surface in latency metrics.
Failure Mode 3: Context Loss at Handoff
In multi-agent architectures, one agent’s output becomes the next agent’s input. If that handoff is lossy — due to context window limits, summarization errors, or schema mismatches between agents — the receiving agent starts from a degraded information state. It will behave normally given what it knows. It just doesn’t know everything it needs to know. The failure is invisible at both the sending and receiving agent level individually.
This failure mode is particularly dangerous because it produces outputs that are coherent and plausible — not obviously wrong. A legal review agent that never received the clause flagging function’s output will still produce a polished legal summary. It will just miss the liability clause.
Detection strategy: Instrument every inter-agent handoff as an explicit span with a “context completeness” score — a lightweight check that verifies required context fields are populated and above minimum content thresholds before the receiving agent begins. For structured workflows, define a context schema that all handoffs must conform to, and treat schema validation failures as critical alerts regardless of whether the downstream agent proceeds successfully.
Failure Mode 4: Premature Termination
An agent decides its task is complete before it actually is, either because it over-satisfies a termination condition or because it incorrectly evaluates its own output as sufficient. This is a quality failure, not an execution failure — the agent ran correctly, it just stopped at the wrong point. Traditional monitoring has no concept of “the agent should have done more.”
Detection strategy: Implement outcome-based evaluation that checks the agent’s final output against task success criteria — not just whether the agent declared completion, but whether the output meets independently defined quality standards. For known task types, maintain a suite of golden examples and measure output similarity. Significant divergence from expected completion patterns should trigger human review, not silent acceptance.
Multi-Agent Handoffs: The Hardest Observability Problem
Single-agent observability is tractable. You have one reasoning chain, one tool call trace, one output to evaluate. Multi-agent workflows — where an orchestrator distributes work across specialized sub-agents — multiply the complexity exponentially.
The core challenge is trace continuity. When Agent A completes its work and passes context to Agent B, you need a single correlated trace that spans both agents, capturing not just what each agent did but the state of the handoff itself. Without trace continuity, you cannot reconstruct the causal chain that led to a bad outcome. You know the final output was wrong. You don’t know where in the chain the failure was introduced.
Distributed Tracing for Agent Networks
The emerging best practice — now codified in OpenTelemetry’s GenAI semantic conventions — is to treat each agent invocation as a span within a parent workflow trace, with explicit parent-child span relationships that survive agent handoffs. Each agent span should carry:
- The task specification it received (not just the final prompt, but the structured task definition)
- Its full tool call sequence with arguments and responses
- Its reasoning trace (available as structured events in frameworks that support it)
- The context it produced for downstream agents
- An explicit completion signal (task complete / task failed / task partially complete)
With this structure, a failure in the final agent’s output can be traced backward through the span tree to identify exactly which upstream agent introduced the degraded information — and at which specific step within that agent’s execution.
The Role of Session Replay
Several observability platforms now offer session replay for agent workflows — the ability to re-run a historical trace against a new model version or updated prompt to compare outputs side by side. This is valuable for post-incident analysis (why did this specific customer’s ticket fail on Tuesday?) and for regression testing before model or prompt changes. Think of it as the equivalent of browser session replay, but for agent decision trees.
When evaluating observability tooling, session replay capability should be a key criterion for any team running multi-agent workflows in production. The ability to say “show me exactly what this agent saw, decided, and did at 2:14pm on Tuesday” is the difference between actionable debugging and guesswork.
The 2026 Tooling Landscape: What’s Available and Who It’s For
The agent observability tooling market has matured considerably, though it remains fragmented by use case and stack preference. As of mid-2026, the primary platforms segment cleanly around framework affinity, self-hosting needs, evaluation rigor, and existing infrastructure investment.
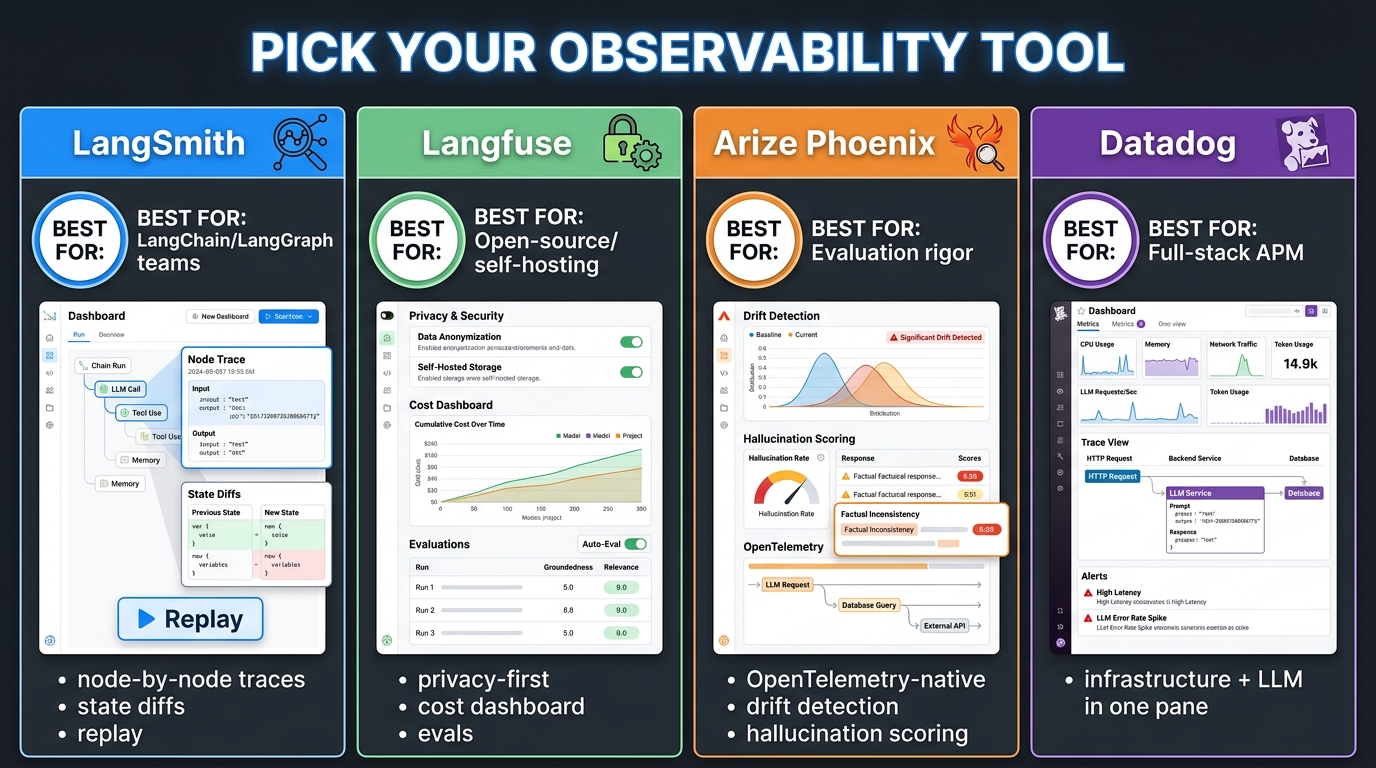
LangSmith: Deep Integration for LangChain Stacks
LangSmith is the natural choice for teams running LangChain or LangGraph architectures. Its integration depth goes well beyond surface-level tracing — it captures node-by-node execution graphs, state diffs between workflow steps, tool and model breakdowns within a single agent run, and supports replay of historical traces against updated prompt or model configurations.
Where LangSmith excels: agent debugging workflows, prompt engineering iteration, and teams who want the observability layer to be deeply coupled with their development toolchain. Where it has gaps: teams not using LangChain face significantly more friction in integration, and its infrastructure observability is limited — you’ll want a separate APM layer for the underlying system health signals.
Langfuse: The Open-Source Case for Self-Hosting
Langfuse has carved out a strong position for teams with data sovereignty requirements or cost constraints that preclude managed observability services. Its self-hostable architecture means prompt contents, reasoning traces, and output data never leave your infrastructure — a critical requirement in healthcare, finance, and public sector deployments where data residency is non-negotiable.
Beyond privacy, Langfuse has invested meaningfully in cost dashboards and evaluation pipelines, making it a practical choice for teams that need to prove ROI to finance stakeholders. Its framework-agnostic SDK means it works across diverse agent implementations without requiring a specific orchestration framework.
Arize Phoenix: Evaluation Rigor as a First Principle
Arize Phoenix is the strongest option for teams where output quality and hallucination detection are the primary observability concerns. Its OpenTelemetry-native architecture aligns with the emerging vendor-neutral standard, and its evaluation tooling — including drift detection, hallucination scoring, and retrieval quality assessment for RAG workflows — is the most mature in the category.
Teams building agents in regulated industries where output quality must be continuously measured and documented tend to gravitate toward Arize Phoenix for its ability to run automated evaluations against live production traces and feed results back into structured quality reports.
Datadog LLM Observability: When Infrastructure and AI Monitoring Must Converge
For enterprises already running Datadog as their primary APM platform, Datadog’s LLM Observability module offers the compelling advantage of collapsing the agent monitoring and infrastructure monitoring layers into a single pane of glass. The ability to correlate a spike in agent task failures with an upstream API rate limit event — in the same dashboard, with unified alerting — has real operational value.
The trade-off: Datadog’s agent-level tracing depth doesn’t match what specialist platforms like LangSmith or Arize offer. It’s the right choice when the priority is operational simplicity and cross-system correlation, not maximum debugging depth for agent reasoning chains.
The Two-Layer Pattern Most Production Teams Use
Increasingly, mature production deployments run a two-layer observability stack: a specialist LLM/agent platform (LangSmith, Langfuse, or Arize) for reasoning traces and quality evaluation, combined with an infrastructure APM (Datadog, New Relic, or Grafana) for system health. The specialist platform handles what the agent was thinking; the APM handles what the infrastructure was doing. These two views, linked by a shared trace ID, give engineering and operations teams the complete picture.
OpenTelemetry and the Road to a Vendor-Neutral Standard
One of the most consequential developments in agent observability over the past 12 months has been the rapid advancement of OpenTelemetry’s GenAI Semantic Conventions — an attempt to define a vendor-neutral schema for everything an AI agent emits as telemetry.
The stakes are significant. Without a common standard, every observability platform uses its own proprietary schema for representing agent actions, tool calls, and reasoning traces. This creates vendor lock-in, makes cross-platform correlation difficult, and fragments the tooling ecosystem in ways that slow down adoption.
What the GenAI Semantic Conventions Cover
The OpenTelemetry GenAI SIG began in April 2024 and has expanded scope substantially since. As of mid-2026, the specification covers six layers of agent telemetry:
- Client/Model layer: LLM API calls, token counts, latency, model metadata
- Agent/Workflow layer: Agent invocations, task spans, reasoning steps
- Tool/MCP layer: Tool calls, arguments, responses, execution status
- Events layer: Structured semantic events for prompts, responses, and reasoning traces
- Metrics layer: Aggregated signals for cost, latency distributions, and quality scores
- Provider-specific extensions: Hooks for model-specific metadata that doesn’t fit the generic schema
Critically, the specification is still marked Development — not yet Stable — as of mid-2026. This means the schema is still evolving, particularly around multi-agent orchestration semantics and the MCP (Model Context Protocol) integration layer. Teams instrumenting agents today should expect to update their telemetry schemas as the spec stabilizes.
Why It Matters for Your Architecture Decisions
Despite its development status, OpenTelemetry’s GenAI conventions are already being adopted by Datadog, Honeycomb, Grafana, and a growing set of agent frameworks. Building your instrumentation against this standard — rather than a proprietary platform schema — significantly reduces future migration costs and opens the door to correlation across observability tools that may use different backends.
The practical guidance for teams instrumenting agents in 2026: use OpenTelemetry SDK instrumentation as your base layer, emit spans and events conforming to the GenAI semantic conventions, and route telemetry to whichever backend suits your current needs. The separation of instrumentation from backend means you can evolve your tooling choices without re-instrumenting your agents.
Building a Dashboard That Tells You Something Useful
An agent observability dashboard that only shows CPU usage, API response times, and token counts is doing the bare minimum. A useful dashboard connects technical signals to business outcomes, making it readable by both engineers debugging a workflow and executives asking whether the AI deployment is delivering value.
The Core Metric Categories
A practical agent observability dashboard for a business workflow should include metrics in four categories:
1. Cost Efficiency Metrics
- Cost per successful task completion: Not cost per API call, but cost per business outcome. This is the fundamental economic unit for agent deployments. Human-handled task resolution in customer service runs approximately $5–$12 per resolution; AI agent resolution should target significantly below that threshold, and this metric tells you when it’s drifting.
- Retry cost ratio: The fraction of your total token spend attributable to retries and loops. High retry cost ratios (above 15–20% of total task spend) indicate systematic agent confusion on certain task types.
- Cost per agent per task type: Breaking down costs by individual agent and task category reveals which parts of your workflow are disproportionately expensive and where optimization attention is warranted.
2. Quality and Outcome Metrics
- Task completion rate by category: What percentage of tasks in each category reach a successful defined completion state vs. failing, looping, or requiring human escalation?
- Hallucination rate: Measured by automated evaluation against known-good outputs or LLM-as-judge scoring on production traces. This is not easy to measure at scale, but it is increasingly non-optional for production deployments.
- Human escalation rate: When agents route tasks to humans, that’s a real signal. A rising escalation rate on a previously stable task category is often an early indicator of model drift or prompt regression.
2. Latency and Reliability Metrics
- End-to-end task latency (p50, p95, p99): Total time from task receipt to completion, not just individual API call latency. A task involving six sequential agent steps can have acceptable per-step latency but unacceptable end-to-end latency.
- Tool call success rate per tool: Which external tools or APIs are most frequently failing, returning unexpected responses, or timing out? Failures here create cascading effects upstream in the agent reasoning chain.
4. Governance and Risk Metrics
- Policy compliance rate: What fraction of agent outputs pass your defined content and action policies?
- Sensitive data access events: How often are agents accessing PII, financial data, or other protected data classes, and is that access within sanctioned boundaries?
- Anomalous behavior alerts per day: The aggregate count of flagged behaviors — argument anomalies, unusual tool call sequences, deviation from expected workflow paths.
Alerting Philosophy for Agent Workflows
Static threshold alerting — alert when task completion rate drops below 90% — is a starting point, not a finish line. Agent workflows are stateful and contextual: completion rates naturally vary by task type, time of day, and input complexity. The more valuable alerting approach uses rolling statistical baselines per task category and alerts on meaningful deviation from that baseline rather than fixed absolute thresholds. A sudden 15% drop in completion rate for a specific task type at 2am on a Wednesday is signal; a 5% drop during a high-volume period for a complex task type may be entirely within normal variance.
Governance, Audit Trails, and Regulated Industries
For organizations in financial services, healthcare, insurance, and legal services, agent observability is not primarily a performance engineering concern — it is a compliance and risk management requirement. Regulators in 2026 are increasingly explicit: if an AI agent takes an action that affects a regulated process, you need to be able to reconstruct exactly what the agent was instructed to do, what it decided, what data it accessed, and why it reached the outcome it reached.
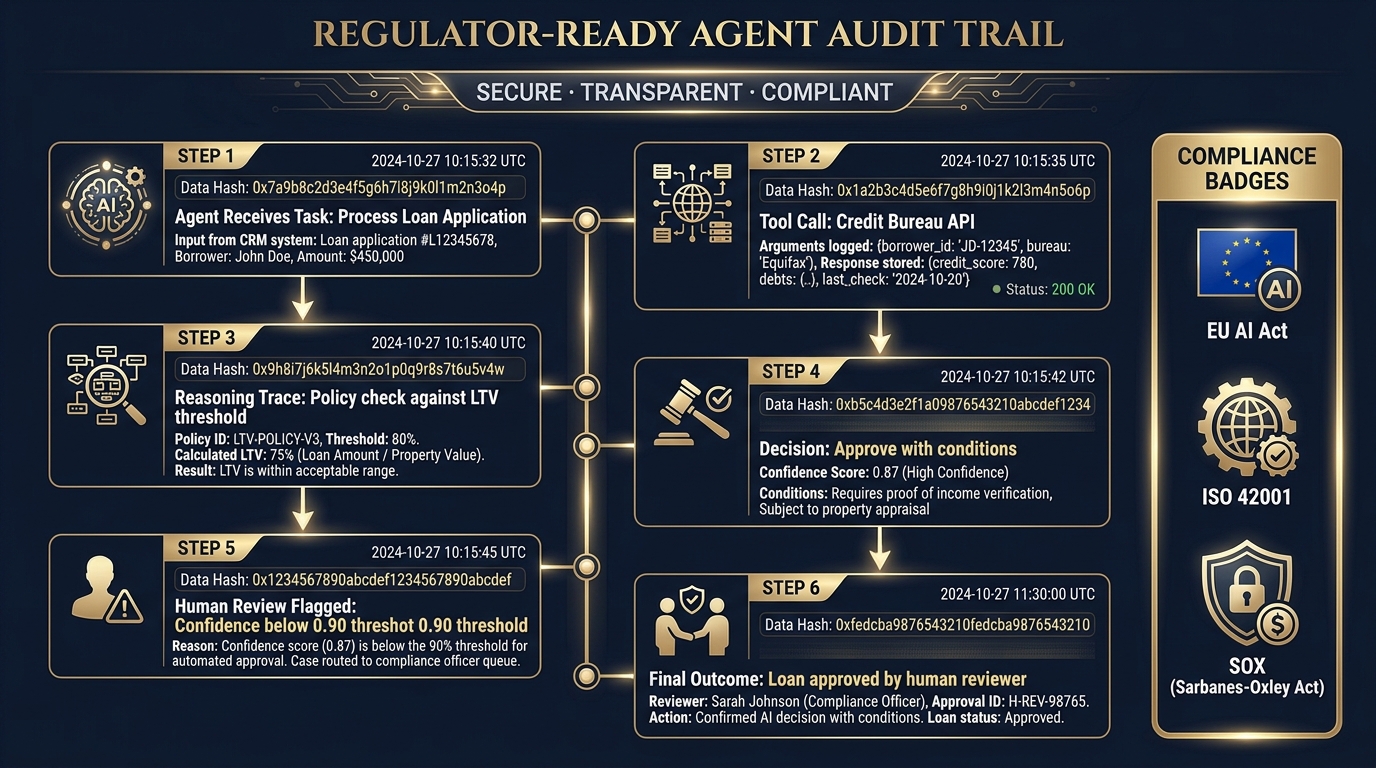
What a Regulator-Ready Audit Trail Contains
A compliance-grade agent audit trail goes beyond what most standard observability traces capture. Each auditable agent action should include:
- Immutable timestamp and trace ID: Cryptographically verifiable, not just logged. The record must demonstrate it has not been altered after the fact.
- Task specification and source: The exact instructions the agent received, from which system, and authorized by whom.
- Data accessed and data provenance: A structured record of every data source the agent retrieved from, including which records, which fields, and under what authorization context.
- Decision rationale: For consequential decisions (approvals, denials, escalations), the agent’s stated reasoning trace, not just its final output.
- Human review events: Where and when a human reviewed, approved, modified, or overrode agent outputs — essential for demonstrating meaningful human oversight under frameworks like the EU AI Act.
- Output hash: A hash of the final output, enabling downstream systems to verify they received the output the agent produced without modification.
Regulatory Frameworks Driving This Requirement
Several converging regulatory frameworks are making this non-negotiable for enterprises in regulated sectors. The EU AI Act’s high-risk AI provisions explicitly require technical documentation and logging of AI system behavior. ISO 42001 (the AI management system standard) includes observability requirements as part of its governance framework. FINRA has signaled increasing scrutiny of AI-assisted financial advice workflows. HIPAA guidance on AI in healthcare workflows is being updated to address autonomous agents that access patient records.
Organizations that build their observability stack with compliance-grade audit trail requirements from the start are significantly better positioned than those who try to retrofit compliance logging onto an existing lightweight observability setup. The instrumentation required for debugging is useful but not sufficient for compliance; the additional requirements (immutability, structured data provenance, human review events) need to be deliberate architectural decisions.
The Centralized Agent Inventory Requirement
One underappreciated compliance requirement emerging in regulated industries is the need for a centralized inventory of deployed agents — not just their technical configuration, but their authorized scope, data access permissions, human oversight requirements, and risk classification. Without a centralized registry, organizations often discover they cannot answer the basic auditor question: “Show me every AI agent that had access to customer financial data in Q1.” Agent observability infrastructure that includes a registry layer makes this question trivially answerable; without it, the answer typically involves months of manual investigation.
Continuous Evals in CI/CD: Making Observability Shift Left
The most mature observability practices don’t just monitor agents after deployment — they integrate evaluation into the development and deployment pipeline, catching regressions, hallucination rates, and policy violations before they reach production. This is the “shift left” principle applied to AI agent quality.
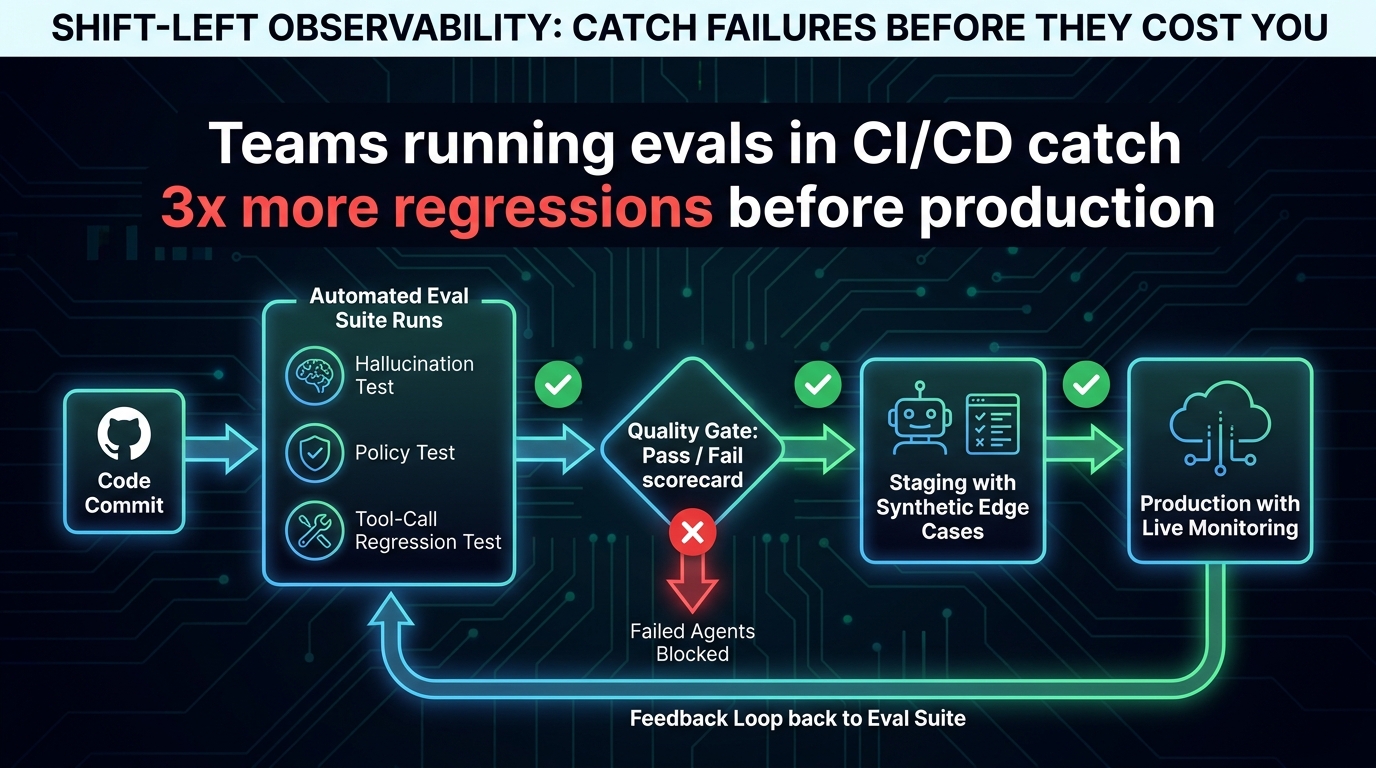
What an Agent Eval Suite in CI/CD Looks Like
Embedding evaluations into CI/CD for agent workflows requires moving beyond unit tests of individual functions to end-to-end behavioral tests of agent actions. A production-grade agent eval suite in CI/CD should cover:
Regression tests on golden traces: A library of historical production traces — both successful and failed — replayed against the new prompt or model version. Outputs are compared to the expected golden output using automated similarity scoring. Significant divergence triggers a pipeline block.
Hallucination stress tests: Synthetic prompts designed to elicit hallucination — ambiguous queries, high-pressure task specifications, inputs with deliberately seeded incorrect facts — evaluated against a hallucination scoring model. New model versions that show elevated hallucination rates on the stress test don’t proceed to production.
Policy and safety tests: Automated evaluation of agent outputs against your defined content policies, action boundaries, and safety rules. This is especially important for agents that have write access to external systems — a policy test that confirms the agent won’t execute unauthorized actions is a pre-deployment gate, not a post-deployment alert.
Edge case library: A curated set of edge cases derived from production monitoring — unusual inputs that previously caused failures, rare but high-stakes task types, inputs that approach the agent’s documented capability boundaries. This library grows over time as production observability surfaces new failure patterns.
The Feedback Loop from Production to Eval
The virtuous cycle of mature agent observability is that production monitoring feeds the CI/CD eval suite. When a production trace reveals a new failure pattern — a previously unseen hallucination trigger, a tool call argument anomaly on a specific input type — that trace is curated into the eval library. The next time a model or prompt change is proposed, that failure pattern is part of the automated regression test suite. The production environment becomes a continuous source of test cases, and the eval suite becomes progressively more representative of real-world agent behavior.
This feedback loop requires deliberate tooling to operationalize. Platforms like LangSmith and Langfuse both support workflows for “send this trace to the eval dataset,” making it possible to curate production failures into test cases with minimal friction. The engineering investment in building this pipeline is one of the highest-ROI observability decisions a team can make — it directly reduces the rate at which novel production failures catch teams by surprise.
Quality Gates and Deployment Policies
An eval suite is only as useful as the enforcement mechanism around it. Mature teams define explicit quality gates — minimum task completion rate, maximum hallucination rate, zero tolerance for policy violations on defined safety tests — and treat these as hard deployment blocks, not advisories. A prompt change that improves average task completion rate by 3% but causes a previously passing policy test to fail should not deploy. The policy test exists precisely because the cost of that failure in production is higher than the cost of blocking the deployment.
The Business Case: Connecting Observability Investment to Financial Outcomes
Observability infrastructure is not free. It requires engineering investment, platform licensing, storage for trace data, and ongoing maintenance of eval suites and dashboards. For teams building the internal case for this investment, the ROI argument has three distinct components.
Direct Cost Avoidance from Failure Detection
The clearest ROI signal is cost avoidance: agent failures that are caught by observability before they become business incidents. Consider the cost structure: a hallucinated tool call that writes incorrect data to a customer record requires human review to identify (if it’s detected at all), manual correction, potential customer communication, and in regulated industries, possible regulatory reporting. The per-incident cost of undiscovered agent failures in business-critical workflows routinely runs into thousands of dollars when fully accounted for. Observability that catches these failures in real time — or better, in pre-production eval — converts high-cost downstream incidents into low-cost upstream fixes.
Token Cost Optimization
Detailed agent-level cost tracking consistently reveals optimization opportunities that are invisible without granular visibility. Token cost monitoring at the task and agent level regularly uncovers inefficiencies: prompts that are dramatically longer than necessary, tool call sequences that request the same information multiple times, retry loops that consume disproportionate token budget. Teams with detailed cost-per-task monitoring typically identify 20–35% reduction opportunities in their token spend within the first 60 days of instrumentation — purely from prompt optimization and loop prevention that observability makes visible.
Confidence in Scaling
Perhaps the least financially quantified but most strategically significant benefit: observability creates the organizational confidence required to expand agent scope. Teams without strong observability tend to limit agent deployment to low-stakes tasks because they have no mechanism to verify that higher-stakes deployment is safe. Teams with mature observability — high-quality traces, eval suites, audit trails — can present leadership and risk committees with evidence-based cases for expanding agent autonomy into higher-value workflows. The observability investment is what converts AI agent deployment from a controlled experiment into a scalable operational capability.
An Implementation Roadmap: Where to Start
For teams currently running agents with minimal observability, the path from “we have some logs” to “we have production-grade agent observability” is achievable incrementally. The following sequence prioritizes by impact and implementation cost:
Phase 1: Instrument for Visibility (Weeks 1–4)
Begin with the OpenTelemetry SDK and whichever agent observability platform best matches your stack (see tooling section above). Instrument every agent with structured spans that capture tool calls, arguments, and outputs. Connect token costs to task-level spans so you can see cost per task, not just cost per API call. Set up basic alerting on task failure rates and cost anomalies. This phase doesn’t require eval suites or audit infrastructure — just the baseline visibility that lets you see what’s happening.
Phase 2: Build Evaluation Baselines (Weeks 5–10)
Once you have production traces, begin curating a golden trace library. Select 50–100 representative successful traces and 20–30 documented failures as your initial eval dataset. Implement automated quality scoring on new production traces using LLM-as-judge or lightweight scoring models. Establish baseline metrics for task completion rate, cost per task, and human escalation rate per task category. These baselines become the reference point for detecting regressions and improvements over time.
Phase 3: Shift Evals into CI/CD (Weeks 11–16)
Integrate your eval suite into the deployment pipeline. Define quality gates. Implement the production-to-eval feedback loop so new failure patterns are automatically candidates for the test suite. At this point, your observability practice is genuinely proactive — catching failures before production — rather than purely reactive.
Phase 4: Add Governance and Advanced Analytics (Weeks 17–24)
For regulated industries, add the compliance-grade audit trail layer, centralized agent registry, and data access logging. For all teams, build the business-level dashboard layer that exposes cost per outcome, downstream KPI impact, and governance risk metrics to stakeholders outside the engineering organization. This is the layer that makes the agent observability investment visible to leadership and enables evidence-based decisions about agent scope expansion.
Conclusion: Observability Is What Makes Agents Enterprise-Grade
The most important shift in how enterprises think about AI agents in 2026 is the recognition that deployment is not completion. Getting an agent into production is the beginning of an observability problem, not the resolution of one. Autonomous systems that take real actions in real business workflows generate real consequences — and the organizations that thrive with AI agents are the ones who invest in the infrastructure to see those consequences clearly, catch failures early, and continuously improve agent behavior based on production evidence.
Traditional monitoring tells you the system is running. Agent observability tells you the system is working. In a world where the systems making business-critical decisions are probabilistic, non-deterministic, and capable of confidently wrong outputs, that distinction is the difference between an AI deployment that compounds value over time and one that quietly erodes it.
The technical components are available — OpenTelemetry conventions are standardizing the schema, specialist platforms are maturing rapidly, and the two-layer pattern of agent observability plus infrastructure APM is now well-validated in production. What determines whether an organization captures the value is whether observability is treated as a first-class engineering concern from the moment agents are deployed, rather than an afterthought bolted on after a production incident makes the gap visible.
Build for visibility before you need it. The agents that destroy business outcomes rarely announce themselves. The ones that survive long-term in enterprise workflows are the ones that are fully observable — and continuously proven to be doing what they’re supposed to do.
Key Takeaways
- Traditional APM is not sufficient for AI agents. Infrastructure health and business outcome correctness are different problems requiring different signal types.
- The five-layer signal stack — infrastructure, LLM, agent, workflow, and business — should inform every instrumentation decision. Most teams stop at layer 2.
- The four critical failure modes (hallucinated tool calls, tool-call loops, context loss at handoff, premature termination) should drive your detection strategy and alerting design.
- Multi-agent workflows require trace continuity across agent handoffs. Without correlated parent-child span trees, you cannot reconstruct the causal chain of a production failure.
- The tooling choice depends on your stack: LangSmith for LangChain teams, Langfuse for self-hosting/privacy, Arize Phoenix for eval rigor, Datadog for unified infrastructure+LLM.
- OpenTelemetry GenAI semantic conventions are the right foundation for vendor-neutral instrumentation, though the spec is still in Development status and will continue to evolve.
- Cost-per-task, not cost-per-token, is the business-relevant metric. Connect your telemetry stack to this number before anything else.
- Regulated industries need compliance-grade audit trails from day one — retrofitting them later is significantly more expensive than building them into the architecture.
- Continuous evals in CI/CD are the highest-ROI observability investment — catching failures in pre-production is orders of magnitude cheaper than catching them in production.
- The production-to-eval feedback loop is what separates teams that continuously improve from teams that continuously react to the same class of failures.