

TikTok Shop’s US gross merchandise value is projected to hit $23.4 billion in 2026 — a market that barely existed three years ago. The platform went from roughly 4,450 US seller shops in mid-2023 to well over 475,000 active shops today. That growth curve tells you two things simultaneously: the opportunity is real, and the competition is steepening fast.
In that environment, the sellers who are pulling ahead aren’t the ones with the biggest ad budgets or the most followers. They’re the ones reading the platform’s own data better than everyone else. And the single most underused piece of native data infrastructure on TikTok Shop right now is the Product Opportunities tool inside Seller Center.
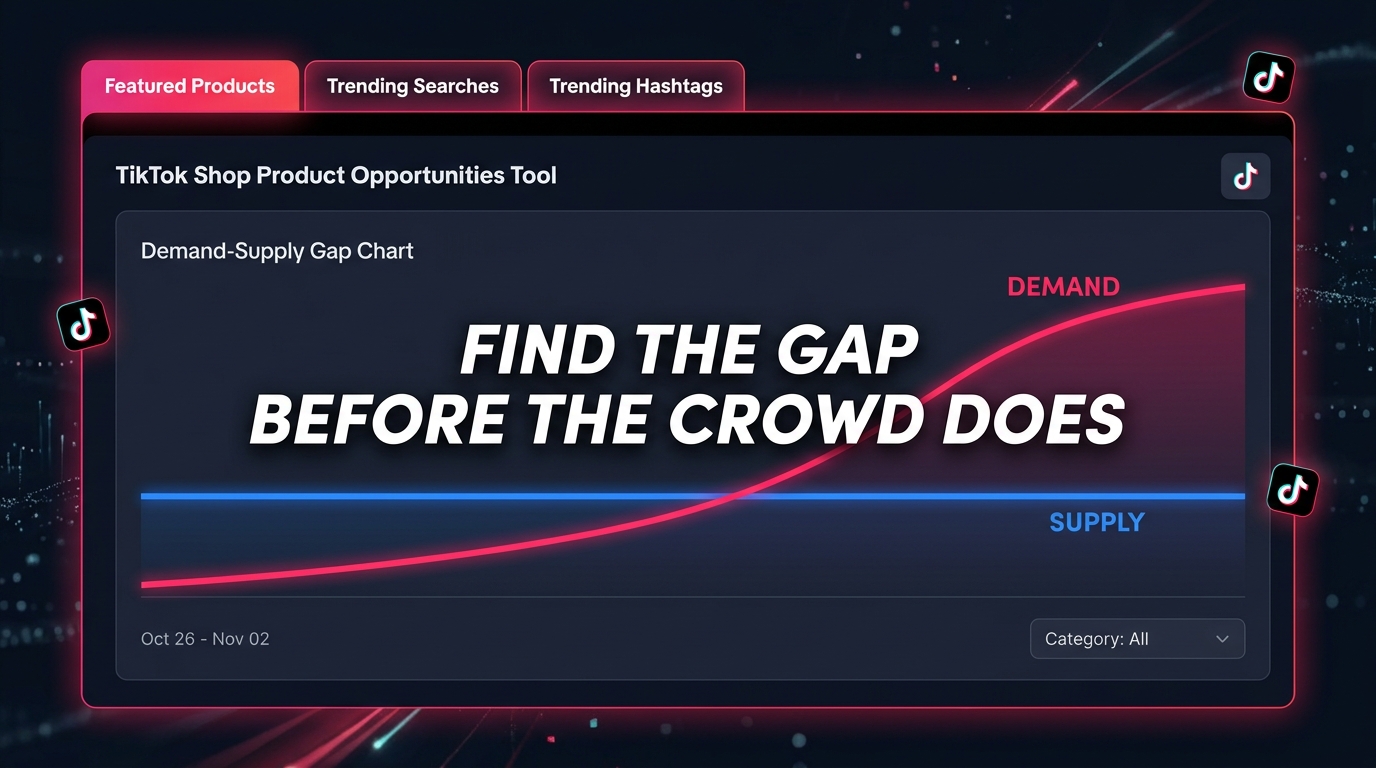
Most sellers open it once, skim the featured products list, and close it. That’s a mistake. The tool is doing something more structurally important than surfacing a trending SKU list — it’s showing you where platform-wide demand and seller-side supply are misaligned, and it’s rewarding sellers who close that gap with algorithmic visibility you cannot easily buy through ads alone.
This playbook breaks down how the tool actually works, what each data signal means in practice, how to build a decision framework around it, and where most sellers go wrong when they try to act on the data. The goal isn’t to give you a list of products to copy. It’s to give you a repeatable research system that keeps working as the platform evolves.
Why the Product Opportunities Tool Is Being Underused — and Misread
The Product Opportunities tool sits inside Seller Center → Products → Product Opportunities. It’s a default feature available to every registered TikTok Shop seller, yet most seller community discussions focus on third-party tools like FastMoss, Kalodata, or Helium 10 while treating the native tool as an afterthought.
Part of that is positioning. The tool doesn’t market itself aggressively to sellers, and TikTok’s documentation for it is sparse compared to its advertising resources. Part of it is also a genuine misread of what the tool is for. Many sellers look at it and think: “This is just a trending products list.” It isn’t.
The Confusion Between Trending and Opportunistic
Trending products on TikTok are products that are already working — they have momentum, creator coverage, and often a surge of new sellers piling in. Opportunistic products in the context of this tool are products where search and purchase intent exists on the platform but seller-side supply hasn’t caught up yet. These are two very different signals, and conflating them is where most sellers lose money.
A product trending virally on TikTok might show up in the Trending Searches tab with 300% week-on-week search growth — but if 2,000 sellers have already listed it, the opportunity has passed. Conversely, the Featured Products tab might surface a category with steady upward demand curves and only a handful of qualifying listings. That’s the actual gap the tool is designed to flag.
Why Speed Matters More Here Than on Amazon
TikTok’s commerce ecosystem runs on a faster clock than search-driven platforms. On Amazon, a keyword opportunity might stay exploitable for months. On TikTok Shop, the window between a demand signal appearing in Product Opportunities and that signal becoming saturated can be measured in days to weeks — especially in high-velocity categories like beauty and wellness.
That speed dynamic means the tool has to be part of a routine rather than an occasional check-in. Sellers who review Product Opportunities weekly and can move from signal to live listing within 48–72 hours are operating in a fundamentally different competitive position than those who check it monthly and spend two weeks onboarding a new SKU.
What the Tool Actually Shows You: A Data Anatomy Breakdown
Before you can act intelligently on Product Opportunities data, you need to understand what each metric is actually measuring — because TikTok’s labeling isn’t always self-explanatory, and some of the most important signals are displayed indirectly.
Demand Signals
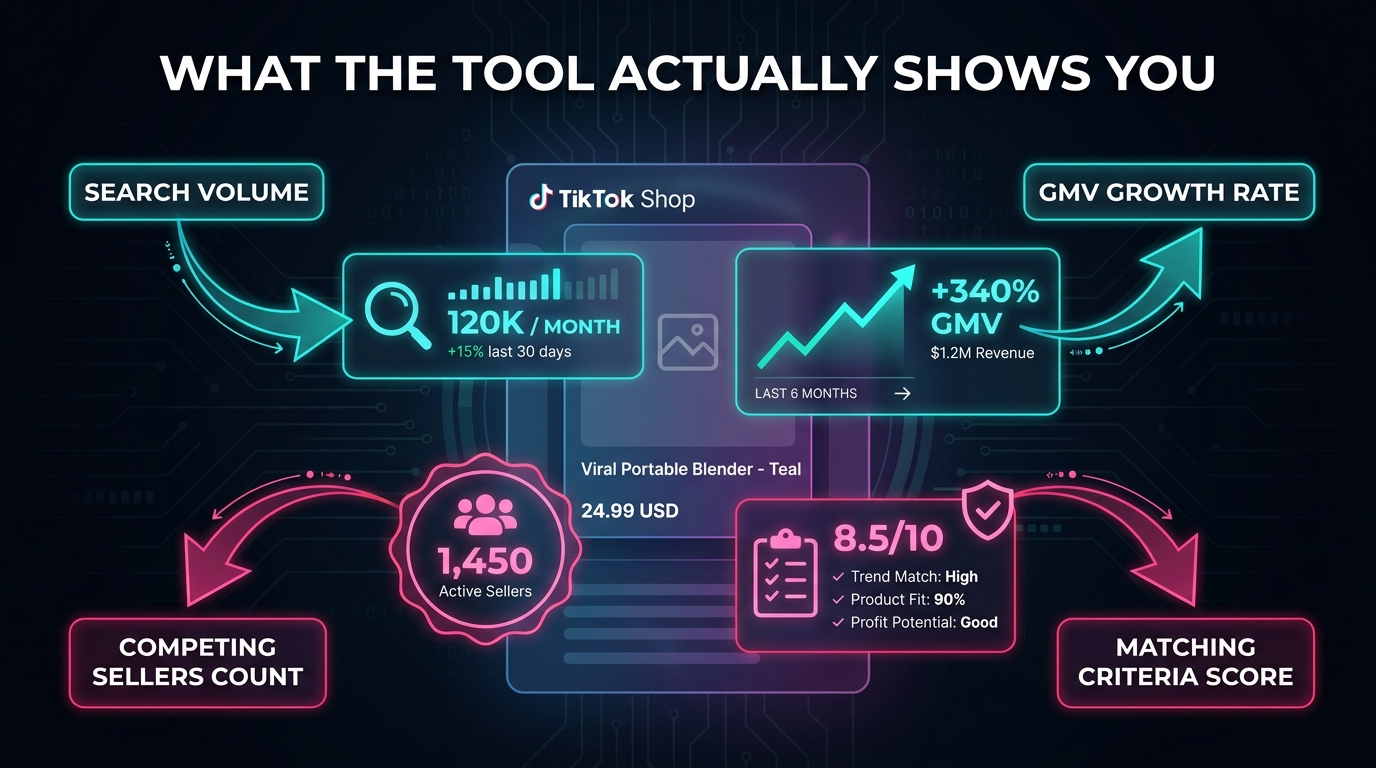
Search volume and growth rate are the most direct demand indicators. The tool surfaces keywords and product categories where TikTok’s internal search engine is seeing rising query volume. “Rising” is the operative word here — a high absolute search volume combined with a flat or declining growth rate is much less actionable than a moderate volume with a steep upward trajectory over the past 7–30 days.
GMV contribution data appears on featured product entries, showing how much gross merchandise value that product or category is generating platform-wide. This is useful for sizing the prize — you want to see GMV that is meaningful enough to support your margin targets but not so dominant that the category is already mature and defended by established sellers with review moats.
Shoppable video engagement signals underpin some of the tool’s featured product selections. Products that appear consistently in high-performing shoppable videos — measured by video watch time, click-through to product page, and add-to-cart events — get surfaced as opportunities because TikTok has validated that the product converts in a content context, not just in direct search.
Supply Signals
The supply side of the equation is where the tool is less explicit but still readable. The number of sellers actively listing in a subcategory is sometimes shown directly; in other cases, you infer it from the matching criteria requirements TikTok sets for that opportunity. When TikTok is setting lenient matching criteria (low price floor, broad specification range), it typically signals that supply is thin and TikTok wants more sellers to fill the gap. When criteria are specific and tight, the category already has coverage and TikTok is being selective about who it rewards with visibility.
The listing completeness score of existing opportunity products also tells you something. If TikTok is flagging products where existing listings have poor image quality, missing size charts, or incomplete descriptions, it’s signaling that the supply technically exists but isn’t quality-matched to demand — leaving room for a seller who enters with a properly optimized listing to rank disproportionately well.
The Three Tabs Explained: Featured Products, Trending Searches, Trending Hashtags
Product Opportunities is organized into three distinct tabs, each with a different data methodology and a different use case in your research workflow. Using them in isolation misses how they work together as a system.
Featured Products Tab
This tab is TikTok’s most curated output — a list of specific products or product categories that the platform has identified as having demand exceeding current supply. The products here are often things that are already performing well on other marketplaces (Amazon, Walmart.com, direct-to-consumer sites) but haven’t yet been listed competitively on TikTok Shop.
Think of this as TikTok telling you: “Our users are searching for this, we’re not finding great options in our shop, and we’ll reward sellers who fill the gap.” That reward is primarily algorithmic — listings created or matched through this pathway tend to receive enhanced exposure in the Shop tab feed and in search results, at least during the early window of the opportunity.
Each featured product entry includes the ability to either create a new product listing with pre-filled data (category, suggested attributes, SEO tags) or match an existing listing in your catalog to the featured opportunity. The pre-filled listing path is particularly valuable because TikTok’s suggested attributes are drawn from its own data on what buyer queries look like — meaning the product title and attribute structure you’re given is already aligned with how shoppers are searching for it.
Trending Searches Tab
Where Featured Products gives you curated product-level signals, Trending Searches gives you keyword-level demand data. This tab shows the search terms that are gaining query volume on TikTok’s internal search engine, broken down by growth trajectory and category.
The strategic use of this tab is to work backwards from search terms to products. A trending search like “magnesium glycinate gummies” isn’t just a content topic — it’s a product category signal with a specific buyer intent attached to it. Sellers who spot a rising search term in this tab and already have a qualifying product in their catalog can immediately optimize their listing title, product description, and short video content around that term before it becomes a common knowledge trend.
It’s also worth cross-referencing Trending Searches data with your existing listing performance. If a search term is rising sharply and you have a product that logically serves that query but isn’t currently ranking for it, that’s an SEO correction opportunity — not just a sourcing one.
Trending Hashtags Tab
The Trending Hashtags tab is the most content-strategy-oriented of the three. It surfaces hashtags that are gaining traction in TikTok’s video ecosystem and correlates them with commerce intent — specifically, hashtags that appear frequently in videos that drive Shop purchases, not just views.
This distinction matters because most hashtag data tools measure engagement volume. TikTok’s native tab goes a step further and identifies hashtags that correlate with purchase behavior. A hashtag with 5 million views but no purchase correlation is a content topic. A hashtag with 800,000 views and a strong purchase correlation is a commerce signal.
For sellers, the practical application is two-fold: selecting hashtags for your own content strategy, and identifying the content formats and product presentation styles that are converting well in a given trending topic, so you can brief creators or produce your own videos that slot into an already-proven buyer journey.
How Matching Criteria Work — and Why They’re More Consequential Than They Look
Every featured product opportunity in the tool comes with a set of matching criteria — specific requirements your listing must meet to qualify as a match and receive the associated visibility boost. Most sellers glance at these criteria, decide whether they can meet them, and move on. That’s treating them as a compliance checkbox when they’re actually a strategic signal.
What Matching Criteria Tell You About the Opportunity
TikTok sets matching criteria based on what it knows about the demand it’s trying to serve. Price range requirements tell you what buyers in this opportunity are willing to spend — and therefore what margin structure is viable for entry. Specification requirements (material, size range, formulation type in beauty) tell you what product attributes are driving buyer preference in the category.
When you see matching criteria that are very broad — “list any product in the wellness accessories subcategory at any price point” — the signal is that the supply gap is large and TikTok is trying to pull in as many sellers as possible. When criteria are narrow and specific — “SPF 30+ mineral sunscreen in a stick format, priced between $12 and $28” — TikTok is telling you precisely what buyers are asking for that existing supply isn’t delivering. The specificity itself is market research.
The Visibility Reward Mechanism
Listings that successfully match a featured opportunity receive what TikTok describes as enhanced exposure — additional impressions in both the Shop tab feed and search results pages during the active window of the opportunity. This isn’t a guaranteed traffic volume; it’s an algorithmic weighting that gives qualifying listings a higher probability of appearing in relevant placements.
The practical effect varies by category and competition level. In a low-supply opportunity, a matching listing can experience a measurable spike in organic traffic within 24–48 hours of matching. In a category where many sellers have already matched, the incremental benefit shrinks. This is another reason why speed of execution is a core competitive variable in using this tool — the visibility reward is most valuable early in the opportunity window.
Pre-Filled Data as an SEO Advantage
When you use TikTok’s “create new product” pathway from within a featured opportunity, the pre-filled product data deserves careful attention rather than automatic acceptance. TikTok populates suggested titles, attributes, and categories based on its own search and purchase data. These suggestions are effectively TikTok telling you the exact keywords and attribute structures that match how its buyers search.
That said, pre-filled data should be treated as a starting point, not a finished listing. Review the suggested title against your Trending Searches data. Add specificity where the pre-fill is generic. Ensure your primary product images are high-quality and format-native for TikTok’s mobile-first display — because the visibility boost only converts to sales if the listing itself is compelling enough to stop the scroll.
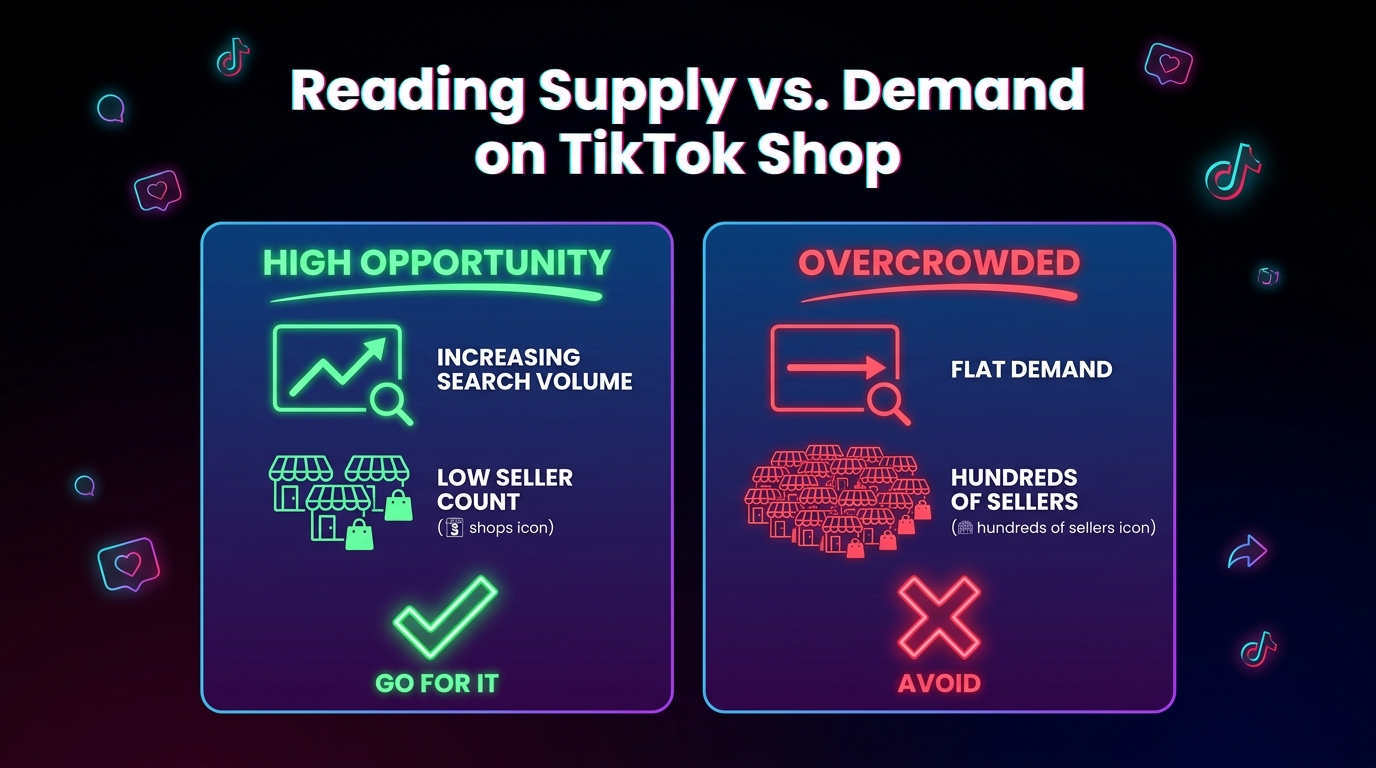
Reading Supply-Demand Signals: The Metrics That Actually Matter
The central purpose of the Product Opportunities tool is to help sellers find markets where demand exceeds supply. But how you measure that imbalance — and how much weight you give to each signal — determines whether you’re making genuinely informed product decisions or just acting on surface-level data that looks actionable but isn’t.
Demand Strength vs. Demand Durability
Not all demand signals in the tool represent the same type of opportunity. Some signals reflect spike demand — a product that’s viral right now because of a specific moment (a TikTok creator’s post going mega-viral, a news event, a seasonal trigger). Others reflect structural demand — a product category that’s growing because of underlying behavioral shifts in what TikTok’s audience is buying and how they’re discovering products.
Spike demand opportunities move fastest and carry the highest inventory risk. If you see a product appearing in Featured Products with extraordinary week-on-week growth numbers, the supply gap might close within days once other sellers react to the same signal. Structural demand opportunities — where search volume has been climbing steadily for 30–90 days and creator content in the category is consistently converting — are more defensible and worth longer-term inventory investment.
The tool doesn’t explicitly label signals as “spike” or “structural,” but you can infer it from the time frame of the growth data shown and by cross-referencing with the Trending Searches tab. A keyword that appears in Trending Searches with 90-day upward momentum is a much more durable signal than one that spiked in the last 7 days.
Competitor Count as a Tiebreaker
When two opportunities look comparable on demand metrics, the number of competing sellers already active in the category becomes the decisive variable. Fewer active sellers means less price competition, more organic real estate on the Shop tab, and a longer window to build review velocity before the market tightens.
The challenge is that TikTok doesn’t always surface competing seller counts directly in the tool. You need to do a manual category search in the TikTok Shop front end to see how many listings already exist for the opportunity product — and assess their quality level. A category with 50 listings and 45 of them low-quality imports with one-star reviews is a very different competitive landscape than a category with 50 listings from established brands with strong review profiles.
Price Point and Margin Viability
An opportunity the tool surfaces might have excellent demand-supply characteristics but be price-compressed in a way that makes it economically unviable for your cost structure. Before committing to any opportunity, calculate your full landed cost including TikTok Shop’s commission structure (which increased in 2026), fulfillment, creator affiliate commissions if you’re using the affiliate model, and ad spend if you plan to amplify through Spark Ads or Shop Ads.
The target floor for healthy TikTok Shop economics is typically a gross margin of 50%+ before platform fees, with the understanding that TikTok’s affiliate commission model often adds another 10–20% to cost of sale if you’re relying on creator distribution. Products with sub-$15 retail prices are particularly hard to make work at scale unless you’re operating a high-volume, low-touch commodity play.
Category Patterns: Where the Tool Is Signaling Opportunity Right Now
While the Product Opportunities tool gives sellers individualized, real-time data, there are broader category-level patterns visible across seller communities and platform analytics that provide useful context for interpreting what the tool surfaces. These aren’t investment recommendations — they’re the structural backdrop against which your individual opportunity signals are playing out.
Beauty and Personal Care: Still the Platform’s Engine
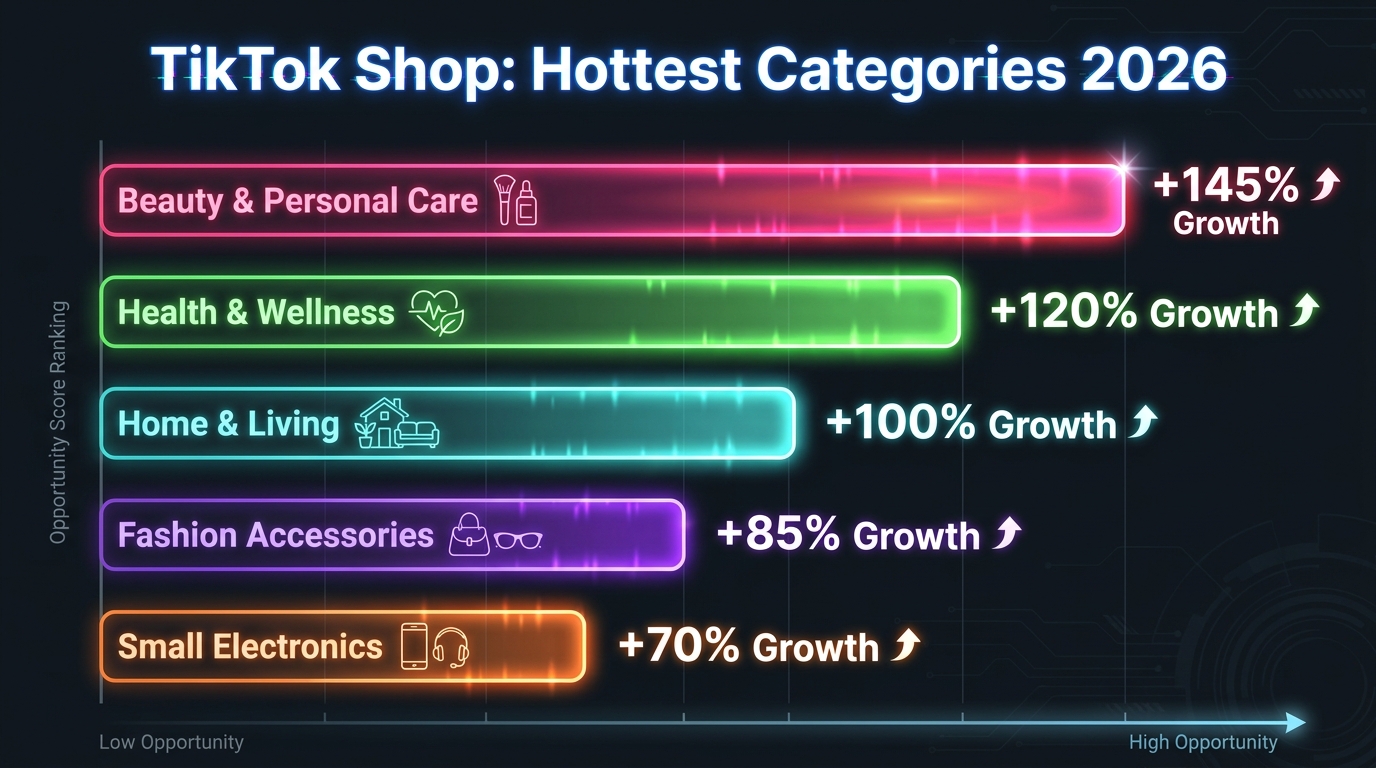
Beauty and personal care has been TikTok Shop’s dominant category since the platform’s US commerce launch, and it continues to hold that position in 2026. The category benefits from a near-perfect alignment between TikTok’s content format (demo-heavy, before-and-after, transformation-led) and product mechanics (visible results, accessible price points, strong repeat purchase rates).
Within beauty, the Product Opportunities tool is currently surfacing particularly strong signals in functional skincare (ingredient-specific products like niacinamide serums and peptide moisturizers), hair wellness (scalp treatments, biotin-forward formulations), and men’s grooming — a subcategory that TikTok’s user data shows is growing faster than the overall beauty category as male-skewing creator content drives new buying behavior.
The supply gap in beauty is most pronounced in mid-tier clinical positioning — products priced in the $18–$40 range that make ingredient-specific claims without requiring a dermatologist visit. The ultra-premium and ultra-cheap ends of the market are both crowded; the credible-but-accessible middle is where platform demand is consistently outrunning available supply.
Health and Wellness: Functional Over Lifestyle
Wellness as a category on TikTok Shop has matured past the generic supplement boom of 2023–2024. What the Product Opportunities tool is now flagging in this space skews toward functional specificity — products with clear, single-use-case messaging that can be demonstrated or explained concisely in a 30-second video.
Magnesium formulations, sleep-support supplements, and gut health products continue to show strong demand-supply gaps. The tool is also surfacing rising signals in recovery and performance accessories — foam rollers, massage guns at accessible price points, compression sleeves — categories where the product is demonstrable in video and creator content has proven conversion power.
Home and Living: The Visual Appeal Factor
Home and living opportunity signals on the tool tend to cluster around products with strong visual transformation potential. Organization products that let creators show “before and after” setups, aesthetic home accessories that photograph well against trending interior design styles, and functional kitchen tools with satisfying demo moments are consistently appearing in the Featured Products tab.
The interesting sub-pattern here is that price sensitivity in home and living skews lower than in beauty — TikTok Shop buyers are more price-aware in this category. The opportunity lies in products priced under $35 with high perceived value (something that looks premium on camera but has affordable sourcing) rather than in the higher-ticket home goods space.
Small Electronics and Accessories: Speed-to-Market Dependence
Small electronics and accessories opportunities on the tool are the most time-sensitive of any category. Tech-adjacent products trend fast and saturate faster. When the tool surfaces an electronics opportunity — a particular phone case format, a mini projector style, a specific earphone design — the window between signal appearance and market saturation can be as short as 72 hours in peak trend cycles.
Sellers in this category who are positioned to move quickly — with existing supplier relationships, pre-built listing templates, and creator brief frameworks they can activate immediately — capture a disproportionate share of the early visibility window.
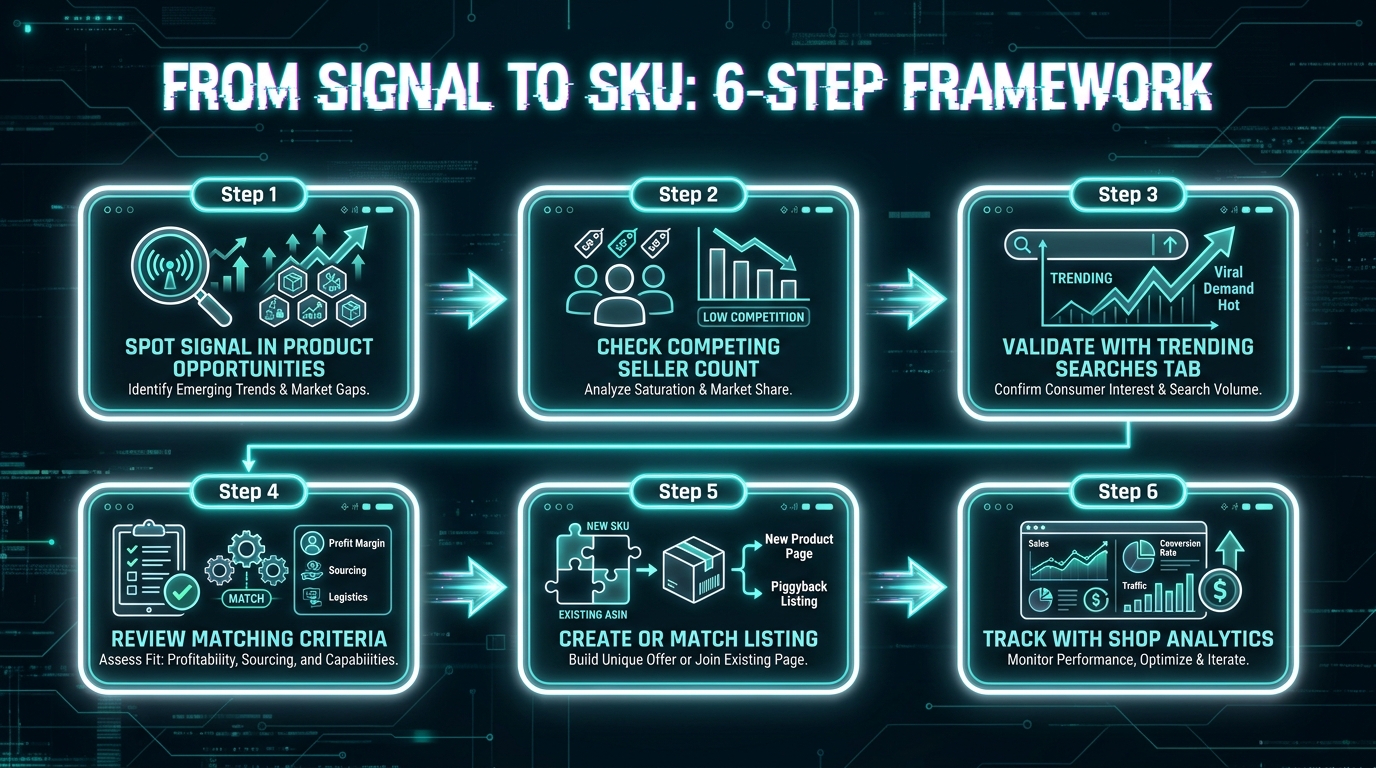
From Signal to SKU: A Step-by-Step Decision Framework
Spotting an opportunity in the tool is the easy part. The hard part is making a disciplined go/no-go decision without either moving too slow (missing the window) or too fast (committing inventory to an unvalidated bet). Here’s a framework built around the tool’s data structure that forces that discipline.
Step 1: Capture the Signal, Don’t Act on It Yet
When you see a promising entry in the Featured Products or Trending Searches tab, document it immediately — screenshot the data, note the timestamp, and record the competing seller count from a manual search. Don’t immediately jump to listing creation. You need a few more data points before a decision, and the act of capturing forces you to organize your assessment rather than acting on impulse.
Step 2: Cross-Reference Across All Three Tabs
A strong opportunity will show up across multiple signals simultaneously. A product appearing in Featured Products and its primary keyword appearing in Trending Searches and relevant content hashtags showing purchase-correlated engagement is a much stronger signal than any single tab alone. Single-tab signals are hypotheses; multi-tab convergence is evidence.
Step 3: Check Your Catalog First
Before considering new sourcing, run through your existing catalog to see whether you have anything that could match the opportunity with minor optimization — a listing retitle, an attribute update, or a category reassignment. The fastest path to capturing an opportunity is always through existing inventory, and the pre-fill matching pathway in the tool is specifically designed to help you make that connection.
Step 4: Run a Rapid Unit Economics Check
For any opportunity you’re seriously considering, run a quick margin calculation using these inputs: estimated retail price from the tool’s matching criteria range × your target sell-through rate against product cost + TikTok Shop commission + estimated fulfillment cost + creator commission if applicable. If you can’t get to a viable margin with realistic assumptions, the signal strength doesn’t matter — move on.
Step 5: Assess Your Creator Distribution Readiness
On TikTok Shop, no listing succeeds without content. Before you commit to an opportunity, ask: do you have a creator relationship or affiliate program reach that can generate early content for this product? If you’re planning to produce your own videos, can you create a credible, platform-native demo for this product format? An opportunity without a content plan attached to it isn’t an opportunity — it’s inventory you’ll struggle to move.
Step 6: Set a Time-Box for the Decision
Given TikTok Shop’s speed dynamics, set yourself a hard time limit for the decision process — ideally no more than 24–48 hours from signal capture to go/no-go. If you cannot make a decision within that window, default to no-go. Slow decisions in trend-driven markets are effectively negative decisions; by the time you’ve decided to act, the window may have closed.
How to Pair the Tool with TikTok’s Other Native Analytics
Product Opportunities is more powerful when used as part of a broader native analytics stack rather than in isolation. TikTok Shop Seller Center has several complementary tools that, together, give you a much more complete picture of what to list, how to price it, and how to measure its performance.
Shop Analytics: Performance Feedback Loop
Shop Analytics in Seller Center gives you SKU-level performance data — impressions, click-through rates, add-to-cart rates, and conversion rates for your existing listings. This data is essential for understanding whether an opportunity you’ve matched is actually converting, not just receiving traffic.
The most useful thing you can do with Shop Analytics in the context of Product Opportunities is to set a 7-day and 30-day review milestone for any listing you’ve created or matched through the tool. If a matched listing is receiving the algorithmic visibility boost but not converting, the problem is almost always in the listing quality (images, title relevance, price positioning) or the lack of supporting content — both of which are fixable. If it’s converting but not receiving traffic, the matching may have failed to trigger the visibility reward, in which case review whether you’re fully meeting the matching criteria.
Search Analytics: Keyword Validation
TikTok Shop’s Search Analytics tool shows you the specific search terms buyers are using to find your products, and how your listings are ranking for those terms. Cross-referencing this with the Trending Searches tab in Product Opportunities lets you identify cases where a trending search term is driving traffic to your category but your listing isn’t appearing in those results — a gap you can often close with a listing title update alone.
Creative Center: Content Intelligence
While not part of the Seller Center suite, TikTok’s Creative Center (accessible separately) provides video performance data that directly complements your Product Opportunities research. If the tool surfaces a product opportunity, checking Creative Center for existing top-performing videos in that product category shows you what content format, hook style, and creator type is already converting for comparable products — giving you a content brief template to work from rather than starting from scratch.
The combination of Product Opportunities (what to sell), Search Analytics (how buyers find it), and Creative Center (how to content-distribute it) creates a closed-loop research workflow that most sellers aren’t using systematically but that significantly de-risks product decisions.
Common Mistakes Sellers Make When Acting on Product Opportunities Data
The tool is useful, but it’s not a guarantee. The sellers who’ve had poor experiences with Product Opportunities have almost always made one of a small number of predictable mistakes that are worth understanding explicitly so you can avoid them.

Mistake 1: Treating Featured Products as a Sourcing List
The tool tells you what has demand. It does not tell you whether you can source and sell that product profitably. Sellers who use the Featured Products tab as a direct sourcing list — seeing a product, immediately searching Alibaba for a supplier, ordering inventory, and listing — are skipping all the validation steps that determine whether the economics actually work.
The gap between “TikTok is showing demand for this product” and “I can make money selling this product on TikTok” is filled with unit economics, creator relationships, listing quality, and timing. Treating the tool as the end of your research rather than the beginning is the most common way sellers end up with inventory they can’t move.
Mistake 2: Ignoring the Recency of the Signal
Not all entries in the Featured Products tab are equally fresh. Some opportunities have been sitting in the tool for weeks and are well-known in seller communities — meaning supply has already started to catch up, even if the tool’s data hasn’t fully reflected that yet. Check when a featured product was added to the tool if that information is available, and do a current manual search to see how many sellers have already moved on the signal.
Mistake 3: Matching Without Optimizing
The matching pathway in the tool lets you connect an existing listing to a featured opportunity with a few clicks. Many sellers do exactly that — click match, submit, and wait for the traffic. But a match without listing optimization is a missed conversion opportunity. The tool might send you more impressions, but if your listing title doesn’t reflect the exact keyword buyers are searching, your images don’t communicate the product’s value proposition clearly, or your pricing isn’t competitive within the matching criteria range, those extra impressions won’t convert.
Always treat a matching event as a listing audit trigger. Review title, images, bullet points, price positioning, and product video before or immediately after submitting a match.
Mistake 4: Acting on Every Signal Equally
The tool surfaces multiple opportunities simultaneously — often dozens at any given time. Sellers with limited operational bandwidth sometimes try to act on every signal, spreading their listing efforts and inventory investment thin across too many concurrent opportunities. This results in under-resourced listings that don’t have enough creator content, review depth, or optimization attention to actually convert.
A more effective approach is to select two or three opportunities per research cycle that meet your full criteria — strong demand signal, viable unit economics, creator distribution readiness, low-to-moderate competition — and execute those well, rather than making low-effort attempts at many.
Mistake 5: Not Tracking the Attribution
If you match a listing or create a new product through the Product Opportunities pathway and then never track whether that specific listing performed better than your baseline, you have no feedback loop. You can’t improve your research and decision criteria if you don’t know whether the decisions are working.
Tag each opportunity-sourced listing in your own tracking system (even a simple spreadsheet) with the source signal, the date of matching, and the 7/14/30-day performance metrics. Over time, this builds a personal data set of which types of signals convert best for your specific catalog and category — which is more valuable than the tool’s data itself.
Beyond the Tool: Validating Opportunities Before You Commit Inventory
The Product Opportunities tool is a platform-native signal, which means it reflects TikTok Shop’s internal ecosystem. But TikTok Shop doesn’t exist in a vacuum — validating an opportunity against external data sources significantly reduces the risk of acting on a signal that looks strong on-platform but doesn’t hold up in the broader market.
Cross-Platform Demand Validation
Before committing to a new SKU sourced from a Product Opportunities signal, run a quick cross-platform check. Is the same product or category showing demand signals on Amazon’s search results, Etsy, or direct-to-consumer brand search volume? Google Trends data for the product’s primary keyword is an accessible and free proxy for broader consumer interest.
Products that show strong demand signals on TikTok Shop and stable or rising demand on other platforms are much lower-risk bets than products that appear only in TikTok’s native data. TikTok demand can spike and collapse faster than any other platform; a product with cross-platform validation is much more likely to have the durable demand curve that supports profitable inventory investment.
Creator Content Supply Check
Search TikTok organically for the product category you’re considering. Assess how many creators are already producing content featuring similar products — and critically, how recent that content is and how it’s performing in engagement and estimated purchase metrics (tools like FastMoss or Kalodata can help with this, though they add cost). If you see a category with strong Product Opportunities signals but virtually no existing creator content, that’s a yellow flag — it may mean the product hasn’t yet proven its content potential, and you’ll be taking on the distribution challenge yourself rather than riding existing creator momentum.
Supplier Lead Time Reality Check
Given TikTok Shop’s fast trend cycles, supplier lead time is a risk variable that can kill an otherwise sound opportunity. If the lead time for sourcing and delivering an opportunity product to your fulfillment location is 6–8 weeks, you may be committing inventory to a trend that’s already past peak by the time your stock arrives. Prioritize opportunities where you can access inventory within 2–3 weeks — either through domestic distributors, existing supplier relationships, or suppliers with US-warehoused stock.
Regulatory and Compliance Screening
TikTok Shop has been actively enforcing product compliance standards in 2026, particularly in health, wellness, beauty, and electronics categories. Before listing any product surfaced by the Product Opportunities tool, verify that it meets all applicable category restrictions, labeling requirements, and safety certifications. The tool does not screen for compliance — it shows demand signals regardless of whether a product can be legally listed. A listing removed for compliance issues after you’ve committed inventory is a costly lesson.
Building a Repeatable Research Cadence Around the Tool
The sellers who extract consistent value from the Product Opportunities tool are treating it as a scheduled part of their operational routine rather than an occasional resource. Here’s what a sustainable research cadence looks like in practice.
Weekly Signal Review (30–45 Minutes)
Set a fixed weekly time slot — same day, same time — to open Product Opportunities, review all three tabs, and document new signals. Compare what you see this week against what you documented last week. Signals that have moved from Trending Searches into Featured Products between reviews indicate strengthening demand — these are priority signals worth deeper evaluation. Signals that have been in Featured Products for two or more consecutive weeks without changing are either mature opportunities (check competitor count) or structural categories worth a longer-term positioning play.
Bi-Weekly Listing Audit (1–2 Hours)
Every two weeks, review the performance of any listings you’ve created or matched through Product Opportunities over the previous 60 days. Compare their click-through rates, conversion rates, and revenue against your catalog baseline. This audit will show you which types of signals and categories are actually performing for your business versus which ones generate traffic that doesn’t convert — essential intelligence for calibrating how much weight to give different signal types in your next round of research.
Monthly Category Deep-Dive (2–3 Hours)
Once a month, pick one category that has appeared consistently in your Product Opportunities data and do a comprehensive analysis: competitor landscape, price positioning map, creator content supply, cross-platform demand signals, and supplier options. This monthly deep-dive is where you make your medium-term catalog decisions — which categories to expand into, which to double down on, and which to exit.
Connecting the Tool to Your Broader Business Rhythm
Product Opportunities data should feed into your quarterly planning cycles, not just your weekly listing decisions. If the tool is consistently surfacing strong signals in a category you’re not currently active in, that’s a strategic question for your planning meetings — what would it take to enter this category credibly, and is it worth the investment? Conversely, if the tool has stopped surfacing opportunities in a category where you have deep inventory, that’s an early warning signal that the category may be maturing on TikTok Shop, and you may want to reallocate creator and ad spend before volume drops are visible in your Shop Analytics.
What the Tool Can’t Tell You — and Where Human Judgment Still Wins
Every data tool has blind spots, and being clear-eyed about them is part of using the tool well rather than being misled by it. The Product Opportunities tool operates on TikTok Shop’s internal platform data — it does not have visibility into supply chain disruptions, upcoming regulatory changes, competitive moves being planned by larger brands, or the qualitative factors that determine whether a specific product will resonate with TikTok’s audience.
Brand Affinity and Cultural Fit
TikTok’s commerce environment is more culture-sensitive than other platforms. A product that looks like a strong demand-supply gap in the data might fail because the brand presentation doesn’t resonate with TikTok’s community norms, or because the product’s target buyer demographic doesn’t align with the platform’s user base in a given category. Data tools can measure demand volume; they can’t measure cultural fit. Your judgment about whether a product’s brand story, visual identity, and audience alignment work for TikTok is irreplaceable.
Creator Fit and Content Naturalism
The best-selling products on TikTok Shop are those that feel organic in creator hands — products that generate genuine enthusiasm, surprising demonstrations, or relatable use cases. A product that looks like a data winner might die on the platform because no creator can find an authentic angle for it. Before acting on any Product Opportunities signal, ask yourself: what would a great TikTok video about this product look like, and does that video feel natural or forced? If you’re struggling to imagine a compelling content angle, the product is likely going to struggle for creator adoption regardless of what the data says.
Timing and External Events
Seasonality, news events, and cultural moments create demand spikes that appear in Product Opportunities data but don’t represent durable opportunities. A skincare product appearing in the tool in late November may be riding a holiday gift-buying surge that evaporates in January. A food and beverage product surfacing after a viral diet trend peaks may already be past the organic demand window. Always apply your own temporal judgment to what the tool is showing you — ask whether the demand signal is structural or event-driven, and size your inventory commitment accordingly.
The Tool Is an Edge, Not a System — Building Your Advantage
TikTok Shop’s Product Opportunities tool gives every seller on the platform access to the same raw demand intelligence. That democratization of data sounds like it should level the playing field. But what actually determines who wins with the tool is how systematically and intelligently it gets used — not the fact of having access to it.
The sellers pulling ahead right now are those who have built a repeatable process around the tool: weekly review cadences, structured go/no-go decision frameworks, connected analytics workflows, and creator distribution readiness that lets them move from signal to live, optimized listing in 48 hours rather than two weeks. They’re treating the tool as the beginning of their research, not the end of it — validating every signal against unit economics, cross-platform data, and content viability before committing inventory.
They’re also developing judgment about what the tool can and can’t tell them. Platform-native data is a powerful lens, but it only shows you one angle of the market. The sellers who combine the tool’s demand-supply gap intelligence with their own category knowledge, supplier relationships, and creator network understanding are the ones converting data signals into consistently profitable SKUs.
Here are the five actionable takeaways to implement immediately:
- Schedule a fixed weekly slot to review all three Product Opportunities tabs and document signals with timestamps and competitor counts.
- Treat matching criteria as market research — the specificity of TikTok’s requirements tells you exactly what buyers want that existing supply isn’t delivering.
- Always run unit economics before acting on any signal, accounting for TikTok Shop’s commission structure, fulfillment, and affiliate costs.
- Cross-validate with Search Analytics and Creative Center before creating or matching listings — a multi-source signal is far more actionable than a single-tab flag.
- Track every opportunity-sourced listing separately with 7/14/30-day performance reviews to build your own decision-calibration data over time.
The Product Opportunities tool won’t make product decisions for you. But used with discipline and integrated into a full research workflow, it gives you a meaningful information advantage in a market where information speed is one of the few remaining structural edges available to sellers who aren’t operating at enterprise scale.