
For most of Amazon’s history, the story of its marketplace was one of seemingly unlimited supply. Every year brought more sellers, more listings, and more competition for the same search results page. That story has now reversed.
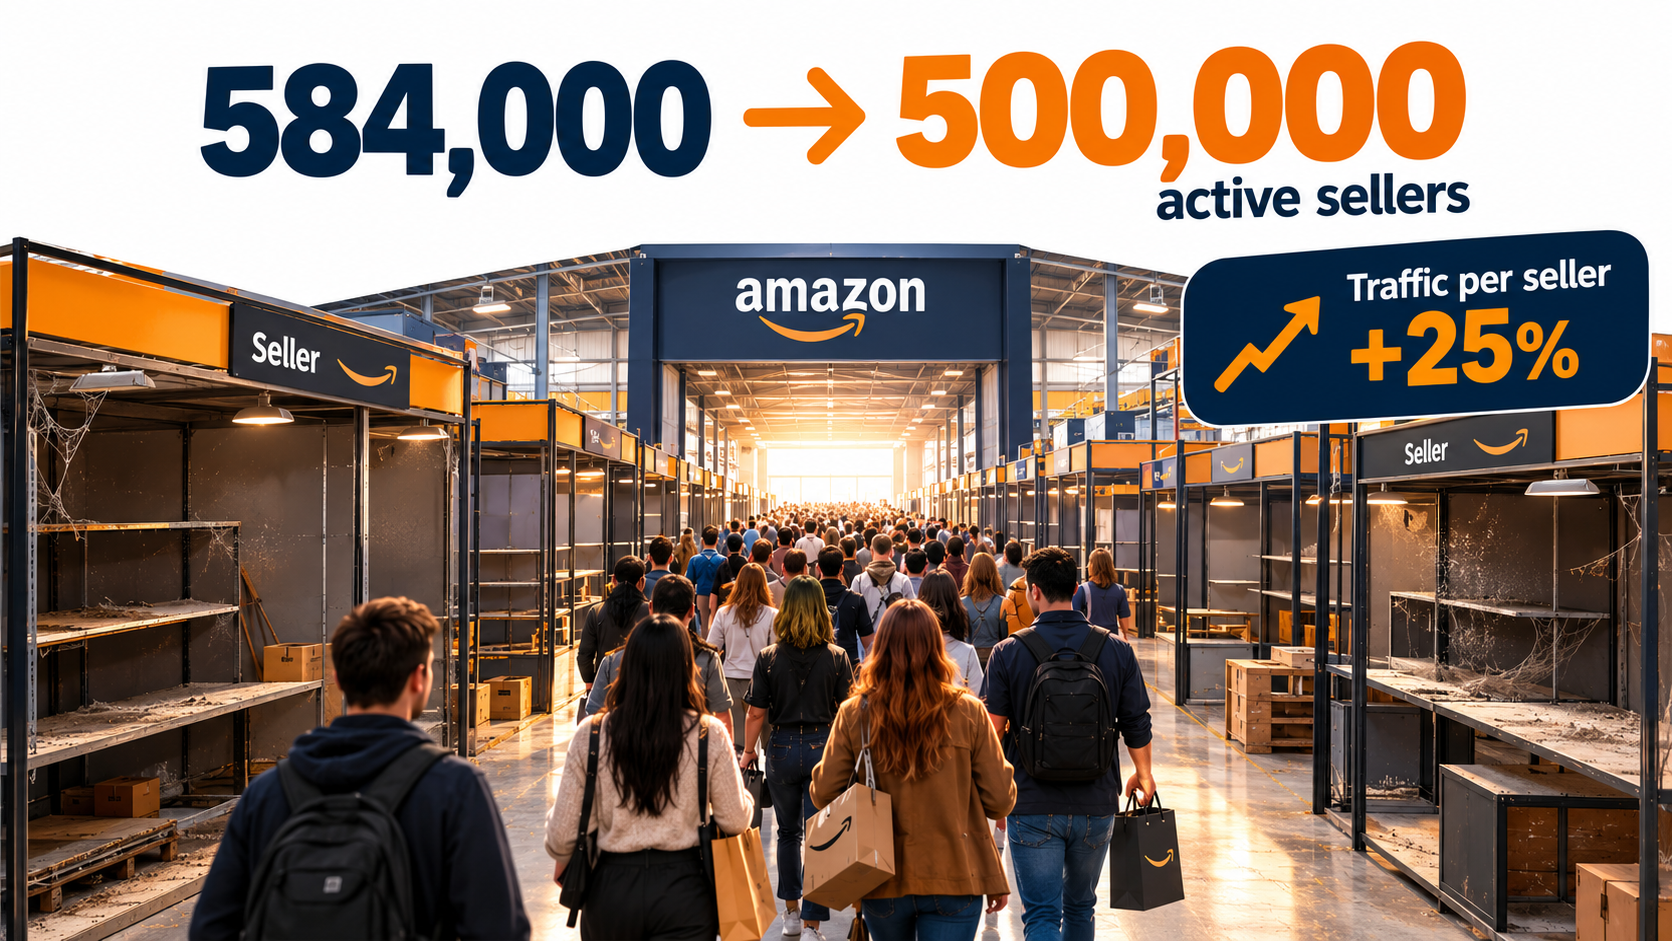
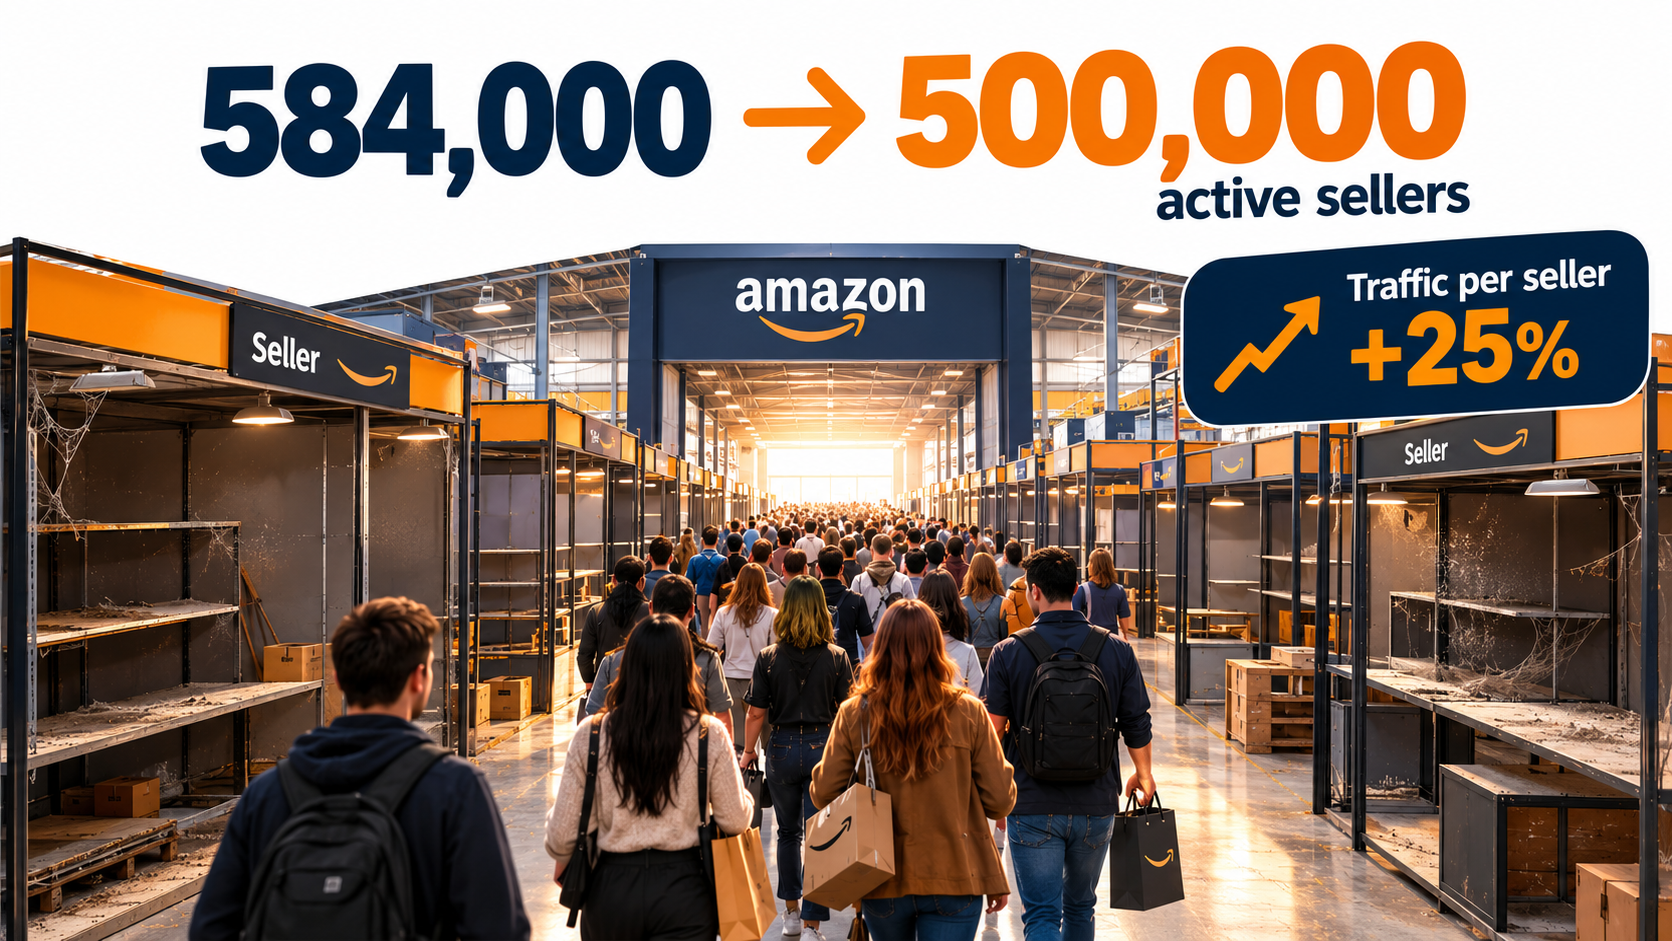
According to Marketplace Pulse data, the number of active sellers on Amazon.com fell from 584,000 in January 2025 to 500,000 in March 2026. That’s roughly 84,000 businesses that stopped generating customer feedback in a little over a year. Across all 23 Amazon marketplaces, active sellers declined 16% to under 1.56 million.
Shoppers didn’t leave, though. Combined web traffic across Amazon’s marketplaces grew nearly 5% to about 5.5 billion monthly visits, per SimilarWeb data cited by Marketplace Pulse. Average traffic per active seller climbed 25% in a single year. More customers are being split among fewer sellers.
That sounds like good news for whoever is left, and for some sellers it is. But the same data shows revenue concentrating faster than ever. The fee and advertising burden keeps growing, and a new AI-driven discovery surface doesn’t follow the rules most sellers built their businesses around.
This article isn’t another list of listing tips. It’s a look at the structural data behind Amazon selling in 2026: who is winning, who is getting squeezed, where discovery is moving, and what the sellers who are growing revenue and margins are doing differently. Most of the figures come from Marketplace Pulse’s 2026 research, its Seller Index survey, and Amazon’s own earnings disclosures.
If you sell on Amazon, or you’re deciding whether to start, these are the numbers that set the terms for the next twelve months.
Fewer Sellers, More Shoppers: The Traffic-Per-Seller Math
The simplest way to understand Amazon in 2026 is as a ratio: how many shoppers each active seller gets. Marketplace Pulse tracks this as monthly visits per active seller, where “active” means a seller received at least one piece of feedback in the past year.
In the past year, that figure rose 25% to 3,544 monthly visits per seller. For context, it rose only 31% across the previous four years combined. Most of the change is happening now.
The gains are biggest outside the U.S.
When Marketplace Pulse first built the metric in 2021, the U.S. stood alone as the marketplace with the most traffic relative to its seller count. That’s no longer unique. Sellers in Brazil, Mexico, France, Poland, and the Netherlands all saw traffic per seller grow 40% to 57%.
Amazon.com.br is the sharpest example. It added 36 million monthly visits while its active sellers declined 23%, lifting visits per seller 57%. U.S. sellers saw a 19% increase: meaningful, but the smallest gain among Amazon’s top ten marketplaces.
A few other details stand out:
- Saudi Arabia leads on raw traffic per seller at 9,980 visits, a result of consumer demand carried over from Amazon’s 2020 Souq transition outpacing seller adoption. Its low absolute traffic ceiling limits which categories can support a business there.
- Australia is the only Amazon marketplace where active seller numbers grew over the past year.
- The U.S. is still the largest absolute opportunity, with revenue per seller more than $200,000 above the next-largest market.
- Amazon’s top ten marketplaces still account for 92% of both global traffic and active sellers.
Why more traffic per seller doesn’t mean easier selling
It’s tempting to read this as “less competition.” That’s only half true. The sellers who dropped out weren’t evenly distributed. They were mostly smaller operators who couldn’t absorb rising costs, and the ones who remain are, on average, more capable.
Marketplace Pulse lists several converging pressures: tariffs and inflation complicating cost of goods, Chinese sellers (now more than half of Amazon’s active sellers globally) intensifying price competition, and AI raising the bar on operational sophistication. Established sellers are using AI to widen their lead.
So the customer pie is growing and the number of people at the table is shrinking. But the people still seated are better at eating. As Marketplace Pulse puts it, the operational bar has risen, and so has the reward, for sellers who can execute at the standard the platform now demands.
What to take from this
- If you’re considering international expansion, the traffic-per-seller data argues for looking seriously at mid-sized marketplaces like Mexico, Brazil, and the European markets where seller supply is thinning faster than demand.
- If you’re a U.S.-only seller, don’t count on the seller decline alone to lift your sales. The remaining competition is more concentrated and better funded.
Concentration: Under 8,000 Sellers Now Generate Half of U.S. Third-Party GMV
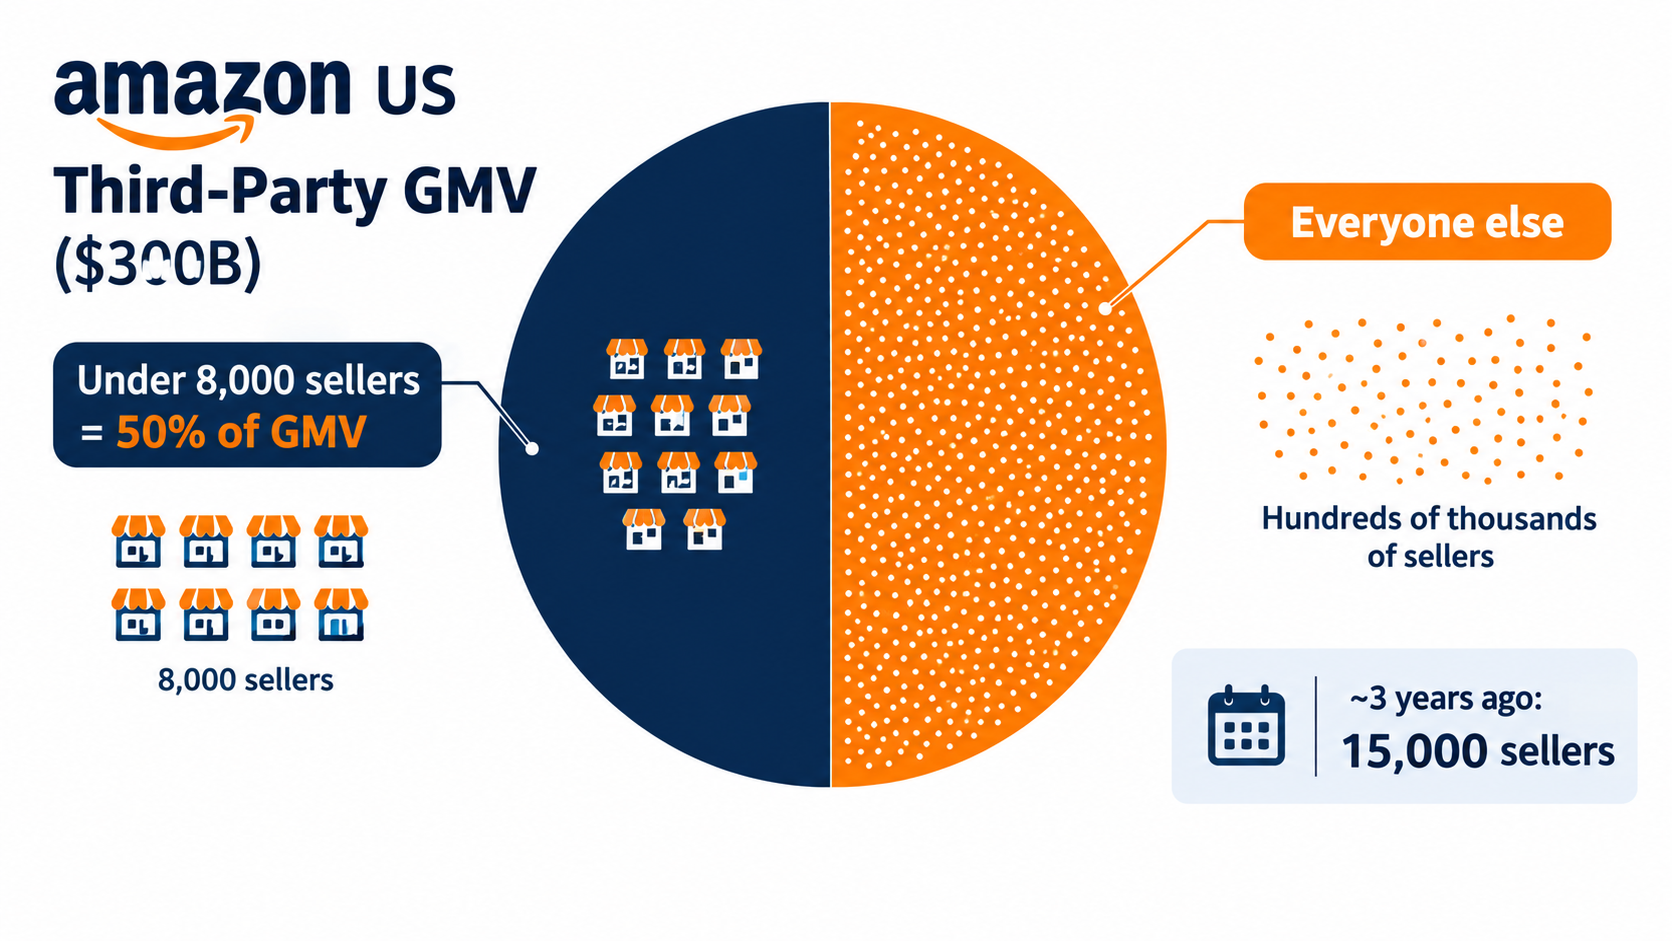
Amazon’s U.S. marketplace is estimated at roughly $300 billion in third-party sales, more than seven times eBay’s and about 20 times that of the next tier of competitors, Temu, TikTok Shop, and Walmart, which sit in a $15–22 billion range. Within that $300 billion, the distribution is getting steeper.
Per Marketplace Pulse, fewer than 8,000 sellers now generate half of Amazon’s U.S. third-party GMV. Less than three years ago, it took about 15,000 sellers to reach that halfway mark. The group at the top has roughly halved.
Top positions are getting stickier
Marketplace Pulse also tracks turnover among the top 10,000 sellers on Amazon.com. In 2026, 68.6% of today’s top sellers held that position a year earlier, almost the same as the 67% recorded in 2019. But 49.6% were already in the top 10,000 three years ago, up from 41% in 2019.
Holding a top position has become more durable. The seats turn over at roughly the same yearly rate, but those who stay tend to stay for longer.
The pandemic vintage got squeezed
Look at when today’s top sellers registered and a pattern appears:
- Pre-2016 sellers: 21.9% of top positions
- 2016–2018 sellers: 27.4%
- 2019–2021 sellers: 17.5%
- 2022–2024 sellers: 26.9%
- Registered within the last 18 months: 6.3%
The thinnest group is the 2019–2021 cohort, which Marketplace Pulse describes as a pandemic vintage that “entered at the marketplace’s peak and has been squeezed from both directions since.” These sellers lack the review history and brand equity of the veterans. They also lack the manufacturing proximity and low-cost structures of many newer entrants.
Half of today’s top sellers registered before 2019, down from over 60% a year earlier. Longevity still counts for something, but it’s no longer the defining trait of the top tier.
Why concentration matters to smaller sellers
Concentration changes the math on almost every competitive decision. When a few thousand sellers control half the GMV, they also control a large share of ad auctions, review velocity, and inventory depth in key categories.
For a smaller seller, that means category selection matters more than it used to. A niche where the top sellers are entrenched veterans with years of reviews is a very different fight from one where the leading listings are relatively new and thinly reviewed. Before committing inventory, look at how long the current leaders have held their positions, not just their sales estimates.
Who Is Taking the Seats: China Won the Top 10,000, America Kept the Top 100
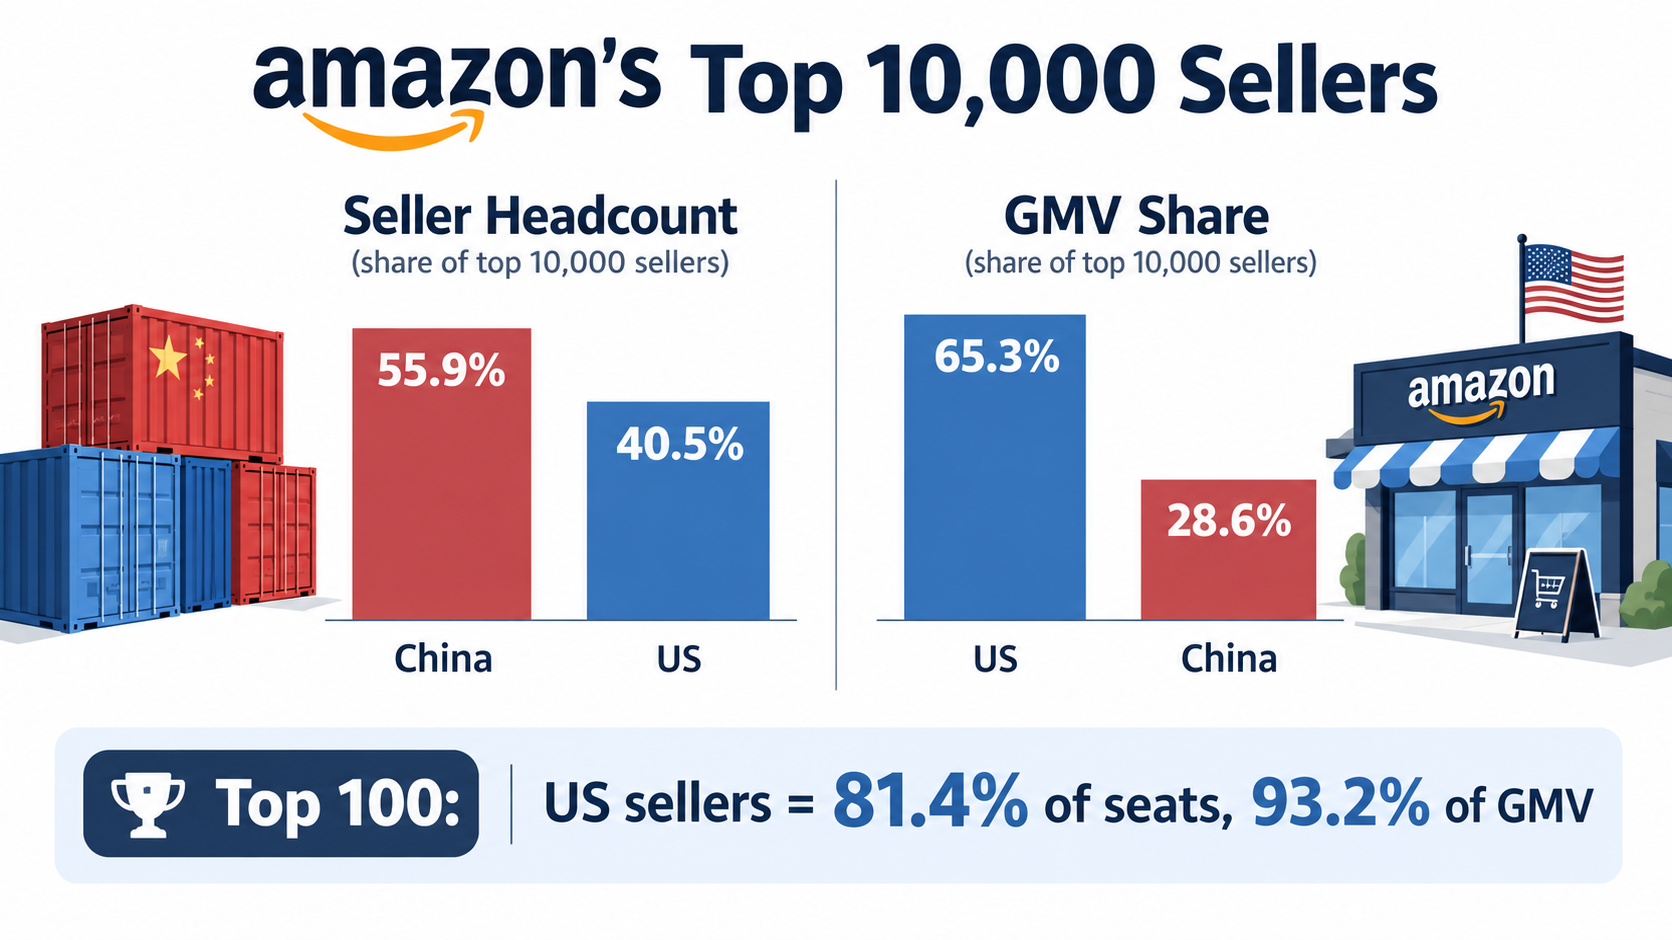
The identity of Amazon’s top sellers has changed dramatically since 2020. Marketplace Pulse data shows Chinese sellers have gained 1,342 positions in the top 10,000 since July 2020, while U.S. sellers have lost 1,320.
Chinese sellers went from 42.5% of that cohort to 55.9%. American sellers fell from 53.7% to 40.5%. And 3.8 points of that share moved in the past twelve months alone.
Headcount vs. revenue
Headcount tells only part of the story. U.S. sellers generate 65.3% of the GMV produced by the top 10,000, compared with 28.6% for Chinese sellers. That’s almost exactly the inverse of their headcount shares.
The gap is widest at the very top. American sellers make up 81.4% of the top 100 and produce 93.2% of that group’s GMV. In the 5,001–10,000 band, they hold only 34% of positions.
Price explains much of the difference. U.S. sellers’ average selling price is higher than Chinese sellers’ at every rank level. The gap is starkest in the top 100: $47.62 versus $22.03.
What the new entrants bring
Marketplace Pulse identifies the advantages driving Chinese sellers’ rise: manufacturing proximity, direct factory relationships, export subsidies, and AI tooling that has erased the listing-quality gap that used to protect domestic sellers. A polished listing with good English copy and professional images is no longer a moat. Anyone can produce one.
These sellers also arrived in a different marketplace. Veterans built rank through organic position and review history. That real estate has steadily given way to sponsored placements, and factory-direct entrants with thinner product margins but lower costs can outspend them for it.
The strategic takeaway: compete on price point, not just price
The data suggests a practical split. In low-ASP commodity categories, sellers without factory-level costs are fighting on the least favorable terms. The average-price gap at the top of the rankings shows where U.S. brands still hold ground: higher price points, where brand trust, product differentiation, and customer loyalty justify a premium.
For sellers deciding where to compete, it’s worth asking a blunt question about each product: is my advantage something a factory-direct competitor could copy within one production run? If the answer is yes, the product is likely to end up in a price war you can’t win on cost.
The Four Seller Cohorts: Thriving, Grinding, Consolidating, Distressed
Platform-level numbers show aggregate growth. They don’t show who’s capturing it. To dig into that, Marketplace Pulse’s 2026 Seller Index surveyed 181 marketplace sellers representing over $2 billion in combined annual revenue.
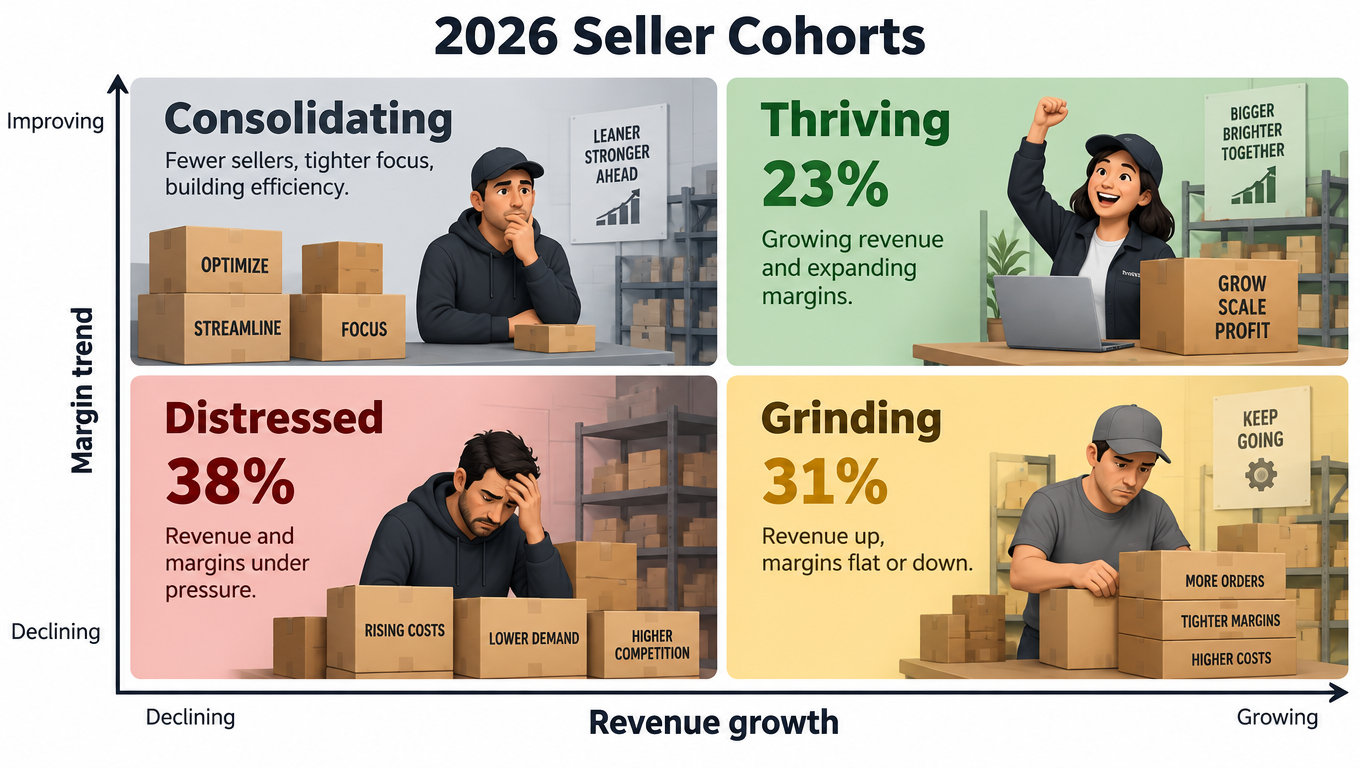
The survey sorted respondents into four cohorts based on their revenue and margin trends. The split is stark.
The breakdown
- Thriving (23%): growing revenue and improving margins at the same time.
- Grinding (31%): revenue up, but margins flat or declining. Marketplace Pulse describes this as a potentially unsustainable treadmill.
- Distressed (38%): at best, no growth in sight. At worst, revenue and margins are both heading the wrong way.
- Consolidating: the remaining share of respondents, sellers deliberately narrowing their operations.
These cohorts operate on the same platforms, under the same fee schedules, facing the same algorithm. The difference between them lies in how they run their businesses, not in the conditions they face.
The grinding trap
The grinding cohort deserves particular attention because it’s where many sellers who think they’re doing well actually sit. Revenue growth feels like success. But if each additional dollar of revenue costs more in ads and fees than the last, growth just speeds up the treadmill.
A common pattern: a seller raises ad spend to defend rank, rank holds, revenue grows, and TACoS (total advertising cost of sale) creeps up quarter after quarter. The top line looks healthy. Contribution margin per unit quietly shrinks.
How to find out which cohort you’re in
Most sellers can place themselves with a simple exercise. Compare the trailing twelve months to the prior twelve months on three numbers:
- Net revenue (after returns and refunds)
- Contribution margin per unit after COGS, all Amazon fees, inbound freight, storage, and advertising
- TACoS, ad spend as a percentage of total revenue
If revenue is up and contribution margin per unit is down, you’re grinding, whatever your dashboard’s headline growth figure says. The fix usually isn’t more volume. It’s cutting SKUs with poor unit economics, repricing, or reducing ad spend on terms that defend rank without adding profitable sales.
Marketplace Pulse reports that 47% of Seller Index respondents saw a year-over-year margin decline. Nearly half the seller base is on the wrong side of this line.
The Cost Squeeze: Fees, Ads, and the Disappearing Float
Ask sellers what hurts most and the answers are consistent. In the 2026 Seller Index, 49% of Amazon sellers named marketplace fees as a top margin concern, and 46% cited advertising spend. Both costs are set or shaped by the platform.
The dependence paradox
You might expect fee-frustrated sellers to be moving away from Amazon. Mostly, they aren’t. Among sellers most frustrated with fees, only 24% are reducing Amazon’s share of their revenue mix, while 42% are actively growing it.
Marketplace Pulse calls this the “paradoxical dependence” of Amazon and its sellers. Amazon controls about 36% of U.S. e-commerce and 70% of marketplace commerce. The alternatives don’t offer comparable scale, so frustrated sellers stay and dig in deeper.
The dependence runs both ways. Third-party seller fees and advertising now generate roughly a third of Amazon’s total company revenue. Third-party sellers account for about 60% of paid units and an estimated 69% of GMV.
Three policy changes that tested sellers’ cash flow
Early in 2026, three changes hit sellers’ finances in quick succession, as reported by Marketplace Pulse:
- A 3.5% fuel surcharge on fulfillment.
- Automatic ad cost deduction from seller proceeds, which would have ended the practice of paying ad bills by credit card and earning cash back.
- DD+7 disbursement terms, which hold payment until seven days after delivery.
Together, these removed much of the financial float that sellers with declining margins rely on. Some sellers organized an advertising boycott for April 15. Amazon rolled back the ad payment change the day before, delaying it until August.
Marketplace Pulse’s analysis of the boycott is sobering. Even if 1,000 high-volume sellers (each with $10 million in annual revenue and 10% ad spend) had stopped advertising for the full day, the impact would have been roughly $3 million. That’s under 2% of a typical day’s revenue for an ad business generating nearly $70 billion a year. The rollback likely had more to do with regulatory optics during the ongoing FTC antitrust case and with managing seller sentiment than with lost revenue.
Practical responses to the squeeze
- Model cash conversion, not just margin. DD+7 changes how long your money is tied up. Rebuild your cash flow forecast using the delay between inventory purchase and disbursement, not just gross margin.
- Treat ad spend as a cost of goods. With ad costs this significant, sellers who calculate “landed cost including advertising per unit” make better pricing decisions than those who treat ads as a separate marketing budget.
- Review your SKU tail. Low-velocity SKUs attract storage fees and dilute ad budgets. The thriving cohort tends to run tighter catalogs.
- Build a policy-change buffer. Three material changes in a few months is the new normal. Keep a cash reserve sized for at least one unexpected fee increase or payment delay.
The Third Shelf: Amazon’s AI Assistant Doesn’t Read Your Rankings
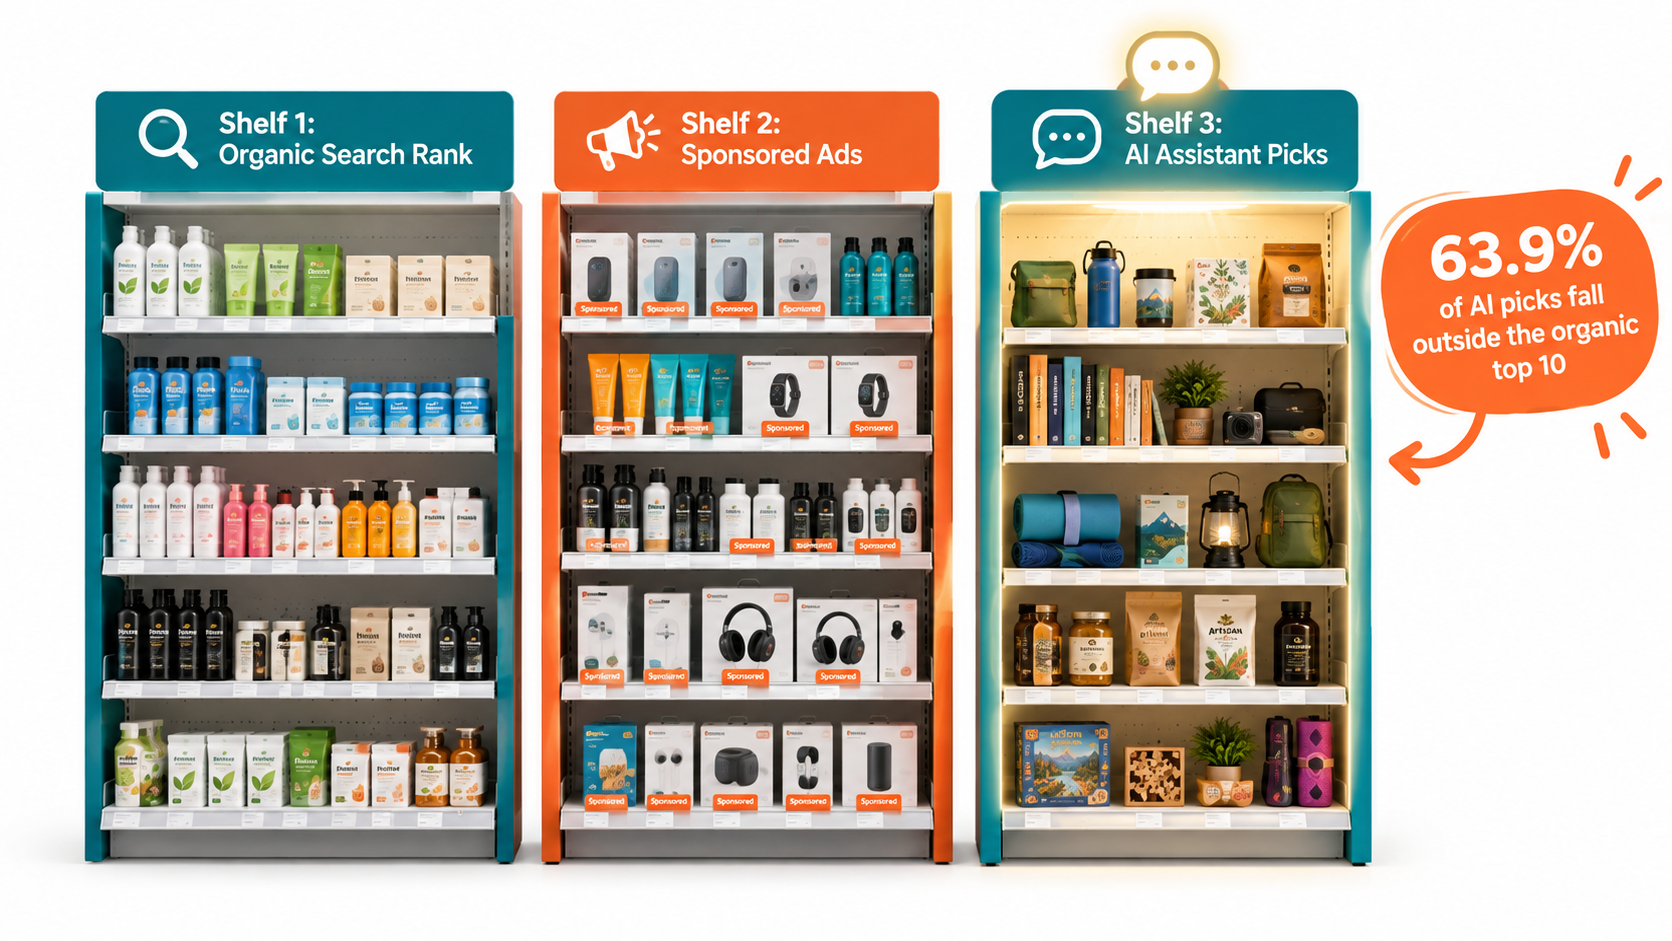
For two decades, visibility on Amazon has come through two routes. Organic rank is earned slowly through sales velocity. Sponsored placement is bought at auction. Most seller dashboards, agency reports, and PPC strategies revolve around these two.
In 2026, a third route arrived, and early evidence suggests it plays by different rules.
From Rufus to Alexa for Shopping
In May 2026, Amazon renamed its Rufus shopping assistant as Alexa for Shopping, folding the recommendation engine into a broader assistant. Usage has grown quickly. On its Q1 2026 earnings call, Amazon reported that Rufus monthly active users were up 115% year over year, engagement was up nearly 400%, and the assistant was driving an estimated $12 billion in incremental sales.
What the assistant actually recommends
One of the first large-scale studies of its recommendations came from Autopilotbrand.com, an AI-focused vendor, and was reported by Marketplace Pulse in July 2026. The study captured 1,963 non-branded queries and 12,810 recommendations in May and June. It posed “best-of” questions to the assistant (for example, “what is the best queen mattress?”) and compared the answers with the plain category search (“queen mattress”).
The results:
- 63.9% of the assistant’s picks fell outside the organic top 10 for the matching search term.
- 40.9% never appeared on the visible search results page at all.
- Only 14.3% of picks were products running a sponsored listing on that search page, and 83% of those already ranked organically anyway.
In other words, when shoppers ask the assistant to recommend rather than list, it surfaces a noticeably different and often deeper set of products than the search page most sellers are built around. Neither rank nor ad spend appears to be shaping those picks yet.
“We’re seeing the emergence of a third shelf alongside organic search and paid placements. Brands cannot simply buy or rank their way onto it; they need to give Amazon’s AI Alexa enough context to understand when and why their product is the right recommendation.” — Christian Umbach, Co-Founder & CEO, Autopilotbrand.com
An important caveat
Marketplace Pulse is careful to note that this is a single snapshot from one U.S. account, captured early. Note, too, that the source is a vendor that sells AI visibility services. Treat the specific percentages as directional. The broader finding, that the assistant does not simply repeat search rankings, is consistent with how the tool has evolved. Two years ago it mostly returned links to searches shoppers could have run themselves.
What this means for sellers who don’t own the top of search
For most sellers, rank incumbency is the hardest barrier to overcome. The AI shelf is, for now, a surface where that barrier matters less. A product outside the current search winners can appear in an answer where a category leader does not.
Practical steps sellers are taking:
- Write for use cases, not just keywords. The assistant answers questions like “best mattress for side sleepers with back pain.” Listings that state clearly who the product is for, and in what situation, give it more to work with.
- Fill in every structured attribute. Catalog data such as dimensions, materials, compatibility, and certifications is exactly the context an AI system can reason over. Blank attributes are missed chances.
- Address comparisons and objections directly. Bullet points and A+ content that explain how the product differs from alternatives, and who it is not for, help the assistant match intent.
- Mine reviews and Q&A. The questions shoppers ask in your Q&A section are a preview of the questions they’re asking the assistant.
- Test it yourself. Ask Alexa for Shopping “best-of” questions in your category every month and log which products it names. It’s a free, manual version of the study above.
Ads Are Coming to the AI Shelf
If the AI shelf currently rewards context over rank or spend, the obvious question is how long that will last. The early evidence suggests: not indefinitely.
Sponsored prompts inside the assistant
In Q1 2026, Amazon launched Sponsored Products and Brand Prompts inside Rufus. On the earnings call, Amazon disclosed that nearly 20% of shoppers who interact with a sponsored brand prompt continue the conversation about that brand. CEO Andy Jassy explicitly cautioned that “it is early.” The metric also measures continued conversation, not purchases.
Still, it’s one of the first concrete data points any major platform has published on ad performance inside an AI shopping interface. It shows Amazon is building the same kind of paid layer on the AI shelf that it built on search.
ChatGPT went the same direction
Six months earlier, there seemed to be a real alternative. ChatGPT’s Instant Checkout charged merchants a 4% transaction fee and offered broad access without ads as the main discovery mechanism. Per Marketplace Pulse, that model is gone:
- OpenAI launched advertising in ChatGPT in February 2026 to a select group of U.S. advertisers.
- It abandoned Instant Checkout in March, citing execution challenges.
- In May, it opened its ads manager to all U.S. advertisers and dropped its $50,000 minimum spend.
Shopify, meanwhile, launched connector apps for ChatGPT and Claude that let merchants manage their stores inside AI assistants, citing internal data that 83% of its merchants already use ChatGPT. It’s continuing its long-standing choice to embed merchants in whichever consumer surface wins, rather than compete for shoppers directly.
The size of the prize
McKinsey and ICSC forecast U.S. agentic commerce will reach $1 trillion by 2030, citing survey data showing 68% of consumers used at least one AI tool for shopping in the past three months. Today’s assistants sit at the “assisted discovery” end of that range: conversational recommendations and sponsored prompts, not agents that independently execute purchases. But the monetization model for discovery is being set now.
The window, and how to use it
Amazon’s advertising business generated $68.6 billion in 2025, up 22%. Search went through the same arc: it was once mostly organic, then the ad load arrived. Marketplace Pulse’s observation is apt: the sellers learning how the AI shelf selects products now “are the ones who will notice the day that changes.”
Sensible moves while the window is open:
- Invest in the catalog-data and content work that earns organic AI recommendations. This work keeps paying off after ads arrive, just as good listings kept converting after sponsored search took over.
- Run small tests with sponsored prompts where available, with clear success criteria. Measure downstream sales, not just the continued-conversation metric.
- Keep AI-shelf experiments separate from your search PPC budget so you can see their true incremental effect.
Amazon as the Hub: Seller Central Goes Multichannel
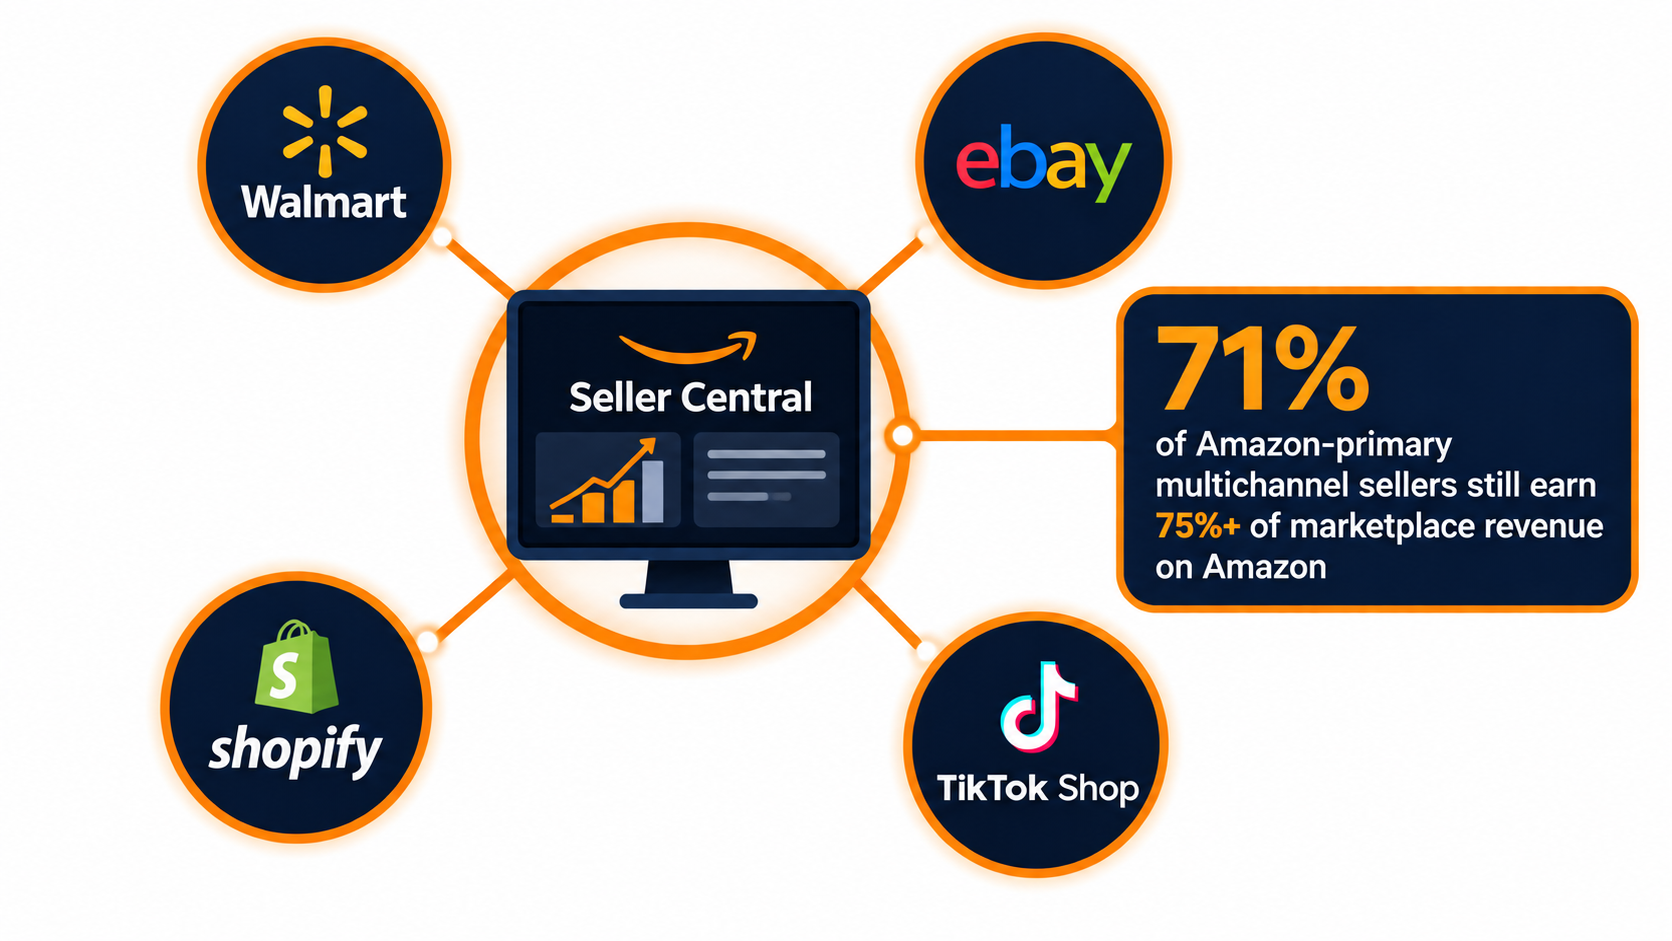
At its Accelerate seller conference in September 2026, Amazon announced something that would have seemed unthinkable five years ago. Sellers will be able to manage their eBay, Shopify, TikTok Shop, and Walmart businesses from inside Seller Central.
What the tools do
According to Marketplace Pulse’s coverage, the new multichannel tools are rolling out gradually to U.S. sellers at no extra cost. They pull listings, orders, and profitability from every connected channel into one workspace:
- Edit a product description once, and Amazon reformats and publishes it to linked listings on eBay, Walmart, and Shopify.
- Shopify and Walmart orders appear alongside Amazon orders and can be fulfilled through Amazon in a few clicks.
- A profitability view shows what each product earns on each channel.
The five-year arc
This is the latest step in a long shift. Five years ago, Amazon was an obstacle to multichannel commerce. FBA charged more to ship off-Amazon orders, unbranded packaging was still in beta, and products priced lower elsewhere could be suppressed (as they still can be). Then came Buy with Prime. At Accelerate 2024, Amazon said Multi-Channel Fulfillment served more than 200,000 U.S. sellers and order volume had grown 70%. In 2025, it announced MCF integrations with Walmart and Shein.
Those earlier steps put Amazon behind other channels as the warehouse. The new tools put it in front of them, as the software sellers use every day. Amazon says the data from other channels won’t inform its retail business. It’s still worth knowing that Amazon can now see not only what sellers charge elsewhere, but how much they sell there.
Multichannel isn’t the same as diversified
Amazon says more than 95% of its sellers sell on multiple channels. But the 2026 Seller Index found that 71% of Amazon-primary sellers active on at least one other marketplace still earn three-quarters or more of their marketplace revenue from Amazon.
That’s the real risk to weigh. The tools will make it easier to run Walmart or eBay listings. But if your entire operation, including listings, inventory, fulfillment, and analytics, runs through one company’s software, you haven’t reduced platform risk. You’ve moved it.
How to use the tools without deepening dependence
- Use them for operational efficiency, not strategy. Syncing listings saves time. It doesn’t replace channel-specific pricing, content, and promotion decisions.
- Keep independent records. Export your cross-channel data regularly so your business history doesn’t live only inside Seller Central.
- Watch the growth channels. Walmart’s U.S. marketplace grew nearly 50% in the first quarter of its fiscal 2027, and its ad revenue grew 46% in 2025 to $6.4 billion, more than twice Amazon’s rate. The base is small, but the trajectory is real.
- Mind price parity. Amazon can still suppress listings priced lower elsewhere. Check any cross-channel pricing strategy against that risk.
TikTok Is a Demand Engine. Measure It in Amazon Branded Searches
Many Amazon sellers have tried TikTok Shop as a second channel. The data suggests that for most, it works best as a demand source for Amazon rather than as a standalone store.
The overlap is tiny, and it runs one way
Marketplace Pulse matched the 10,000 largest sellers on Amazon.com and TikTok Shop by business name. Only 498 appear on both lists, about 5% of either. Among those, a seller’s rank on one platform has almost no relationship to its rank on the other.
The direction matters more. One in five of TikTok Shop’s hundred largest U.S. sellers also ranks among Amazon’s top 10,000. Only one in twenty-five of Amazon’s hundred largest ranks among TikTok Shop’s top 10,000. A brand that succeeds on TikTok is five times more likely to also succeed on Amazon than the reverse.
Why the road is steeper in one direction
Marketplace Pulse’s explanation: “TikTok makes people want things. Amazon is where people buy things.” When shoppers see a product demonstrated in a video, many open Amazon, type the brand name, and buy where their card is on file and delivery is promised. The 2021 case of leggings becoming Amazon’s best-selling clothing item, driven by TikTok videos that couldn’t even link to a product page, showed this before TikTok Shop existed.
Amazon’s own attempts at discovery-driven shopping largely failed. Amazon Live struggled to hold an audience, and Inspire, its TikTok-style feed launched in 2022, was shut down in 2025.
Which products fit
TikTok Shop winners are overwhelmingly products that are worn, applied, or consumed. Among the top 1,000 U.S. products by lifetime sales, more than two-thirds of revenue comes from these categories. These are “personal transformation” products a creator can demonstrate on camera in fifteen seconds.
Most of what sells well on Amazon fails that test. As Marketplace Pulse notes, a replacement charging cable, storage bins, or printer paper are things people search for, not things anyone films. TikTok Shop is also highly concentrated: the top 1% of sellers drive 60% of U.S. GMV.
The practical rule
- If your product can be filmed, meaning it shows a visible result, fund creators and expect much of the return to land on Amazon. Track Amazon branded search volume and brand-term conversions, not just TikTok Shop orders.
- If it can’t be filmed, TikTok probably isn’t a channel for you, and no listing will make it one. Put that budget toward Amazon catalog and AI-shelf work.
- Use Amazon Brand Analytics to watch for spikes in branded search after creator campaigns. That’s the clearest attribution signal most sellers have.
Amazon’s Growth Is Increasingly Happening Outside the Marketplace
One more structural shift is worth understanding, because it affects how much attention and investment the marketplace gets from Amazon itself.
First-party is regaining unit share
Third-party sellers accounted for 60% of paid units sold on Amazon in Q1 2026, down from 61% in Q4 2025 and 62% the quarter before. It’s the first time the metric has fallen for two consecutive quarters since Amazon started reporting it in 2004. For context, between 2013 and 2016 it gained a percentage point every quarter for eleven straight quarters.
Groceries appear to be the biggest factor. Amazon disclosed that perishable sales grew 40x year over year, and its broader grocery business reached $150 billion in gross sales in 2025. Grocery is mostly fulfilled through Amazon’s own network, including Whole Foods, Amazon Fresh, and same-day hubs, so its growth shows up in first-party units.
Where the money is growing
In Q1 2026, online stores fell to 35.4% of Amazon’s net sales, an all-time low since the segment was first broken out in 2016. Third-party seller services edged down to 22.9%. Both grew in absolute terms (online stores up 9% and seller services up 12% on a constant-currency basis), but AWS grew 28% and advertising 22%.
Other parts of Amazon’s commerce business are growing too:
- Amazon Business reached $60 billion in annualized gross sales, up from $35 billion in 2023, about 7% of Amazon’s estimated $830 billion GMV.
- Amazon Haul, the direct-from-China section for items under $20, passed 3,000 sellers after launching in November 2024.
What sellers should take from this
None of this means the marketplace is shrinking. Sellers still account for 60% of units and roughly 69% of GMV. But the steady climb in third-party share has plateaued, and Amazon’s growth story is increasingly told through AWS, advertising, and the AI layer built on top of both.
For sellers, the implication is straightforward. Amazon’s product decisions will increasingly favor surfaces it can monetize, such as ads and AI prompts. Two opportunities follow. B2B buyers through Amazon Business are a growing, often less crowded segment worth pursuing if your products fit. And anyone selling low-priced commodity goods should watch Haul as a direct competitive threat.
Meanwhile, the broader environment is favorable. U.S. e-commerce grew 12.2% in Q2 2026, its fastest in five years, and reached a record 17.1% of all retail spending. The market is growing. The question is who captures it.
A 12-Month Operator Checklist for Amazon Sellers
Taken together, the data points to a clear profile of the sellers who are winning: disciplined on unit economics, aware of where discovery is moving, careful about dependence, and selective about where they compete. Here’s how to turn that into a concrete plan.
Quarter 1: Know your cohort
- Calculate trailing twelve-month contribution margin per unit and TACoS for every SKU, and compare with the prior year.
- Place your business honestly in a cohort: thriving, grinding, consolidating, or distressed.
- Flag every SKU where revenue grew but contribution margin fell. These are your grinding products.
- Rebuild your cash flow forecast around DD+7 disbursement and current fee levels, including the fuel surcharge.
Quarter 2: Fix the catalog for the third shelf
- Audit structured attributes on your top 20 SKUs and fill in every blank field.
- Rewrite bullets and A+ content around use cases, comparisons, and who the product is (and isn’t) for.
- Start a monthly log of which products Alexa for Shopping recommends for the top “best-of” questions in your category.
- Test sponsored prompts on a small budget and measure downstream sales.
Quarter 3: Pressure-test your competitive position
- For each hero product, ask whether a factory-direct competitor could replicate your advantage in one production run.
- Where the answer is yes, consider moving up in price point through bundles, premium variants, or differentiated features.
- Assess international marketplaces where traffic per seller is rising fastest, such as Mexico, Brazil, and the European markets.
- Check whether your products fit Amazon Business buyers.
Quarter 4: Reduce real dependence
- Decide on a target share of revenue from outside Amazon, and measure progress toward it, not just channel count.
- If products can be filmed, test a creator program and track Amazon branded search as the key outcome.
- Use Seller Central’s multichannel tools for efficiency, but keep independent exports of all channel data.
- Keep a cash buffer sized for at least one surprise policy change.
Conclusion: The Marketplace Rewards Operators Now
Amazon selling in 2026 looks different from any earlier period. The seller count is shrinking while shopper traffic grows. Revenue is concentrating among fewer than 8,000 sellers who produce half of U.S. third-party GMV. The composition of the top ranks has shifted toward factory-direct entrants, while U.S. brands hold the highest-value positions through higher price points.
Costs keep rising. Nearly half of sellers named fees as a top concern, a similar share named advertising, and 47% saw margins decline. At the same time, a third discovery shelf has emerged in Alexa for Shopping. For now, it seems to reward catalog context over rank or ad spend, but paid placements are already arriving there.
Amazon is also positioning itself as the operating hub for sellers’ entire multichannel business. That’s convenient, but it can quietly deepen the dependence many sellers say they want to reduce.
Key takeaways
- Traffic per seller is up 25%, but the sellers who remain are more capable. Don’t expect less competition to do your work for you.
- Only 23% of sellers are thriving. Revenue growth without margin growth is a treadmill, not a strategy.
- Measure contribution margin per unit, including ads, as your primary health metric.
- The AI shelf picks mostly outside the organic top 10 in early testing. Catalog depth and use-case content are how smaller sellers can compete there.
- Ads are coming to AI discovery. Build organic AI visibility now, while it still counts for the most.
- Multichannel isn’t diversification if 75% or more of revenue still comes from Amazon.
- TikTok’s value to most Amazon sellers shows up in Amazon branded search, and only for products that can be filmed.
The seller who does well on Amazon now isn’t the one with the most listings or the biggest ad budget. It’s the one who knows exactly what each unit earns, understands where shoppers are discovering products, and makes deliberate choices about where to compete. The data shows the reward for that discipline has rarely been larger. It also shows how few sellers are meeting it.