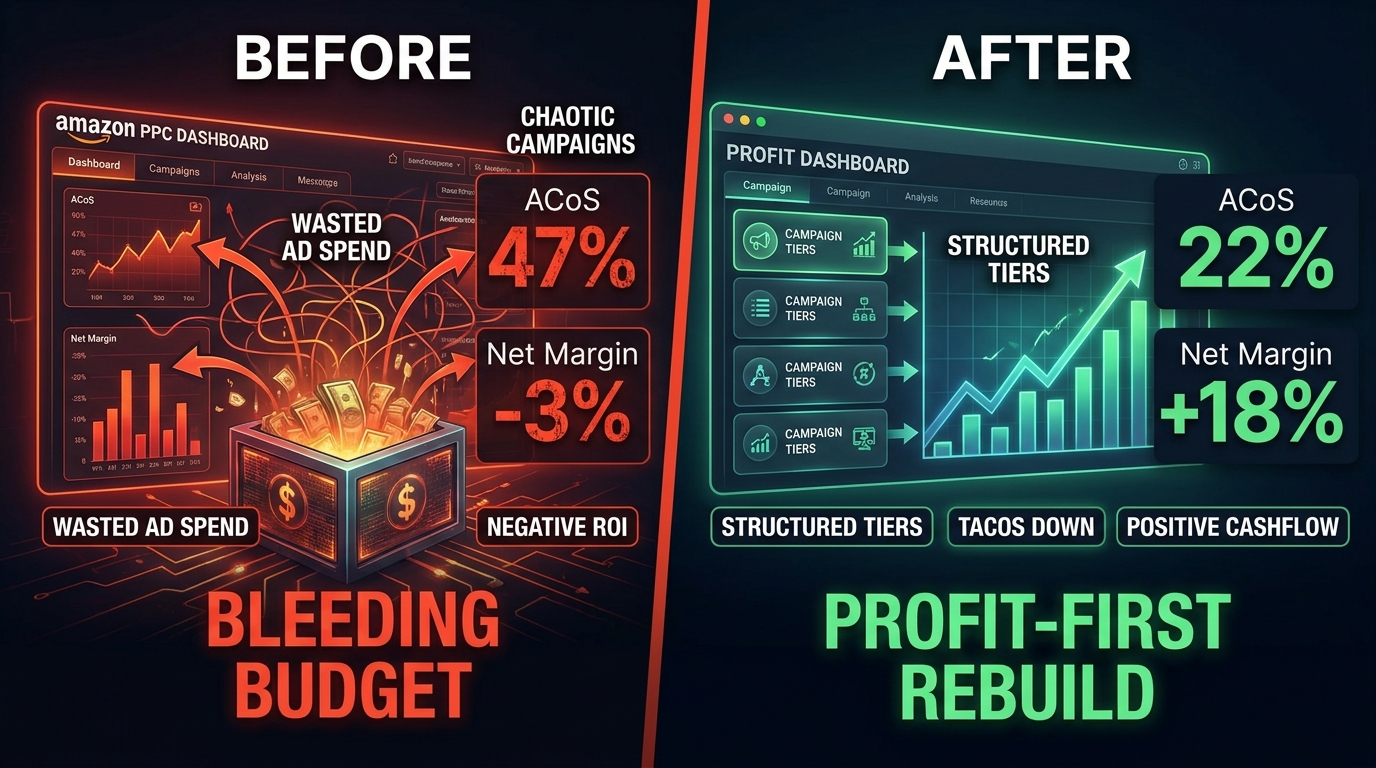

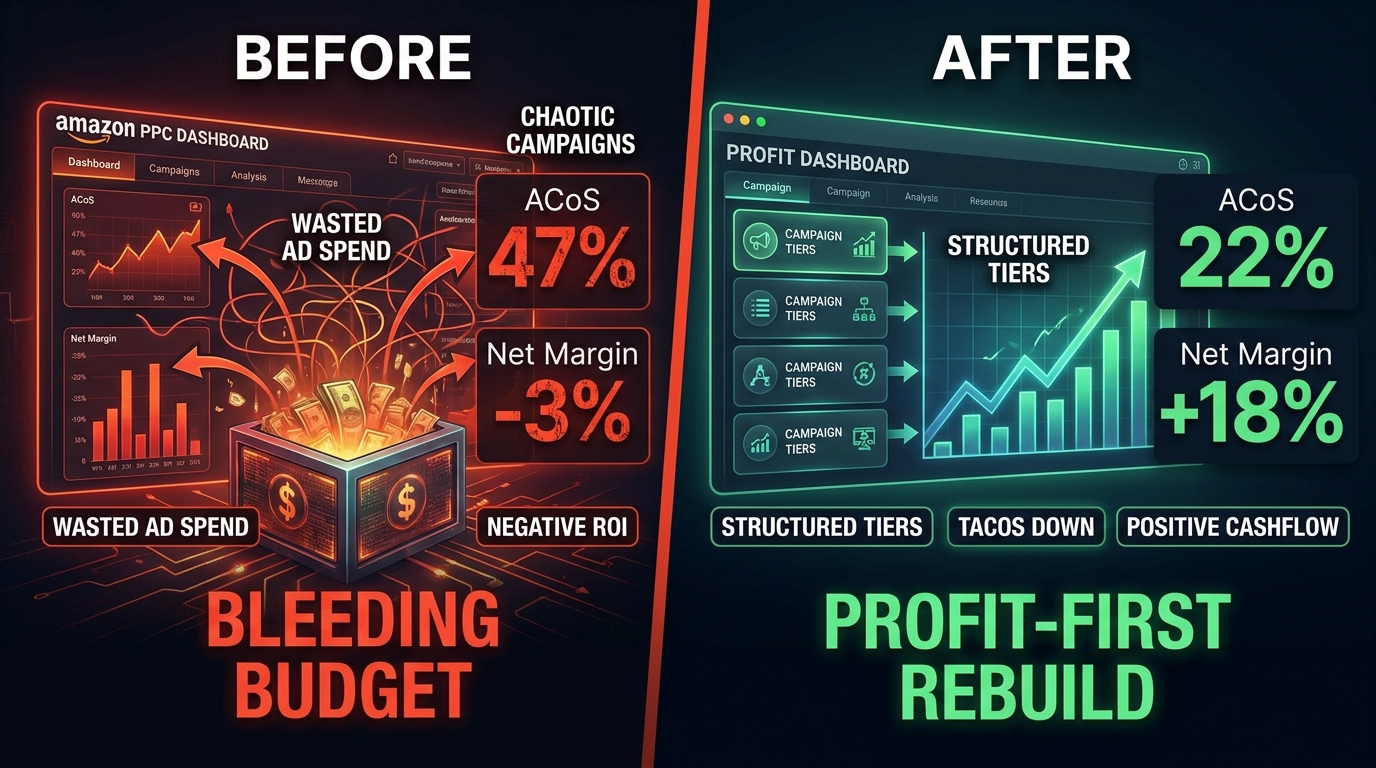
There’s a version of Amazon PPC success that looks great in the dashboard and quietly destroys the business beneath it. Revenue climbs. Impressions are up. ROAS looks acceptable. But when you pull the actual numbers — the landed cost, the FBA fees, the storage accruals, the returns reserve — there’s nothing left. Sometimes less than nothing.
This article is about fixing that. Specifically, it documents what a genuine profit-first account rebuild actually looks like in practice: the audit process, the structural decisions, the bid logic, and the 90-day arc from bleeding account to one that generates measurable, compounding net profit. Not theoretical profit. Real margin.
The fresh angle here is the live framing. Rather than presenting a tidy case study after the fact, this walks through the logic in real time — the decisions, the trade-offs, and the uncomfortable moments when you have to cut spend that looks productive on the surface but is actually costing you money.
If your account is running but you’re not sure it’s actually profitable — or you know it isn’t and you’re not sure where to start — this is the rebuild map.
Why Most PPC Rebuilds Fail Before They Start
The single most common reason account rebuilds fail has nothing to do with bids, keywords, or campaign structure. It’s that sellers and agencies start with the wrong question.
The wrong question: How do I lower my ACoS?
The right question: Which products are actually profitable at current pricing and costs, and what is the maximum I can spend on ads before erasing that profit?
These sound similar. They are not. The first question treats PPC as a media efficiency problem. The second treats it as a margin management problem. That distinction determines everything that follows — which campaigns you build, which keywords you target, how aggressively you bid, and when you scale.
The Misdiagnosis That Costs Sellers the Most
A typical blended account running at 28% ACoS might look fine on paper. Category benchmarks often cite 25-35% as acceptable. But if your true net margin before ads is only 19%, then a 28% ACoS doesn’t mean you’re spending efficiently — it means every single ad-attributed sale is unprofitable.
This is the misdiagnosis: using category ACoS benchmarks as a target instead of your own product’s break-even ACoS as a ceiling. The break-even number isn’t an industry average. It’s a function of your specific COGS, your specific Amazon fees, your specific return rate, and your specific price point. No benchmark replaces it.
The “Scaling Trap”
The misdiagnosis becomes more expensive when sellers interpret rising revenue as permission to scale. Budget goes up. Sales go up. ACoS holds steady. Meanwhile, every additional unit sold at a negative contribution margin accelerates the loss. The account looks busier and more successful by most PPC metrics precisely as it becomes less solvent.
Before a single campaign is touched, the rebuild requires resolving this: know exactly which SKUs are profitable, by how much, and what ACoS threshold represents break-even on each one. Everything else is downstream.
Step 1 — Building the True Unit Economics Foundation
The first phase of a profit-first rebuild isn’t a campaign audit. It’s a spreadsheet. Specifically, a per-SKU contribution margin model that accounts for every variable cost between the customer’s payment and the cash that reaches your bank account.
The Full Cost Stack
Most sellers know their COGS and their referral fee. Fewer account correctly for every layer that erodes the sale price:
- Selling price (net of VAT/tax): What the customer actually pays
- Amazon referral fee: Typically 8-15% of the selling price depending on category
- FBA fulfillment fee: Per-unit weight and dimension-based fee
- Monthly storage fees: Allocated per unit based on average inventory days
- Inbound shipping / freight: Per-unit landed cost from manufacturer to fulfillment center
- Long-term storage / aged inventory fee: If SKUs sit beyond 90 days
- Returns reserve: Your category return rate multiplied by per-unit cost to process
- COGS: Manufactured or sourced cost per unit
When these are all stacked against the selling price, the result is the pre-ad contribution margin. This is the maximum dollar amount you can spend on advertising per unit sold and still break even. Expressed as a percentage of selling price, it becomes your break-even ACoS.
The Break-Even ACoS Formula
The calculation is straightforward once you have the numbers:
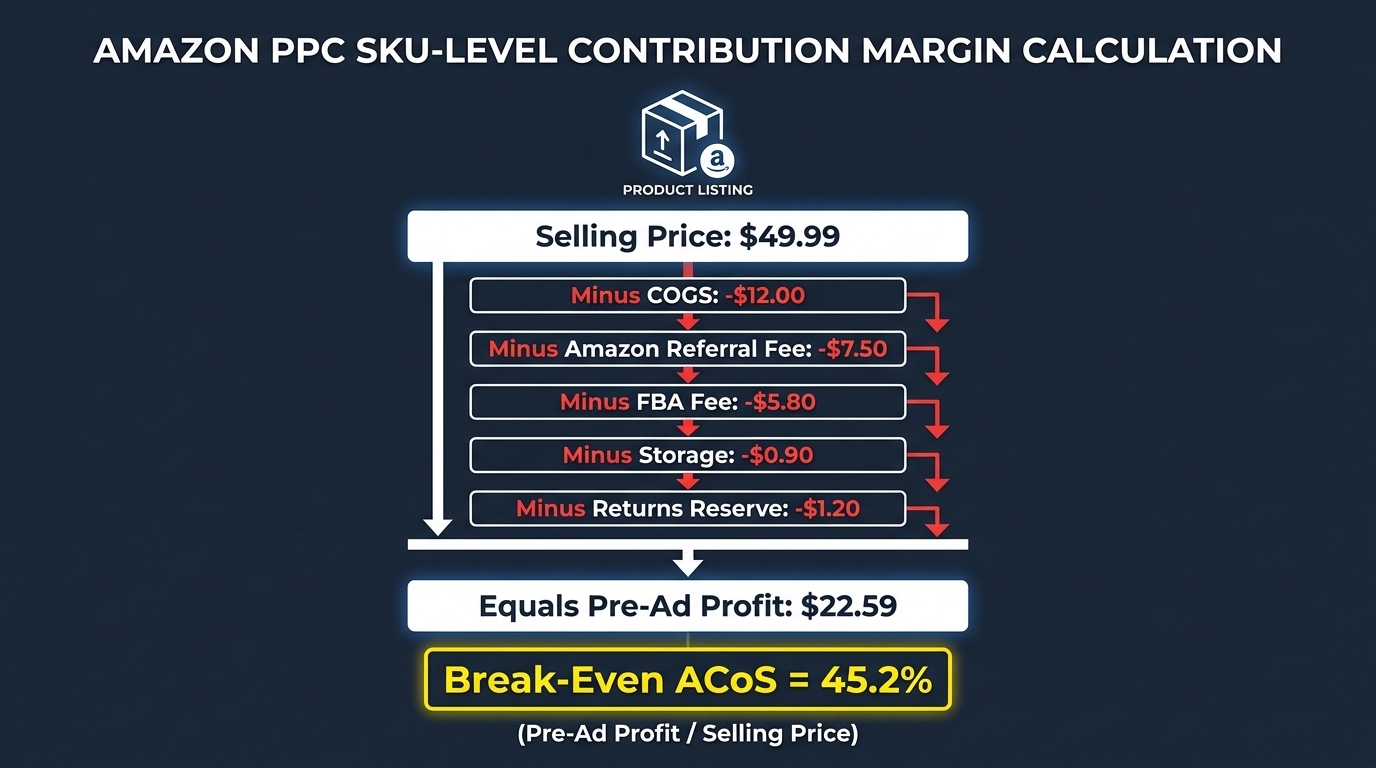
Pre-Ad Profit per Unit = Selling Price − (COGS + Referral Fee + FBA Fee + Storage Allocation + Returns Reserve + Inbound Shipping)
Break-Even ACoS (%) = Pre-Ad Profit ÷ Selling Price × 100
To make this concrete: a product selling at $49.99 with $12.00 COGS, $7.50 referral fee, $5.80 FBA fee, $0.90 storage allocation, and $1.20 returns reserve leaves $22.59 in pre-ad profit. That’s a 45.2% break-even ACoS. You can spend up to $22.59 in ads per unit sold and still not lose money.
But here’s the critical nuance: break-even ACoS is not the target. It’s the ceiling. Running at exactly break-even means every ad-driven sale contributes zero net profit. The target ACoS should be meaningfully below break-even to generate actual margin.
Target ACoS vs. Break-Even ACoS
In a profit-first rebuild, the target ACoS is set based on the profit margin you need the product to generate. If your break-even ACoS is 45% and you need a 10% net margin on each ad-attributed sale, your target ACoS is approximately 35%. The 10-point spread between target and break-even is your designed profit buffer.
This spread widens or narrows depending on product lifecycle stage:
- New launches: Running closer to break-even (or even above it temporarily) to build velocity and rank
- Established products: Target ACoS should be well below break-even to extract margin
- Hero SKUs: Often managed most aggressively for margin; organic rank does the heavy lifting
- Declining SKUs: May need break-even or profit targets lifted to avoid losing money on aging inventory
Once every SKU in the account has this model built — selling price, cost stack, pre-ad margin, break-even ACoS, and target ACoS — you have a profit framework. Every PPC decision from this point is made against that framework.
Step 2 — The Pre-Rebuild Audit: Finding Where the Money Is Actually Going
With the unit economics built, the audit becomes a targeted search for misalignment: spend that is either above the SKU’s target ACoS, or spend that is generating zero sales signal at all.
The Three Buckets of Wasted Spend
In a typical unoptimized Amazon PPC account, wasted spend falls into three distinct categories:
- Irrelevant traffic: Ad spend driven by search terms that are categorically unrelated to the product. These generate clicks but almost never convert. The spend is pure waste.
- Underperforming terms: Search terms that are topically relevant but historically produce ACoS above break-even. These aren’t necessarily dead — some may convert with better copy or listing optimization — but they’re currently unprofitable.
- Duplicate exposure: The same search term triggering spend across multiple campaigns simultaneously. Budget is being consumed by the same keyword in three different campaigns, splitting data, inflating CPC through internal competition, and making it impossible to optimize effectively.
The 90-Day Search Term Pull
The core audit tool is the Search Term Report, pulled for the last 90 days. Sort it first by spend descending. The goal is to identify the highest-spend terms and classify each one:
- Spend with sales below target ACoS: Keep and reinforce
- Spend with sales above break-even ACoS: Reduce bids, flag for listing review
- Spend with sales above target but below break-even: Hold and monitor — these may still serve a volume function
- Spend with zero sales after sufficient impressions: Negative immediately
The threshold for “sufficient impressions” is contextual, but a practical rule: if a search term has consumed more than 1.5x your target cost-per-click (i.e., enough budget for at least one expected conversion at your category conversion rate) and generated zero sales, it earns a negative.
Campaign-Level Overlap Analysis
Beyond the search term report, run a campaign-level overlap check. Pull all active campaigns and flag any scenario where the same keyword or product target appears in more than one campaign without explicit separation logic. Overlapping campaigns are not just redundant — they actively compete against each other in the same auction, driving up your own costs.
In most audited accounts, 20-35% of ad spend is in some form of overlap or structural duplication. This is often the fastest win in a rebuild: eliminating duplication and consolidating spend into the most efficient campaign for each keyword reduces CPC and often improves conversion rate simultaneously, because the remaining campaign’s quality signals become stronger.
The Spend Classification Matrix
By the end of the audit, you should be able to classify every dollar of the last 90 days of spend into one of four boxes:
- Box A — Profitable and efficient: Below target ACoS, converting. Scale.
- Box B — Converting but too expensive: Above target, below break-even. Reduce bids or improve conversion.
- Box C — Spend with no conversion data yet: Too early to judge. Give it a defined test window.
- Box D — Confirmed waste: Clicks, no sales, sufficient data. Cut immediately.
In a typical audit, Box D spend often represents 25-40% of total budget. That’s the number that makes a first conversation with a client or partner uncomfortable — and that also makes the fastest case for why the rebuild is necessary.
Step 3 — Campaign Architecture: Structure That Serves Profitability
The way most accounts are structured is the opposite of what a profit-first approach requires. Campaigns are often built around convenience — one auto campaign per product, maybe a broad and an exact, a Sponsored Brands campaign pointing at the store. Budget is set once and mostly left. Match types bleed into each other. Search terms from auto campaigns never graduate to manual.
Structural reform is not optional in a profit rebuild. The campaign architecture determines whether you have control over where your budget goes and what you learn from it.
The Separation Principle
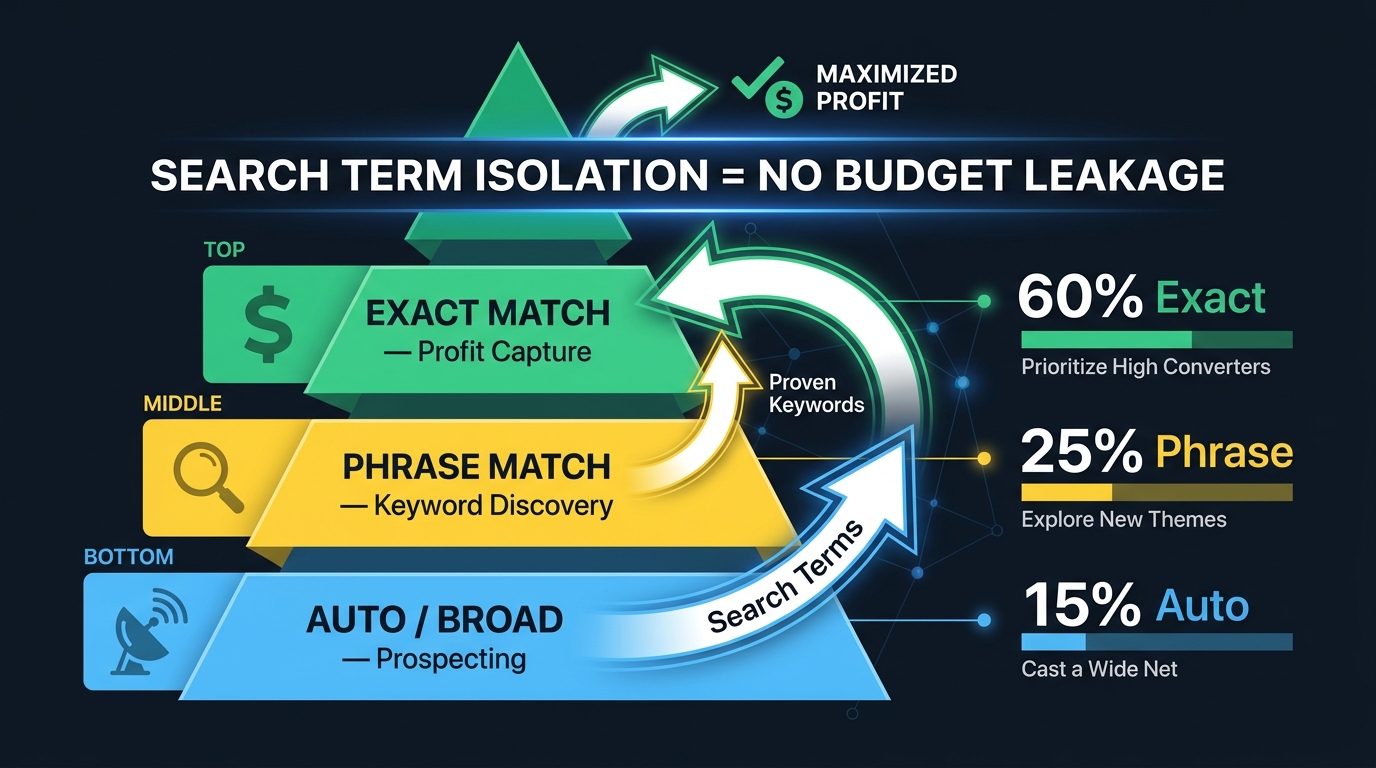
The foundational rule of a profit-first structure is: every campaign should have one defined role, and campaigns with different roles should never share budget or search term coverage.
This produces a three-tier structure:
Tier 1 — Profit Capture (Exact Match)
These campaigns contain only exact-match keywords that are either already converting at or below target ACoS, or that have enough historical data to confidently bid. They receive the majority of the budget allocation — in a mature rebuild, typically 55-65% of total ad spend — because they drive the most predictable, most profitable traffic.
Bidding on Tier 1 campaigns is data-driven and tight. Bids are set based on the target ACoS, the known conversion rate for the keyword, and the average order value. They are adjusted weekly based on the previous week’s data.
Tier 2 — Discovery (Phrase Match)
Phrase match campaigns serve as the middle layer: they’re intentional enough to limit irrelevant traffic but broad enough to surface new converting search term variations. Budget allocation is typically 20-30% of total spend.
The critical operating rule for Tier 2: every week, the search term report from these campaigns is reviewed. Any term that converts at or below target ACoS is promoted to Tier 1 as an exact match keyword and simultaneously added as a negative to the Tier 2 campaign — so that campaign stops spending on it and all future spend on that term goes through the controlled, exact-match bid.
Tier 3 — Prospecting (Auto / Broad)
The prospecting tier is intentionally starved. It receives 10-15% of total budget. Its only job is to find search terms that Tier 2 hasn’t captured yet. Auto campaigns are run with conservative bids and maximum negative keyword lists applied from the outset.
The prospecting tier’s performance is not evaluated on ACoS. It is evaluated on whether it produces qualifying search terms that graduate to Tier 2 or Tier 1. If it does, it earns continued investment. If it stops producing new converting terms, its budget is reallocated to Tier 1.
Product Targeting as a Separate Campaign Type
ASIN and category product targeting deserves its own campaign layer, outside the keyword match type structure. Product targeting (competitor ASINs, complementary ASINs, category-level) has different conversion dynamics and different competitive economics than keyword traffic. Running it in the same campaigns as keyword targeting muddies both data sets.
Separate ASIN targeting campaigns should be audited against their own break-even ACoS thresholds, since the typical conversion rate from ASIN targeting is often lower than from keyword search intent — meaning you may need a lower bid ceiling to stay profitable.
Step 4 — Bid Strategy Through a Profit Lens
Once the structure is in place, bid setting becomes a math exercise rather than an intuition exercise. For profit-first PPC, every bid is derived from three inputs: the target ACoS, the keyword’s historical conversion rate, and the product’s average order value.
The Bid Derivation Formula
Maximum CPC = Target ACoS × Average Order Value × Keyword Conversion Rate
Working through a practical example: target ACoS of 22%, average order value of $49.99, keyword conversion rate of 12%. Maximum CPC = 0.22 × $49.99 × 0.12 = $1.32. If the current bid for that keyword exceeds $1.32, it’s structurally impossible for that keyword to perform at target ACoS — regardless of how often you optimize.
This formula is particularly revealing when applied to new launches, where sellers often set bids based on competitive landscape research rather than their own unit economics. A competitive keyword may require a $2.50 bid to win impressions, but if the math says maximum profitable CPC is $1.32, there are only two responses: accept above-target ACoS for the launch period with a plan to recover, or find a lower-competition keyword variant where the math works.
Dynamic Bidding Settings: A Profit-First Interpretation
Amazon’s dynamic bidding options — “Down only,” “Up and down,” and fixed bids — are often used without a clear understanding of what they do to cost control. From a profit-first perspective:
- “Down only”: Amazon may reduce your bid when it predicts lower conversion likelihood. This is the safest option for Tier 1 campaigns where you’ve already set the bid at your maximum profitable CPC. You don’t want the algorithm bidding above your ceiling.
- “Up and down”: Amazon can increase bids by up to 100% at top of search placement. This effectively doubles your CPC ceiling without your permission. Unless your conversion rate at top of search is demonstrably higher and you’ve factored that into the bid math, this setting destroys cost control.
- Fixed bids: Most appropriate for prospecting (Tier 3) where you want absolute spend control. The risk is lower impression volume, but that’s acceptable when the goal is controlled discovery rather than reach.
Bid Adjustment Cadence
Bid adjustments in a profit-first rebuild follow a structured weekly cadence, not reactive daily adjustments. The weekly review follows a simple rule set:
- Keywords at or below target ACoS for the past 7 days: increase bid by 10-15%
- Keywords above target ACoS but below break-even: reduce bid by 10-15%
- Keywords above break-even ACoS: reduce bid by 20-25% or pause pending review
- Keywords with zero sales and spend above the single-conversion threshold: negative and reallocate budget
The advantage of a rule-based cadence is that it removes emotion from bid management. It also creates an audit trail: every bid change has a documented reason that connects back to the profit framework established in Step 1.
Step 5 — Sponsored Products vs. Brands vs. Display: Allocating Budget by Profitability Role
A profit-first rebuild requires each ad format to earn its budget allocation by demonstrating a specific, measurable contribution to the profit goal — not just to revenue or impressions.
Sponsored Products: The Profit Engine
In virtually every account, Sponsored Products is where the most direct, measurable profitability lives. It captures bottom-of-funnel intent: shoppers searching for exactly what you sell. The click-to-sale path is short. The attribution is clean. The ACoS data is actionable.
For profit rebuilds, Sponsored Products should receive the majority of budget — typically 70-80% of total ad spend — and should be the first format to have profit-based targets applied. The three-tier structure described in Step 3 is built entirely around Sponsored Products.
Key metrics that differentiate profitable SP management from average SP management include conversion rate at the keyword level (not just the campaign level), click-through rate by placement, and cost-per-click trend week over week for high-spend keywords.
Sponsored Brands: Profitable When Assigned the Right Job
Sponsored Brands campaigns — headline search ads and especially Sponsored Brands Video — are frequently either over-invested or completely underutilized. The profitability of SB depends almost entirely on what role it’s assigned.
Where SB earns its budget in a profit-first rebuild:
- Brand defense: Capturing branded searches that would otherwise go to competitors. The cost here is usually low and the margin protection is high.
- Video on competitive keywords: SB Video has historically outperformed standard SB ads on competitive non-branded terms, often with better click-through rates and lower CPC relative to SP for the same keyword.
- Multi-ASIN cross-sell: Driving shoppers who found one product toward a higher-margin variant or complementary SKU.
Where SB does not earn its budget: broad awareness targeting with no conversion intent signal, or campaigns duplicating the keyword coverage already handled by Sponsored Products without additive reach.
Sponsored Display: The Most Misunderstood Format
Sponsored Display has the most variable profitability profile of the three formats and is also the most frequently misallocated. The critical distinction is between SD retargeting and SD prospecting:
SD Retargeting (remarketing to shoppers who viewed your product page or similar products) tends to be profitable when the product has strong conversion rates. If someone viewed your listing and didn’t buy, a retargeting touchpoint at a lower placement can close the sale at competitive cost.
SD Prospecting (targeting by audience segment or category) typically has the highest CPC and lowest conversion rate of any Amazon ad format. Unless you are a large brand investing in upper-funnel awareness with explicit intent to build brand equity, SD prospecting is often the first format to cut in a profit rebuild.
A practical allocation for a profit-first account in rebuild mode: 75% Sponsored Products, 15% Sponsored Brands (weighted toward video), 10% Sponsored Display (exclusively retargeting). Expand Display prospecting only after SP and SB are operating at target ACoS and there is surplus budget available.
Step 6 — The 90-Day Rebuild Timeline: Phase by Phase
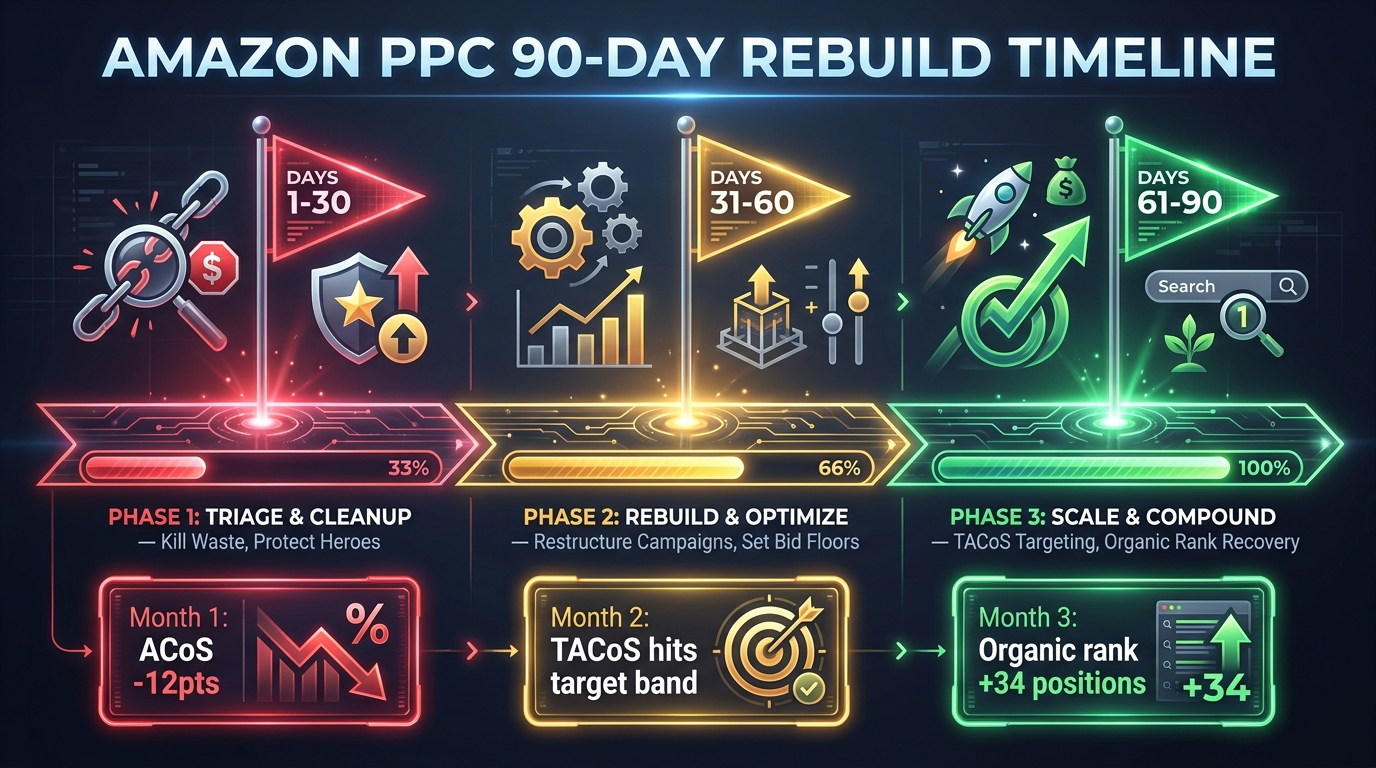
The rebuild doesn’t happen all at once. Attempting to restructure every campaign, adjust every bid, and add thousands of negatives in week one creates more chaos than it resolves. The 90-day phased approach gives the account time to stabilize between changes and allows each phase to inform the next.
Phase 1: Triage and Stabilization (Days 1–30)
The first 30 days are not about optimization. They are about stopping the bleeding and establishing a clean baseline. The actions are deliberately conservative:
- Apply Box D negatives immediately (confirmed waste from the audit). This single action typically reduces spend by 20-30% within the first week without touching any campaign structure.
- Pull all campaigns off “Up and down” dynamic bidding. Switch to “Down only” across the board to establish a firm CPC ceiling.
- Reduce bids on all keywords above break-even ACoS by 20-25%. Do not pause — removing a keyword from auction entirely can cause organic rank drops on that term if it was supporting sales velocity. Reduce, don’t eliminate.
- Set daily budgets based on revised spend levels (post-waste elimination) rather than historical totals. Many accounts find they can maintain sales volume at 60-70% of previous spend once waste is removed.
- Conduct the SKU profitability review and flag any products where the break-even ACoS math makes profitable PPC structurally impossible at current pricing. These SKUs may need a pricing adjustment before PPC can support them.
Expected Phase 1 outcomes: ACoS down 8-15 percentage points, total spend reduced by 20-35%, overall sales volume dips slightly but total profit improves. The account may look worse by revenue metrics for two to three weeks. This is expected and should be communicated clearly to any stakeholder who monitors dashboards.
Phase 2: Structural Rebuild and Optimization (Days 31–60)
With the waste removed and bids stabilized, Phase 2 rebuilds the campaign architecture from the ground up. This is the most time-intensive phase:
- Build the three-tier structure for all hero and core SKUs. Migrate converting exact match keywords from existing campaigns into new Tier 1 campaigns with clean bid mathematics.
- Set up Tier 2 phrase campaigns with the correct negative structure to prevent search term bleed between tiers.
- Launch minimal-budget Tier 3 auto campaigns for any SKUs that don’t yet have established keyword sets.
- Conduct the first formal search term review. Any term from Phase 1’s Tier 2/3 activity that has converted at or below target ACoS gets promoted to Tier 1.
- Reallocate saved budget (from Phase 1 waste reduction) into Tier 1 exact match campaigns for the highest-margin SKUs.
Expected Phase 2 outcomes: TACoS begins declining as organic sales start recovering. ACoS should be approaching or at target range for most SKUs. Tier 1 campaign conversion rates typically improve as data becomes less diluted.
Phase 3: Scaling and Compounding (Days 61–90)
Phase 3 is where profitability becomes visible and the case for measured scaling becomes clear:
- For SKUs operating at or below target ACoS, begin increasing Tier 1 bids incrementally (10-15% per week) and expanding budget to capture more volume at the proven profitable efficiency.
- Expand Tier 2 with new keyword variations identified from the Phase 2 search term data.
- Review Sponsored Brands and Display campaigns against the profitability framework. Cut or restructure any that are above break-even ACoS without a clear strategic justification (brand defense, new-to-brand acquisition).
- Begin evaluating TACoS bands to determine how aggressively to grow.
Expected Phase 3 outcomes: Net profit margin improved by 8-18 percentage points versus pre-rebuild baseline. Total sales volume may still be below pre-rebuild peak, but profit per unit sold is significantly higher. TACoS should be within or approaching target band.
Step 7 — Scaling with TACoS Bands
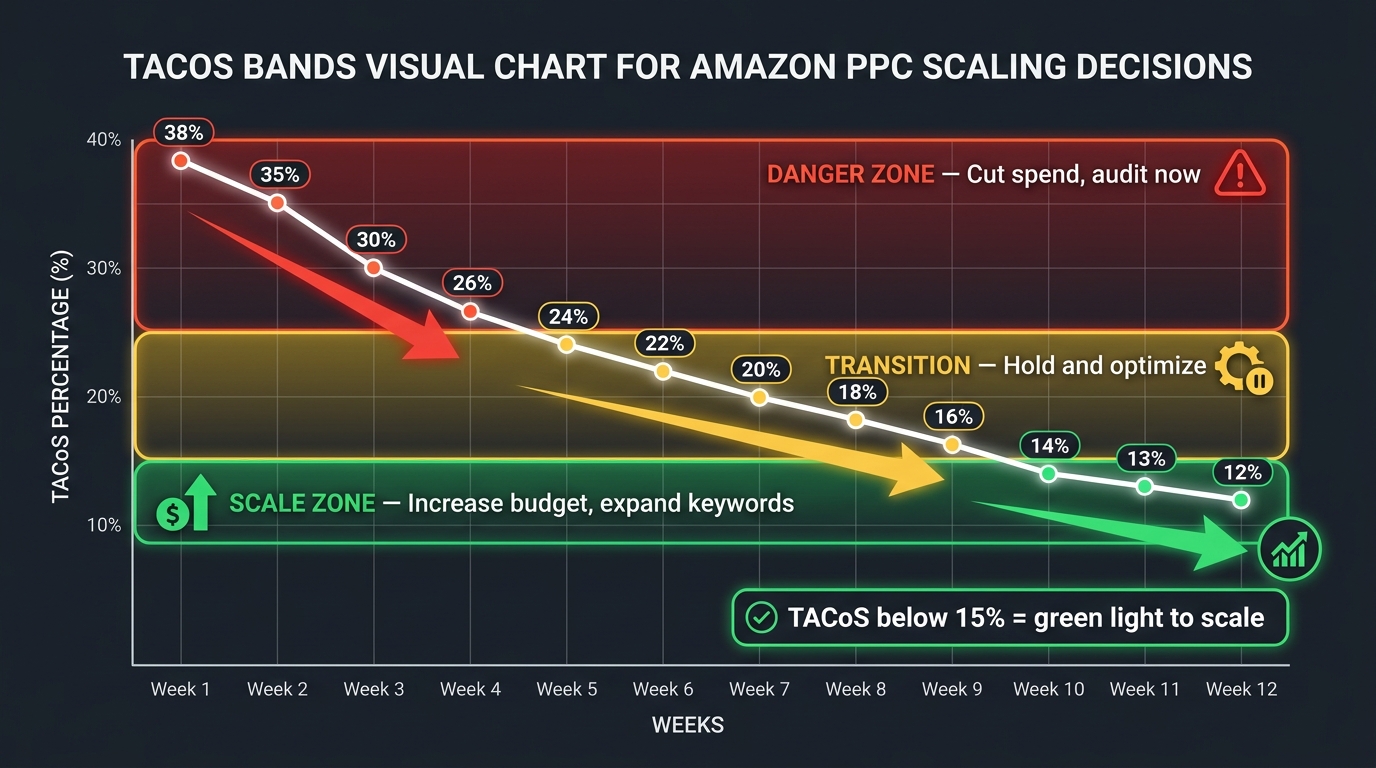
ACoS tells you whether your ads are profitable relative to the sales they directly attribute. TACoS — Total Advertising Cost of Sales — tells you whether your overall account is moving in the right direction. It is calculated as ad spend divided by total sales (organic plus paid).
TACoS is the metric that connects PPC investment to business health in a way ACoS cannot. As organic rank improves and organic sales grow (driven by the sales velocity that good PPC generates), TACoS declines even if ad spend holds steady. Conversely, if organic sales are flat and you increase ad spend, TACoS rises — warning you that the account is becoming more dependent on paid traffic rather than building sustainable organic presence.
Defining Your TACoS Bands
TACoS targets are not universal. They depend on product lifecycle stage and the margin structure established in Step 1. However, a practical three-band framework applies to most accounts:
- Red Band (TACoS 25%+): The account is spending too much on ads relative to total revenue. Organic rank is weak, margins are being eroded. This is triage territory — reduce spend, audit structure, reinforce negatives.
- Yellow Band (TACoS 15-25%): The account is in transition. Organic rank is recovering. Hold ad spend steady, focus on optimizing toward target ACoS, allow organic growth to pull TACoS down naturally.
- Green Band (TACoS 8-15%): Organic rank is contributing meaningfully. Ads are profitable. This is the window to scale — increase budget on Tier 1 campaigns, expand keyword coverage, consider expanding to new markets or product variants.
When to Scale and When to Hold
The scaling trigger in a profit-first rebuild is not a revenue target or a rank position. It is a TACoS reading: once TACoS has been in the green band for two consecutive weeks, and Tier 1 campaigns are operating at or below target ACoS, increasing Tier 1 bid and budget by 15-20% is justified. If TACoS rises back toward the yellow band following the increase, hold at the new level and allow organic catch-up before scaling again.
This creates a staircase scaling pattern rather than an aggressive ramp. It’s slower than maximizing impression share immediately, but it preserves the profit economics that the rebuild established. Every scale increment is tested against the TACoS band before the next increment.
TACoS Dayparting: An Advanced Lever
For accounts with sufficient data (at least 90 days of hourly impression and conversion data), dayparting overlays can further improve TACoS by concentrating ad spend in windows when conversion rates are highest. Amazon’s Marketing Stream API surfaces hourly data that reveals intra-day patterns — for many categories, conversion rates are significantly higher during certain hours and lower in others.
Budget rules that reduce spend by 20-30% during low-conversion windows and restore full budget during peak windows effectively improve ACoS without changing bids, keyword coverage, or ad creative. In accounts where this is implemented, a 3-7% TACoS improvement in the first 30 days is common. The key requirement is enough data to identify reliable patterns rather than noise.
Step 8 — The Organic Halo: How PPC Rebuilds Compound Into Rank Recovery
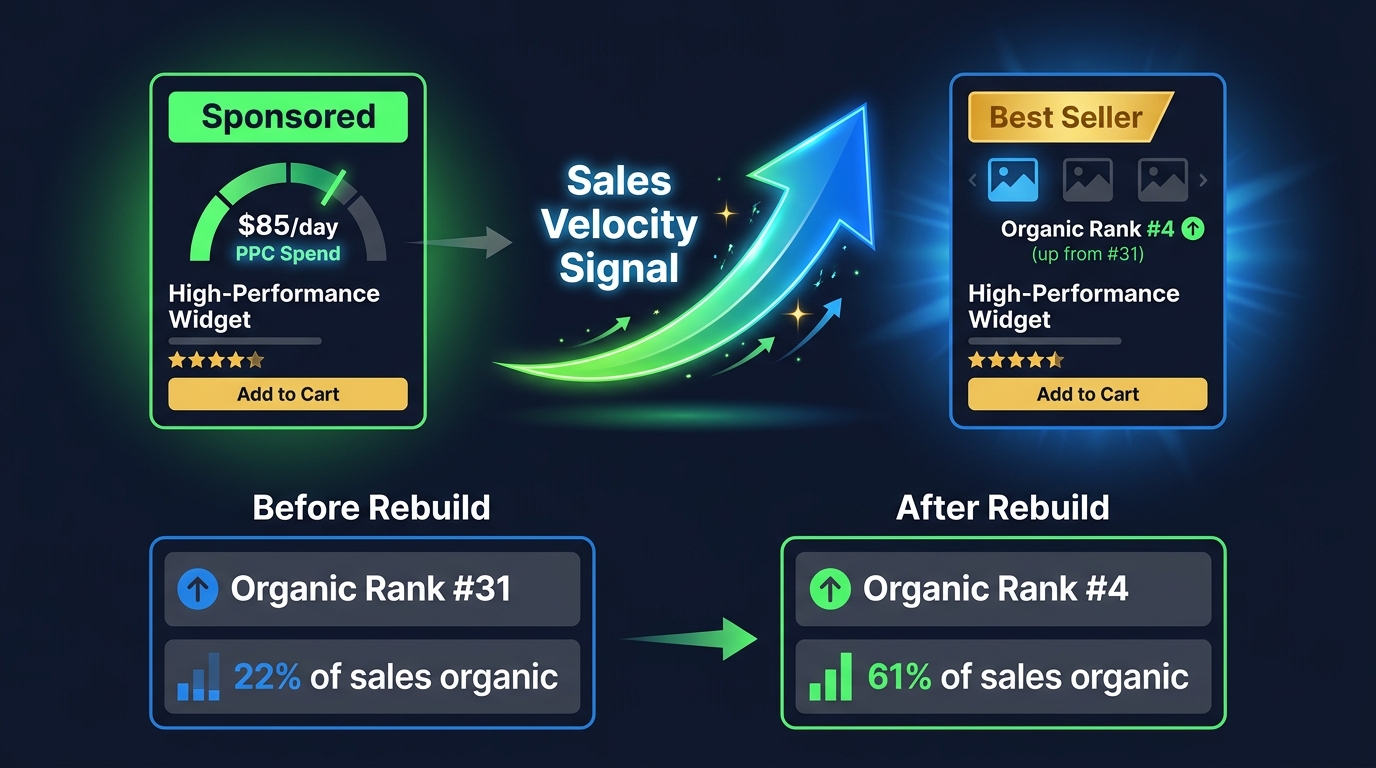
One of the most important and most underappreciated dimensions of a profit-first PPC rebuild is its impact on organic ranking. Sellers who evaluate their rebuild solely on ACoS and ad efficiency miss roughly half the value it creates.
How Amazon’s Algorithm Reads Paid Sales Velocity
Amazon’s ranking algorithm weights sales velocity heavily. Units sold per day, conversion rate, and the rate at which a product closes searches — all of these signal relevance and demand to the algorithm. Crucially, this signal does not distinguish between organic and paid sales in all contexts. Consistent, converting PPC traffic on specific keywords contributes to sales velocity that supports organic ranking for those terms.
This is the halo effect: the organic rank gains that accumulate from sustained, targeted PPC spend. When the PPC is structured around specific high-intent keywords (as in the Tier 1 exact match approach), the organic rank gains are concentrated on precisely the terms where you most want to appear — the ones you’ve already identified as converting profitably.
The Profitability Compounding Mechanism
Here is why the halo effect matters enormously for the profit math: every click that comes through organic ranking is free. As organic rank improves and organic clicks grow, the ratio of paid-to-total clicks shifts. Fewer sales require ad spend to generate. TACoS falls. Per-unit contribution margin improves — not because costs went down, but because the effective advertising spend per unit sold decreased.
In a well-executed rebuild, the organic halo typically becomes visible at 4-6 weeks and shows meaningful rank movement in the 8-12 week range. A product that enters the rebuild ranked organically at position 35 for its primary keyword might exit 90 days later at position 8-12. At that rank, organic clicks can represent 40-60% of total traffic — clicks that cost nothing.
Protecting the Halo: What Not to Do
The halo effect can be damaged by choices that feel profitable in the short term:
- Cutting spend too aggressively: If you drop PPC spend on a keyword below the threshold needed to maintain sales velocity, organic rank can slip. The correct approach is reducing wasteful spend while protecting spend on the specific keywords tied to organic rank gains.
- Over-rotating toward broad match: Broad match generates sales across many search terms rather than concentrating velocity on specific terms. This dilutes the ranking signal for your target keywords.
- Pausing and restarting campaigns: Campaign pauses break the sales velocity signal to the algorithm and can result in ranking drops that take weeks to recover. Reduce bids rather than pausing whenever possible.
The Profit-First Metrics Dashboard
A profit-first account needs a metrics dashboard that is organized around profit, not traffic. Most Amazon seller dashboards — both native and third-party — default to revenue, clicks, and impressions. These are useful but insufficient for managing a profit-first account.
The Seven Metrics That Actually Tell the Story
- 1. Net contribution per SKU per week: Pre-ad margin minus actual ad spend divided by units sold. This is the actual cash generated per product per week after every cost. If this number is positive, the SKU is working. If negative, it needs attention.
- 2. ACoS vs. break-even ACoS per campaign: Not blended account ACoS. Campaign-level ACoS compared to the break-even for the SKUs in that campaign. A campaign above break-even ACoS is losing money per sale, regardless of its absolute ACoS number.
- 3. TACoS trend (weekly): A 7-day rolling TACoS tracked weekly shows whether the account is building organic momentum or becoming more dependent on paid traffic.
- 4. Organic rank position for top 5 keywords: Tracked weekly for each hero SKU. This is the leading indicator of whether the halo effect is working.
- 5. Keyword-level conversion rate trend: Conversion rate changes for Tier 1 keywords indicate whether listing quality is supporting the PPC investment. Declining conversion rates on stable keywords is a listing problem, not a PPC problem.
- 6. Search term graduation rate: How many new search terms moved from Tier 3 to Tier 2 to Tier 1 in the past week. This measures whether the keyword discovery pipeline is functioning.
- 7. Wasted spend ratio: Ad spend on Box D terms (confirmed waste) as a percentage of total spend. This should trend toward zero over the first 60 days and stay there.
The Weekly Review Ritual
These seven metrics form the basis of a 45-minute weekly review that drives every PPC decision. The review follows a fixed sequence: contribution margin first, ACoS vs. break-even second, TACoS trend third, organic rank check fourth, conversion rate anomaly scan fifth, search term graduation sixth, wasted spend audit last. Every decision made in the review connects back to a metric, and every metric connects back to the profit framework from Step 1.
The value of the structured review is not just discipline — it’s the audit trail. When something goes wrong (and in active PPC accounts, something always eventually does), the weekly log allows you to identify exactly when the change happened and what decision preceded it.
The Hard Conversations a Profit-First Rebuild Requires
Transitioning an account to profit-first management is not purely a technical exercise. It requires conversations that most sellers — and many agencies — prefer to avoid.
Revenue Will Likely Drop Before It Recovers
When you eliminate wasted spend, remove Box D terms, and reduce bids on above-break-even keywords, total sales volume typically drops in the first 2-4 weeks. This is predictable and usually temporary, but it registers on every reporting dashboard as a decline. If stakeholders are measuring success by revenue, the rebuild can look like failure in month one.
The fix is establishing in advance that the success metric during a profit rebuild is contribution margin, not revenue. Revenue is a trailing indicator of market fit; contribution margin is the current indicator of business health.
Some SKUs Should Not Be Advertised
The unit economics analysis in Step 1 sometimes reveals products where the break-even ACoS is so low — 8%, 10%, 12% — that no realistic bid strategy can generate profitable traffic. These products may have margins too thin for PPC to support, or pricing that hasn’t been updated to reflect rising costs.
The profit-first answer is direct: SKUs that cannot support profitable advertising should either have their pricing adjusted to create margin, or be removed from PPC and supported only by organic. Running ads on structurally unprofitable products to “maintain visibility” costs money on every sale and never gets better without a pricing or cost change.
Metrics Inertia Is Real
Many accounts are optimized for the metrics that are easiest to see — total revenue, impressions, click-through rate — because those are what agencies historically reported and what dashboards default to. Shifting to contribution margin as the primary metric requires that everyone touching the account agrees on what “good” looks like. Without that alignment, a profit rebuild will face resistance at the first month-over-month revenue comparison.
From Ad Spend to Ad Investment: The Mindset Shift That Lasts
The deepest change a profit-first rebuild produces is not structural or technical. It’s conceptual. It changes the way you evaluate every future PPC decision.
Ad spend is a cost. You minimize it while achieving necessary reach. Ad investment is capital allocated to generate a known return. You grow it deliberately as the return is verified. Almost every failing Amazon PPC account is treating investment as spend — deploying budget because budget exists, scaling because revenue is rising, maintaining campaigns because they’ve always been there.
A profit-first rebuild forces you to answer a question that feels basic but is often skipped: what is this dollar of ad spend actually returning, in actual net profit, after every cost? When you can answer that question at the campaign level, the keyword level, and the SKU level simultaneously, you have an account that earns its budget rather than consuming it.
Actionable Takeaways for the Rebuild
- Build the unit economics model before touching any campaign. Know your break-even ACoS per SKU. Every bid decision is downstream of this number.
- Run a 90-day search term audit and classify spend into four boxes (profitable, borderline, untested, confirmed waste) before making structural changes. Fix waste first.
- Implement the three-tier campaign structure: Exact (Profit Capture) → Phrase (Discovery) → Auto (Prospecting). Each tier has one role and one budget allocation.
- Derive maximum CPC from the formula: Target ACoS × AOV × Conversion Rate. Any keyword bidding above this ceiling cannot be profitable.
- Use TACoS bands, not ACoS targets alone, to make scaling decisions. Scale into green band; hold in yellow; triage in red.
- Track organic rank for your top keywords weekly. The halo effect is half the value of a good PPC rebuild and most sellers never measure it.
- Run a fixed 7-metric weekly review. Decisions should come from the review, not from reactive dashboard checking.
- Be prepared for revenue to decline in Phase 1. Communicate ahead of time that the success metric is contribution margin, not top-line sales.
PPC that is built around profit produces a different kind of account than PPC built around traffic. It grows more slowly at the start, looks less impressive in the first few weeks, and requires more deliberate management throughout. But it compounds differently. The organic rank gains stack. The wasted spend stays eliminated rather than gradually creeping back. The contribution margins are documented and real. And when you scale, you’re scaling something that works — not something that works as long as you keep funding it.
That’s the difference between running ads and running an ad investment.