

There is a version of the AI automation conversation happening in most boardrooms right now that goes roughly like this: someone presents a compelling use case, leadership approves a pilot, a team spends three to six months building something, and then — nothing measurable comes back. The project is neither a declared success nor a declared failure. It just sits there, consuming maintenance hours, while the original business case gathers dust.
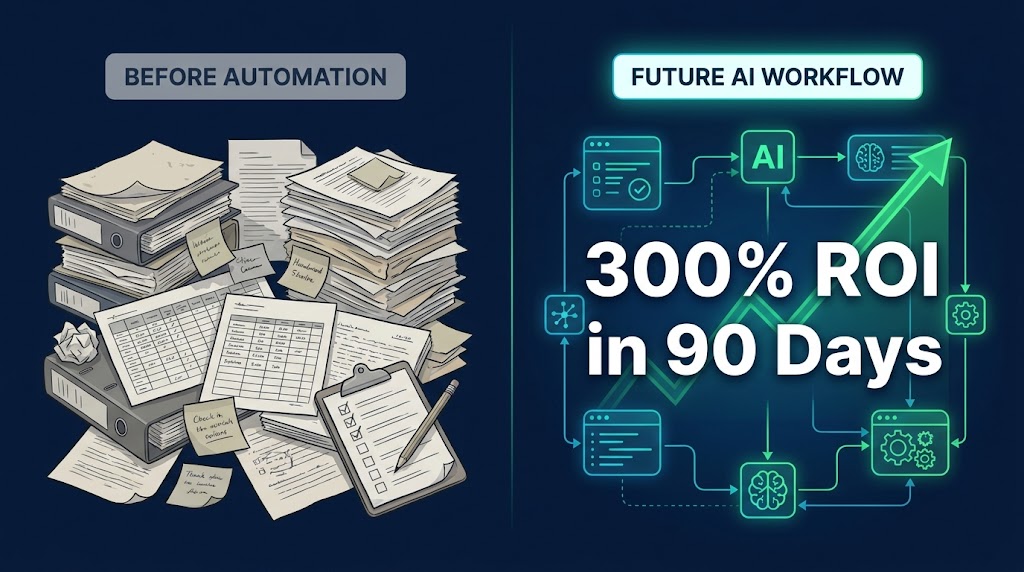
This is not a technology problem. It is a sequencing problem. The organizations seeing strong, fast returns from AI process automation in 2026 are not using fundamentally better tools than everyone else. They are making smarter choices about which processes to automate first, how to measure returns accurately from day one, and how to structure implementation so that value is visible within 90 days — not 18 months.
The data supports a narrower claim than most vendors will admit: AI automation that targets the right processes, in the right order, with the right measurement framework, achieves payback in three to six months. Micro-automations can recover their cost in under 60 days. Three-year ROI benchmarks for well-implemented intelligent automation sit at 300% to 330%. And 84% of organizations that have done this correctly report positive returns.
The organizations in the other 16%? Almost all of them made the same set of identifiable mistakes. This post is about making sure you are not one of them.
What follows is not a vendor comparison or a technology overview. It is a practical, numbers-grounded framework for selecting processes, structuring a 90-day sprint, calculating honest ROI, and building the kind of measurement system that keeps leadership engaged long after launch day.
Why Speed-to-ROI Has Become the Only Metric That Matters in 2026
Three years ago, it was acceptable for an AI automation initiative to spend 12 to 18 months in “build and learn” mode before producing measurable business outcomes. Enterprise AI was still a relatively new capability, implementation teams were scarce, and the organizational patience for long investment cycles was higher.
That tolerance has largely evaporated. According to S&P Global research, 42% of companies scrapped most of their AI initiatives after failing to see returns within expected timeframes. A RAND analysis found that 80.3% of AI projects deliver no measurable business value — not because the technology failed, but because the selection, scoping, and measurement decisions upstream were wrong. MIT’s analysis found that 95% of generative AI pilots never successfully scale past the initial test environment.
These are striking numbers, but they reflect a specific era of AI implementation — one characterized by broad experimentation without financial discipline. The shift happening now is toward what practitioners call ROI-first automation: defining a financial return target before a single line of code is written, and selecting processes precisely because they have documented, measurable outputs that will confirm or deny that target within a fixed window.
The New Expectation: Value Visible in Weeks, Not Quarters
In 2026, mature AI implementation teams talk about time-to-value in weeks. Not because the technology has fundamentally changed, but because years of collective experience have clarified which process categories produce fast, measurable returns. Micro-automations — single workflow automations targeting a specific high-frequency task like support ticket routing or invoice matching — commonly achieve payback in under 60 days. Broader workflow automations that encompass intake, scheduling, and approvals typically deliver payback in two to six months.
This compression from 18-month timelines to sub-90-day results is the primary story of AI automation in 2026. And the mechanism is not magic — it is selection discipline. Organizations achieving sub-60-day ROI are not automating the most complex or impressive processes. They are automating the most financially legible ones.
What “Fast ROI” Actually Requires
Speed-to-ROI is not a product of vendor selection or implementation speed alone. It requires three things working together: a process with a high current cost (in labor hours, error rates, or cycle time), a clearly measurable output that changes after automation (throughput, accuracy, time-per-task), and a total cost figure for the automation itself that is smaller than the monthly value being created. When all three are true, ROI is not a projection — it is arithmetic.
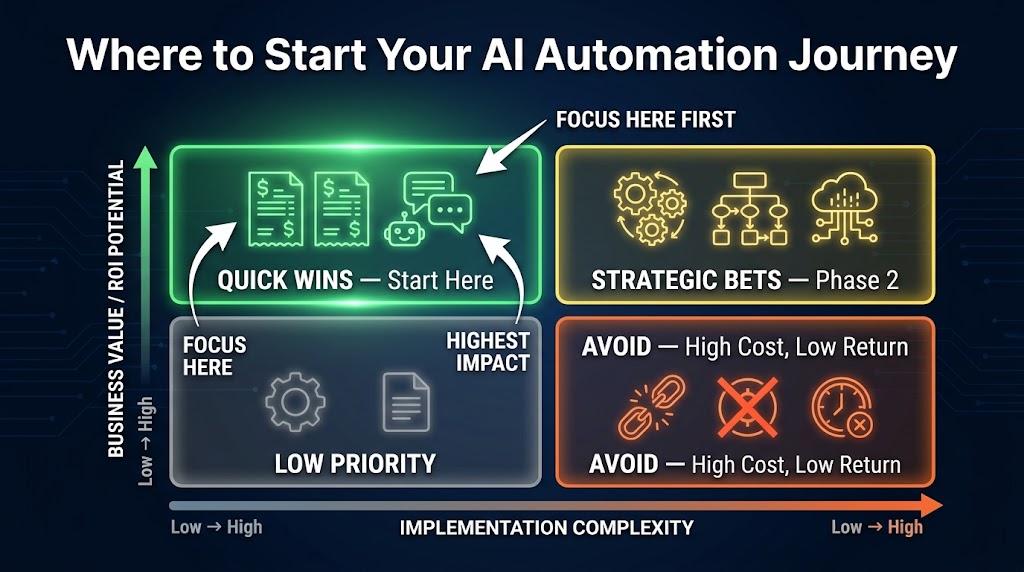
The Process Selection Problem — Most Companies Start in the Wrong Place
The single most reliable predictor of AI automation failure is process selection. Specifically, the failure to adequately assess a process before deciding to automate it. Organizations routinely choose processes based on the wrong criteria: visibility (this process is annoying, everyone knows it), executive preference (the CFO wants to automate expense reports), or vendor sales materials (this tool works well for X, so we should automate X).
None of these is a reliable indicator of fast ROI potential. The organizations consistently achieving the best returns apply a structured filter before any automation decision is made.
The Four Disqualifying Conditions
Before scoring a process for automation potential, experienced teams first screen for conditions that disqualify a process entirely — at least in the near term.
Condition 1: The process is already broken. This sounds obvious, but it is the most frequently violated rule in enterprise automation. If a process produces wrong outputs, inconsistent results, or requires constant human exception handling in its current state, automating it will produce wrong outputs faster. Automation accelerates existing behavior — it does not fix upstream dysfunction. The process needs to work before it can be automated profitably.
Condition 2: The data is not ready. AI automation depends on clean, consistent, accessible input data. Research from Gartner found that 60% of automation projects without AI-ready data are abandoned. Data preparation alone accounts for 60% to 80% of early implementation effort in most cases. If the inputs to a process are unstructured, inconsistent across sources, or locked in legacy systems without API access, the ROI clock starts significantly later than teams anticipate.
Condition 3: The volume is too low. Automation generates returns through repetition. A process that happens 10 times a month will not generate meaningful savings no matter how well it is automated. High-frequency, high-volume processes are the ROI engine of AI automation. The same implementation cost spread across 500 daily occurrences versus 20 monthly ones produces a dramatically different payback calculation.
Condition 4: The process requires judgment that cannot be defined. This does not mean complex processes are off-limits — modern AI handles significant complexity. But if the rules governing a process are tacit, context-dependent, and impossible to document with reasonable completeness, early-phase automation will produce unpredictable outputs that require more human intervention than the original manual process. These processes are candidates for later-phase automation, after more foundational wins have been secured.
The 5-Dimension Scoring Matrix: How to Rank Every Process You Consider
Once disqualifying conditions have been cleared, every candidate process should be scored across five dimensions. This approach — drawing from frameworks used by Auxis, Fountain City Consulting, and Pendoah among others — produces a ranked priority list that is defensible to leadership and grounded in financial reality rather than enthusiasm.
Dimension 1: Business Impact (Score 1–5)
What is the current cost of this process running manually? This includes direct labor costs (hours × fully-loaded hourly rate), error costs (rework, customer remediation, compliance penalties), and opportunity costs (what could the team be doing instead). Processes with a high measurable cost score 4–5. A score of 1–2 suggests the process, even perfectly automated, will not move meaningful financial needles.
Dimension 2: Implementation Feasibility (Score 1–5)
How straightforward is the technical implementation? Factors include data availability and cleanliness, integration requirements with existing systems, rule clarity, and vendor tool maturity for this process type. Processes with clean digital inputs, documented rules, and established tooling score high. Those requiring custom model training, complex legacy integrations, or significant process redesign score lower.
Dimension 3: Data Readiness (Score 1–5)
This dimension deserves its own score separate from feasibility because it is so frequently the hidden ROI killer. Rate the process on: Is input data structured and consistent? Is it accessible via API or export? Is there sufficient historical data for training or validation? A score of 1 here should give any implementation team serious pause, regardless of how well the process scores on other dimensions.
Dimension 4: Speed to Value (Score 1–5)
How quickly can this automation be deployed and generating returns? Processes that can be live with an MVP in two to four weeks and showing measurable outputs within 30 days score 5. Those requiring six-plus months of build time before any output is visible score 1–2. This dimension directly controls whether the initiative maintains organizational momentum and leadership support through implementation.
Dimension 5: Strategic Alignment (Score 1–5)
Does automating this process support a current business priority? Cost reduction initiatives score processes with high labor spend. Growth initiatives score processes that free capacity for revenue-generating activities. Compliance initiatives score processes with audit trails and error reduction. A process that scores well on all other dimensions but is misaligned with current strategic priorities will face resistance at every stage of implementation.
Processes scoring 20 or higher (out of 25) across all five dimensions are your priority automation candidates. Scores of 15–19 are Phase 2 candidates. Below 15: park them, revisit in 12 months.
The ROI Math Behind AI Automation — And the Hidden Costs That Torpedo It
Most AI automation ROI calculations presented to leadership are structurally incomplete. They capture the benefits accurately but systematically undercount the costs — producing projections that look excellent on paper and disappoint in practice. Here is the honest version of the math.
The Benefits Side: Three Categories of Value
Direct cost savings are the easiest to calculate: (Hours saved per month × fully-loaded hourly cost) minus (AI platform cost per month) = monthly net savings. If a process currently requires 200 labor hours per month at $45/hour fully loaded, that is $9,000 in monthly cost. If an AI automation reduces that to 40 hours, the savings are $7,200/month. If the platform costs $1,200/month, the net monthly savings are $6,000.
Productivity gains are slightly harder to quantify but equally real. A 2026 benchmark from Alice Labs found workers save 1.9 to 4 hours per week through AI assistance. At scale, this represents significant capacity reallocation — not headcount reduction, but redirection of skilled time toward higher-value work. Finance teams completing month-end close 70% faster. Support agents handling 40% more tickets without additional staff. Developers completing 26% more tasks in the same sprint.
Revenue attribution is the most valuable and most frequently ignored benefit category. AI-automated lead qualification, faster customer onboarding, and reduced quote-to-close cycles all have quantifiable revenue implications. The formula: (Conversations or leads touched by automation) × (booking or conversion rate improvement) × (average contract value) = monthly revenue attributed to automation.
The Full Cost Picture: Where Projections Break Down
The honest total cost of ownership for AI automation is typically two to three times the initial platform and implementation cost over a three-year period. Hidden costs that regularly blindside teams include:
- Post-deployment maintenance: Model drift, version updates, edge case handling, and ongoing testing account for approximately 65% of total lifecycle costs — yet almost no pre-launch ROI model includes this line item at full weight.
- Data preparation: Depending on source system quality, cleaning and structuring data for AI input can consume 60% to 80% of the early implementation effort. This is labor — typically senior technical labor — that carries significant cost.
- Integration development: Connecting an AI automation to existing CRMs, ERPs, or ticketing systems often requires custom development work that adds weeks and thousands of dollars to initial estimates.
- Compliance and governance: Depending on industry, AI automation may require ongoing audit logging, explainability documentation, or security reviews. Annual costs of $10,000 to $100,000 are common in regulated industries.
- Staff retraining and change management: People need to learn new workflows. This has a hard cost in training time and a softer cost in temporary productivity loss during transition — neither of which typically appears in vendor-supplied ROI templates.
The corrected ROI formula is: ROI (%) = [(Total Annualized Benefits − Total Annualized Costs including TCO) ÷ Total Annualized Costs] × 100. Payback period = Total Implementation Cost ÷ Monthly Net Value Created. When both calculations use honest, fully-loaded numbers, the result is still typically positive — but it shifts the expected payback from 2 months to 3–6 months, and the 3-year ROI from 500% to a more defensible 200%–330%. That is still an excellent business case. It just needs to be the real one.
The 90-Day Sprint Framework: From Selection to Measurable Return
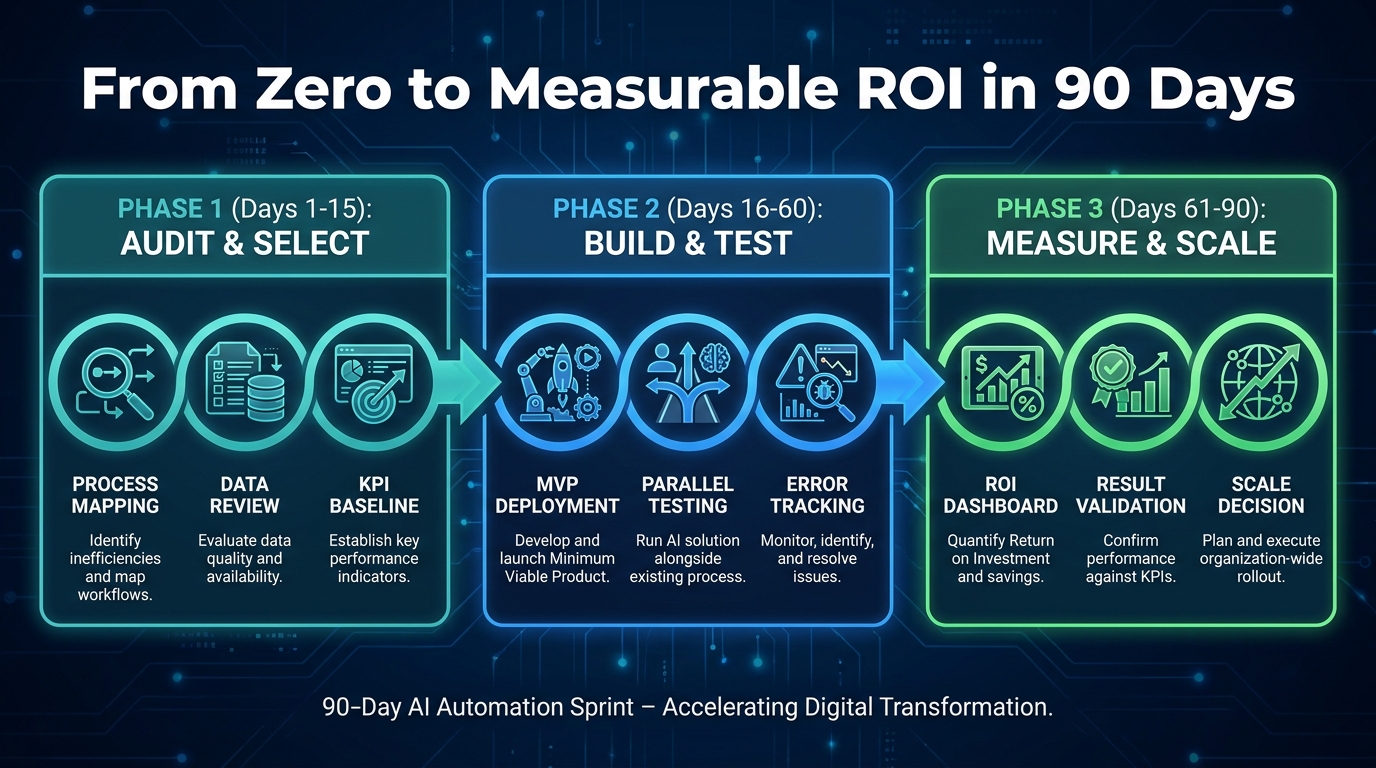
The 90-day sprint is not a project management philosophy — it is a financial discipline tool. Its purpose is to force a measurable outcome within a window short enough to maintain organizational attention and long enough to produce results worth measuring. Here is how leading implementation teams structure it.
Days 1–15: Audit, Baseline, and Select
This phase is about measurement infrastructure, not technology. Before any automation is built, you need a documented baseline for every metric you plan to improve. How many hours does this process currently consume? What is the current error rate? What is the current cycle time from input to output? What does a manual exception handling event cost?
Research from Maccelerator found that 88% of automation pilots that fail to produce measurable ROI lack pre-implementation baselines. Without a before-measurement, there is no way to calculate an after-improvement — and no way to defend the project to leadership when they ask for results.
During this phase: document the process in full, identify all input and output data sources, confirm data readiness (using the scoring criteria above), establish your measurement methodology, and select the one to three processes with the highest combined score from your prioritization matrix. The selection should be unanimous among stakeholders before Phase 2 begins.
Days 16–60: Build and Test with a Live Parallel
Phase 2 is implementation — but with a specific structural requirement: parallel running. The automation runs alongside the manual process, not instead of it, for a meaningful test period. This serves three purposes: it catches errors before they affect live operations, it builds team confidence in the automation’s outputs, and it generates the before/after comparison data your ROI calculation will depend on.
The MVP deployed in this phase should be exactly that: minimum viable. It handles the 80% of cases that fit clear rules. Exception handling for edge cases — the remaining 20% — remains human for now. Automating the simple majority of volume is enough to generate measurable ROI while limiting implementation risk.
Key metrics to track during parallel running: automation rate (what percentage of cases did the automation handle without human intervention?), accuracy rate (of those automated cases, what percentage produced correct outputs?), cycle time (how much faster did automated cases complete?), and exception rate (what percentage required human fallback?).
Days 61–90: Measure, Validate, and Decide
Phase 3 is the financial reckoning. Using the baseline data from Phase 1 and the performance data from Phase 2, you calculate actual ROI against the projection made before implementation. This is where the ROI formula pays off — not as a number to present to leadership, but as a decision-making tool.
If the 90-day results meet or exceed projection: commit to full deployment, begin identifying the next candidate process, and document the implementation approach so it can be replicated. If results are below projection: diagnose the specific underperformance (data quality? edge case volume? adoption lag?), make targeted adjustments, and set a 30-day reassessment before making scale or kill decisions. If results are significantly below projection: this is valuable data, not failure. Document what was learned about process selection criteria and apply it to the next candidate.
The sprint framework is also a learning system. Each completed sprint refines your process selection criteria, your implementation approach, and your cost estimation accuracy — compounding returns across subsequent automations.
Quick-Win Category 1 — Document Processing and Finance Operations
Among all process categories analyzed for fast AI automation ROI, document-heavy finance operations consistently rank at or near the top. The reasons are structural: the processes are high-volume, the inputs are largely digital and structured, the rules are well-documented, and the cost of manual processing is both high and well-understood.
Invoice Processing and Accounts Payable
Manual invoice processing is one of the most costly and error-prone administrative functions in most organizations. Average manual cost per invoice ranges from $12 to $30 depending on complexity. AI-powered invoice automation reduces that cost to $2 to $5 per invoice — a reduction of 70% to 85%. At 500 invoices per month, a mid-sized organization processing at $20 per invoice manually is spending $10,000/month on the function. Automation at $3 per invoice brings that to $1,500, with a platform cost of perhaps $1,000–$2,000/month — producing net savings of $6,500 to $7,500 per month before TCO adjustments.
IBM reported a greater than 90% reduction in finance close cycle time using AI automation — one of the most dramatic documented improvements in enterprise process automation. Separately, Wells Fargo documented a 20% reduction in overall finance workflow requirements through targeted AI deployment in accounts payable and reconciliation.
Finance Close and Reconciliation
Month-end close is a process that most finance teams describe as their highest-stress, highest-overtime period — and one of the clearest candidates for AI automation payback. The activities involved — account reconciliation, journal entry preparation, variance explanation, and report generation — are largely rule-based, high-frequency within their cycles, and expensive in senior labor time. AI automation applied to the reconciliation and variance components alone can cut close timelines by 40% to 60%, freeing senior finance staff for the analytical work that actually requires judgment.
Enterprise search automation — allowing employees to instantly locate documents, contracts, and policy records rather than spending time in manual search — shows similarly fast returns. Pfizer documented 16,000 hours saved annually through AI-powered enterprise search implementation alone. At a conservative $60/hour for professional staff time, that represents $960,000 in annual labor cost avoided from a single, relatively straightforward implementation.
Quick-Win Category 2 — Customer Service and Support Deflection
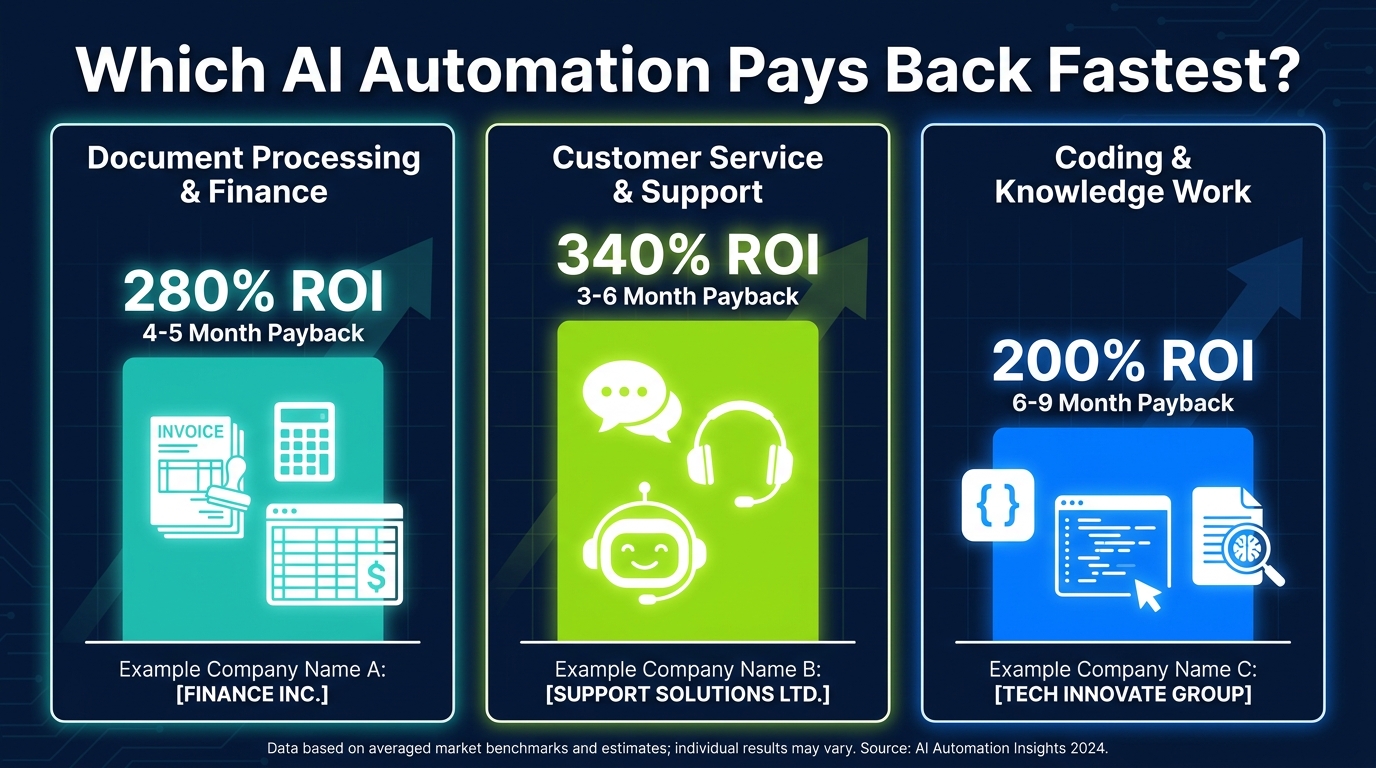
Customer service automation delivers the highest documented average ROI of any process category — approximately 340% over six months according to 2026 benchmarks — driven by the convergence of high transaction volume, measurable deflection rates, and well-established AI tooling.
Support Ticket Deflection and Routing
AI-powered support automation operates on a straightforward financial model: every ticket that an AI resolves without human agent involvement saves the cost of agent handling time — typically $6 to $25 per interaction depending on channel and complexity. At scale, deflection rates of 40% to 70% are documented across mature AI support deployments. For an organization handling 10,000 monthly support interactions at $15 average cost, a 50% deflection rate saves $75,000 per month. Platform and maintenance costs of $15,000 to $25,000 per month produce net monthly savings of $50,000 to $60,000 — payback on a $200,000 implementation in three to four months.
Klarna’s support automation deployment is the most-cited benchmark in this category: the company’s AI handled the workload equivalent of 700 full-time employees in support functions, while also improving first-contact resolution rates. It is worth noting that Klarna’s implementation was at significant scale — but the unit economics apply proportionally at much smaller volumes.
HR Self-Service and Internal Knowledge Automation
HR service delivery is a frequently overlooked quick-win category that shares many structural characteristics with customer service automation. HR self-service AI handles the tier-1 employee inquiries that otherwise consume significant HR staff time: benefits questions, policy lookups, PTO balance inquiries, onboarding status checks. Studies document 40% operational cost reductions in HR functions that deploy AI self-service at full scale.
The implementation is typically straightforward — connecting an AI assistant to existing HR documentation and HRIS systems — and the returns are visible quickly because HR inquiry volume is high and consistent. A 2026 healthcare sector case study showed an AI agent for patient status checks deployed in under 7 days and generating measurable throughput improvements within the first week of operation.
Translation and Multilingual Operations
Organizations operating across language markets have documented 40% cost reductions in translation-heavy workflows through AI automation — a category that is particularly compelling because the quality improvement is simultaneous with the cost reduction. AI translation handles high volumes of product descriptions, support documentation, and internal communications at consistent quality, freeing professional translators for high-stakes content requiring nuanced judgment. The ROI timeline for translation automation is among the shortest in any category: implementation is typically two to four weeks for document-based workflows, and savings begin accruing immediately upon deployment.
Quick-Win Category 3 — Coding, Content, and Knowledge Work
The most striking performance data from 2026 AI automation research comes from knowledge work — particularly software development. A controlled study found that developers using AI coding assistance completed tasks 55.8% faster and finished 26.08% more tasks within their regular working time. This is not a marginal productivity improvement. It is a structural change in output per developer that compounds across sprints, quarters, and products.
Software Development Acceleration
AI coding assistance manifests in several distinct value streams. Code generation handles boilerplate, routine functions, and unit test writing — the work that is necessary but does not require senior engineering judgment. Code review automation catches common patterns, security vulnerabilities, and style violations before human review, reducing review cycle time by 30% to 50%. Documentation generation turns code into readable documentation automatically, addressing a perennial engineering debt driver. The payback model is straightforward: at $150,000 annual fully-loaded cost per developer, a 26% throughput improvement represents $39,000 in additional output capacity per engineer per year — with AI coding tools typically costing $600 to $2,400 per developer per year.
Content Production and Professional Writing
AI writing assistance reduces professional writing time by approximately 40% across documented implementations. An SEO agency case study from 2026 showed doubling of article output — from 80 to 160 articles per month — without adding staff, by deploying AI for outlines, research structuring, and content repurposing. The labor hours saved (85+ per month) were redirected to higher-value strategic activities. For content-heavy functions — marketing, legal document preparation, proposal writing, technical documentation — this 40% time reduction has direct, measurable cost implications that are easily calculated using the standard hours-saved formula.
Agentic AI in Knowledge Operations
The highest-impact knowledge work automation in 2026 involves agentic AI systems that handle multi-step research and synthesis tasks. Rather than simply assisting with individual writing or coding tasks, these systems autonomously complete end-to-end workflows: conducting research, synthesizing findings, drafting outputs, and flagging items requiring human review. The documented average ROI for agentic AI implementations is 171% — lower than single-function automations — but the throughput improvement is 66%, meaning these systems are generating disproportionate output relative to their cost. Organizations deploying agentic AI in knowledge operations report that the primary value is not cost reduction but capacity expansion: doing work that simply would not have been done otherwise due to resource constraints.
The TCO Trap: Why Initial ROI Looks Good but Long-Term Numbers Disappoint
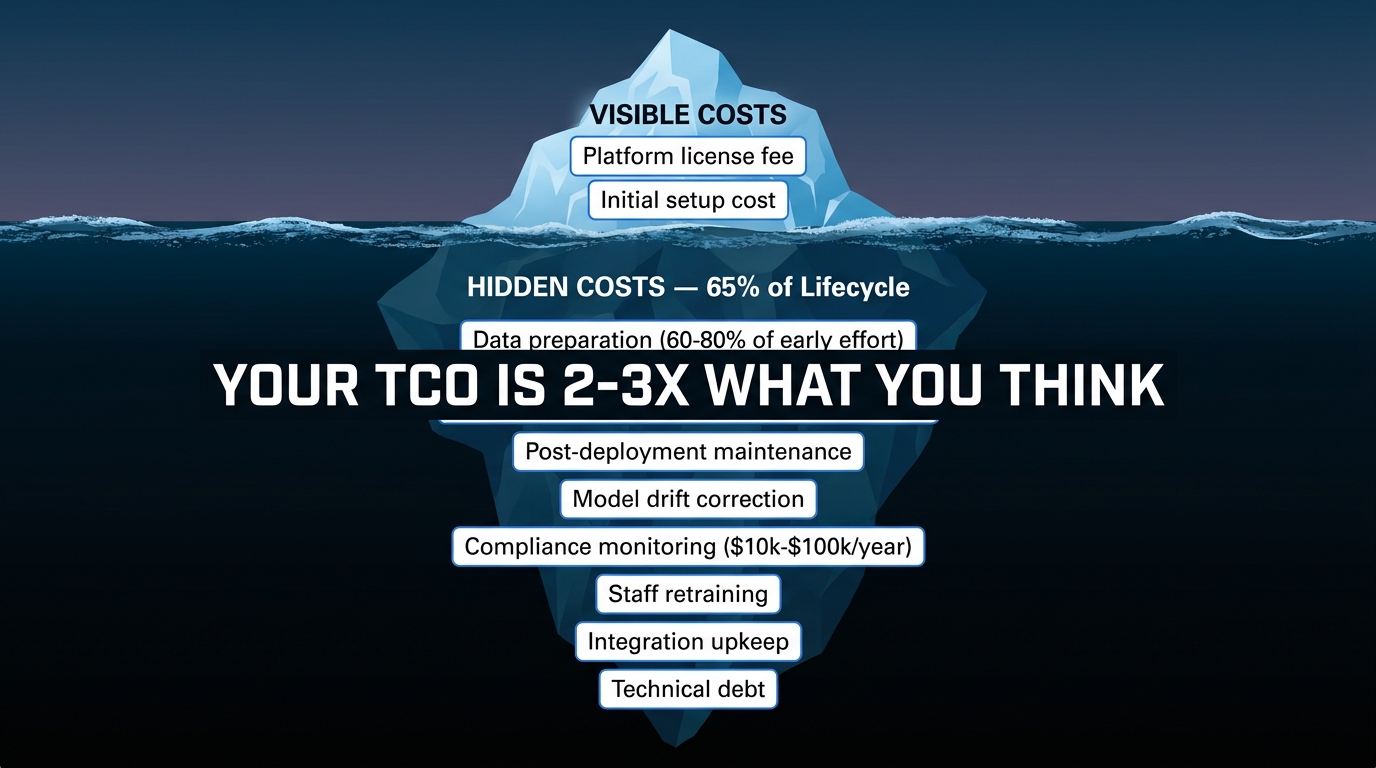
The iceberg model is the most accurate mental frame for AI automation costs. What is visible above the waterline — platform license fees, initial setup costs, integration development — is genuinely the smaller part of what an organization will spend over a three-to-five-year lifecycle. Understanding the costs below the waterline before launch is the difference between a project that meets its ROI projection and one that becomes an organizational embarrassment.
The Post-Deployment Maintenance Reality
Approximately 65% of AI automation lifecycle costs occur after the initial deployment. This includes: model drift correction (AI outputs degrade over time as input patterns shift, requiring periodic retraining or reconfiguration), version updates and compatibility maintenance as underlying platforms evolve, edge case documentation and exception handling expansion as real-world usage reveals scenarios not covered in initial design, and performance monitoring to catch degradation before it affects business outcomes.
Most teams build the maintenance budget as a percentage of the initial build cost: 15% to 25% annually is the commonly cited range for well-architected automations. Poorly designed systems can run significantly higher. Budgeting 20% of initial build cost per year for ongoing maintenance — before counting any enhancement work — produces a much more honest three-year TCO estimate.
Cloud and API Cost Volatility
AI automation that relies on third-party API calls — as most modern AI-powered automations do — faces an inherent cost volatility risk that has caught numerous organizations off-guard. Usage-based pricing means that as adoption grows and automation volume increases, API costs grow proportionally. Organizations that modeled costs based on pilot-phase usage volumes frequently find that production-scale usage doubles or triples the monthly API cost line.
The correct approach is to model costs at 2x and 3x projected volume before committing to an implementation approach. If the economics hold at 3x volume, the project is genuinely robust. If they break at 2x, the pricing structure needs renegotiation or the architecture needs to change before launch.
The Technical Debt Accumulation Problem
Quick-win automations built under time pressure — which, as the 90-day sprint framework intentionally creates — carry a real risk of technical debt. A rapid MVP built to demonstrate ROI in 90 days is often not architected for long-term maintainability, scalability, or integration with future systems. This is an acceptable trade-off when the debt is acknowledged and budgeted for. It becomes a problem when the MVP is treated as the final implementation rather than the first iteration. Build the ROI case for the MVP using conservative speed-to-value assumptions, then budget explicitly for a post-validation architecture improvement sprint before the automation is considered “done.”
Building a ROI Dashboard That Leadership Actually Trusts
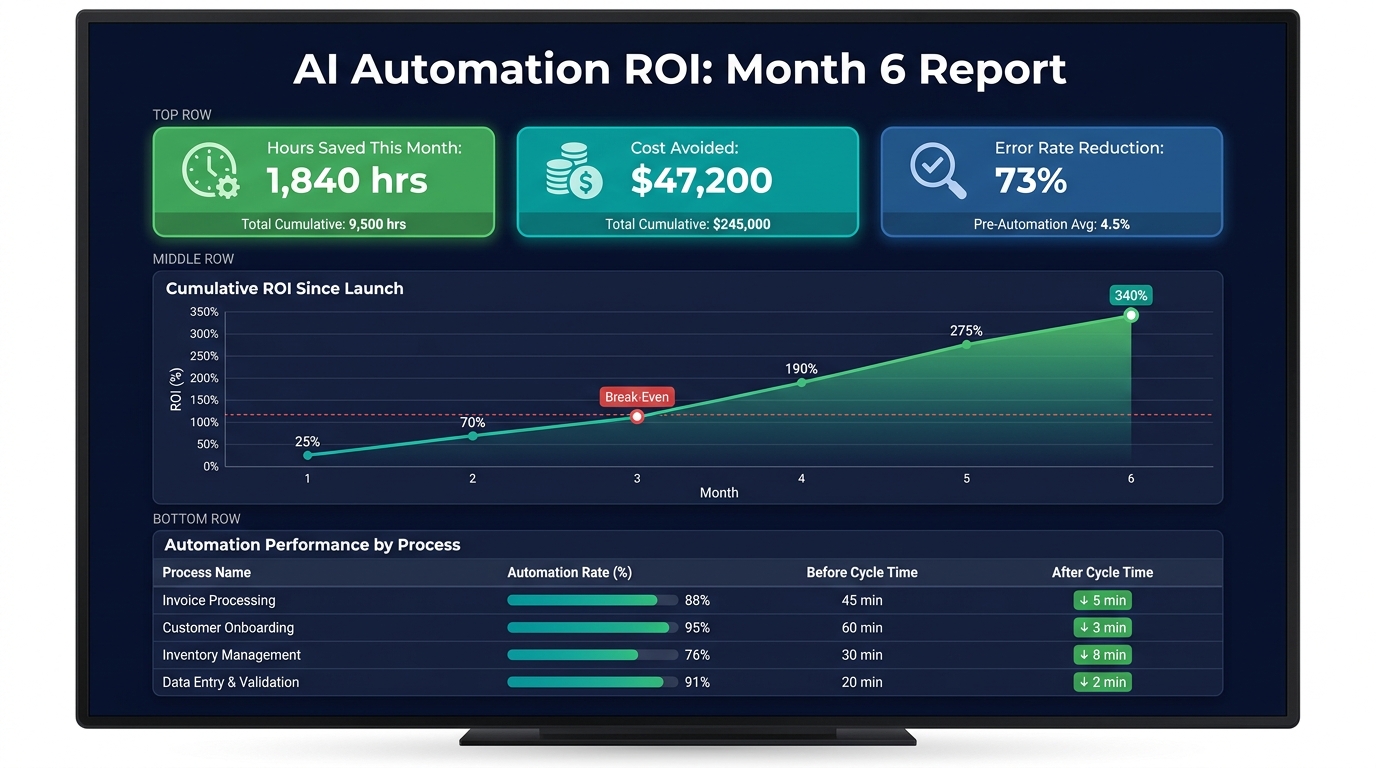
The ROI dashboard is not primarily a reporting tool. Its real function is to maintain organizational commitment to the automation program by providing leadership with visible, verifiable evidence that the investment is returning value. Without this, automation programs are perennially at risk of budget cuts when the next organizational priority competes for resources.
The Three Tiers of Metrics
Tier 1 — Financial metrics are what leadership cares about most and should dominate the top of every dashboard. Monthly cost avoided (labor hours saved × fully-loaded rate − total monthly platform and maintenance costs), cumulative ROI since launch (calculated against total implementation investment), and payback milestone tracking (the date the cumulative savings crossed the total investment cost) are the three numbers every executive sponsor should be able to cite from memory.
Tier 2 — Operational metrics tell the implementation team whether the automation is healthy. Automation rate (percentage of cases handled without human intervention), accuracy rate (percentage of automated cases producing correct outputs), exception rate (percentage requiring human fallback), and cycle time comparison (automated vs. manual handling time) belong here. These metrics drive the maintenance and improvement roadmap — declining automation rate or rising exception rate are leading indicators of ROI degradation before it shows up in the financial numbers.
Tier 3 — Adoption metrics measure the organizational dimension of the automation. What percentage of eligible transactions are flowing through the automated process rather than being bypassed? What is the user satisfaction score among team members interacting with the automation? What is the average time to human escalation when needed? Low adoption — people avoiding the automation — is a silent ROI killer that operational metrics alone will not catch.
Reporting Cadence and Format
Leadership dashboards should be updated monthly, require no more than five minutes to read, and always show the cumulative ROI trend from launch to present. The most effective format leads with the financial summary, follows with a one-sentence status for each Tier 2 metric (green/yellow/red), and closes with one specific action item or decision required from leadership. Keep it to one page or screen. If the report requires explanation to be understood, the metrics themselves need simplification.
Operations and implementation teams need weekly Tier 2 and Tier 3 updates — short, automated pulls from the automation’s performance logs, not manually compiled reports. If generating the performance report requires manual effort, that is itself a process worth automating.
When to Slow Down — Red Flags That Signal Your Automation Is Headed for Failure
Not every AI automation that shows early promise delivers sustained ROI. Knowing when to pause, pivot, or stop is as important as knowing how to launch. The following signals are documented warning signs that, left unaddressed, consistently produce the “project that delivers no measurable value” outcome that the RAND study found in 80.3% of cases.
The Baseline Was Never Established
If, at 60 days post-launch, the team cannot clearly articulate what the process cost before automation and what it costs now, the project has a fundamental measurement problem. This is not recoverable through better reporting — it requires going back to establish a documented baseline (using historical data where possible) or accepting that this project’s ROI will be estimated rather than calculated. For leadership communication purposes, estimated ROI is significantly less defensible and will not sustain the program through future budget cycles.
Adoption Is Below 70% at Day 60
If fewer than 70% of eligible transactions are flowing through the automated process at 60 days, something is wrong with adoption. The two most common causes: the automation produces outputs that team members do not trust (accuracy or reliability issue), or the workflow design requires manual steps that team members find more effort than the original process (implementation design issue). Either cause is fixable — but the fix requires diagnosis and attention, not patience. Waiting for adoption to naturally improve rarely works.
Exception Rate Exceeds 30% Consistently
A consistent exception rate above 30% means the automation is handling less than 70% of volume autonomously. Depending on how the ROI was modeled, this may be acceptable — but it likely means the original process was a worse fit for automation than the scoring matrix suggested, and the financial return will be significantly below projection. If the exception rate is not declining week-over-week at 60 days, the process scope needs to be narrowed further to the subset of cases the automation handles reliably, and the exception-handling cases should be re-evaluated for future improvement.
The Process Changed After the Automation Was Built
Business processes change. New product lines, regulatory updates, organizational restructuring — any of these can invalidate assumptions built into an automation. When the underlying process changes and the automation is not updated to match, outputs degrade rapidly. Organizations that lack a process change notification protocol — a formal step that requires teams to flag automation-dependent process changes before implementing them — routinely find automations quietly producing wrong outputs for weeks before anyone notices.
From One Win to a Portfolio — Scaling What Works
A single successful automation is evidence. A portfolio of them is infrastructure. The organizations achieving the most significant AI automation ROI in 2026 are not those who landed one impressive implementation — they are those who built a systematic capability for selecting, launching, measuring, and scaling automations repeatedly. The difference between a one-time project and a sustainable capability is primarily organizational, not technical.
Building the Replication Machine
Each completed 90-day sprint should produce two outputs: the automation itself, and an updated implementation playbook documenting what was learned. Process selection criteria that proved accurate. Data preparation steps that were underestimated. Integration patterns that can be reused. Vendor configurations that worked. Cost estimation adjustments based on actual vs. projected TCO. This documentation is the compound interest of an automation program — it makes each successive implementation faster, cheaper, and more likely to hit ROI targets.
Leading organizations designate a small dedicated team — four to six people is the commonly cited size for effective enterprise automation units — responsible for maintaining this playbook, running the sprint process, and managing the performance monitoring infrastructure. This team does not do all the implementation work, but they own the process and the measurement framework. Their outputs are ROI-positive automations delivered on a repeatable cadence, not individual technology projects.
The Portfolio Sequencing Strategy
Effective automation portfolio management runs three categories of work simultaneously. Active sprints: one to three automations currently in 90-day implementation, selected from the high-scoring priority list. Validation and optimization: recently launched automations being monitored for ROI performance and adoption, with active intervention where metrics indicate issues. Pipeline development: ongoing process audits identifying and scoring the next cohort of candidates, ensuring there is always a ready queue when an active sprint completes.
This three-horizon structure prevents the “automation program stall” pattern — the period after an initial successful pilot where nothing happens for six months because the next process hasn’t been selected yet. Momentum in automation programs is itself a financial asset. Teams that maintain continuous deployment cadence develop implementation speed advantages that reduce time-to-ROI on each successive project.
When to Graduate to Agentic Automation
Single-process automations are the right starting point. But organizations that have successfully automated multiple high-volume, rules-based processes eventually hit a ceiling: the remaining processes are more complex, more judgment-dependent, and harder to define in terms of clear rules. This is the threshold at which agentic AI — systems that can handle multi-step, context-dependent workflows with some degree of autonomous decision-making — becomes relevant.
Agentic automations average 171% ROI and 66% throughput improvements in 2026 benchmarks. They require more sophisticated implementation, more robust monitoring, and higher levels of organizational change management. They are not appropriate as first automations — but for organizations that have built the implementation muscle through the sprint framework, they represent the next significant return opportunity.
The Compounding Logic of Fast ROI Automation
The case for speed-to-ROI in AI process automation is not just about impatient executives or short investment cycles. It is about compounding. Every automation that pays back in 90 days instead of 18 months frees capital that can be redeployed into the next automation. Every iteration of the implementation playbook reduces the cost and timeline of the next sprint. Every team that develops hands-on experience deploying and measuring automations becomes more capable — and more credible internally — with each successive project.
The organizations pulling ahead in AI automation in 2026 are not necessarily the ones with the biggest budgets or the most sophisticated technology. They are the ones that started with processes where the ROI was obvious and the measurement was easy. They built a track record of successes that justified expanding scope. They developed internal capability that reduced their dependence on external vendors. And they created a feedback loop between real performance data and the next selection decision — so that each sprint is smarter than the last.
The 90-day framework is not a shortcut. It is a discipline. It forces the questions that most automation projects avoid: What exactly will be measured? What does success look like in numbers? What is the honest cost? When will we have enough data to decide? Answering those questions before implementation begins — and building the measurement infrastructure to answer them continuously afterward — is what separates the 16% of organizations achieving sustained, compounding AI automation ROI from the 84% still searching for theirs.
The bottom line: Start with the process where the current cost is highest, the rules are clearest, the data is cleanest, and the output is most measurable. Automate the predictable 80% of cases first. Measure everything from day one. Build the infrastructure to do it again — faster — next time.