There is a particular kind of optimism that Amazon sellers develop in their first year. Revenue climbs. Units ship. The dashboard looks healthy. Then the payout hits the bank account and the number is nothing like what the math on paper suggested.
This gap — between gross revenue and what actually lands in a seller’s pocket — is where most Amazon businesses quietly fail. Not through a dramatic collapse, but through slow, consistent margin erosion. A fee here. A return there. An ad campaign bleeding budget. Inventory aging past the threshold. Each item is small. Together, they are devastating.
In 2026, that gap has grown wider than at any prior point in Amazon’s marketplace history. The platform implemented 11 structural fee changes in Q1 alone. Average net profit per unit dropped from $6.26 in 2024 to $4.74 in 2026 — a 24% decline in real earnings per item shipped. ACoS is sitting near 30% for most categories, and payout timelines have stretched to DD+7 following Amazon’s March 2026 policy update.
This is not a doom-and-gloom story. Amazon still generates extraordinary returns for sellers who understand the cost architecture and manage it deliberately. The difference between a business that scales and one that stalls is almost always found not in the product selection or the listing, but in the financial discipline applied at every layer of the operation.
This article is about those layers. It is a forensic look at where Amazon seller money goes — and a practical framework for keeping more of it.

The Brutal Math: What Amazon Actually Pays You Per Unit
Most sellers have a rough sense of their margins. Very few have an accurate one. The gap between perceived and actual profitability is usually the result of calculating fees in isolation rather than stacking them the way Amazon does in practice.
Here is what a typical unit-level cost breakdown actually looks like for a standard-size product selling at $24.99 in 2026:
The Full Fee Stack
- Referral fee: 8–15% depending on category (~$3.00–$3.75 at $24.99)
- FBA fulfillment fee: $3.22+ per unit for small standard items, now higher post-January 2026 increases
- Inbound placement fee: $0.27–$1.32 per unit depending on where inventory is directed
- Storage fee: $0.56–$2.40 per cubic foot monthly (more on aged inventory below)
- Advertising (ACoS ~30%): If you’re spending on ads at a 30% ACoS on a $24.99 item, that’s roughly $7.50 absorbed per attributed sale
- Returns processing fee: Equal to fulfillment fees for items that cannot be relisted
- Cost of goods + shipping to FBA: Varies, but typically $5–$10 for a mid-tier private label product
When you stack all of these together — including ad spend — it is not unusual for total costs to consume 65–75% of the sale price. On a $24.99 item with a COGS of $6, your actual net profit after all fees and ads may be $3.00–$5.00. That is a 12–20% margin, and it assumes zero returns, no storage penalties, and no inbound defect fees.
Why Averages Are Dangerous
The data shows average net profit per unit dropped to $4.74 in 2026. That average conceals a wide distribution. Sellers with optimized SKUs, low return categories, and controlled ad spend are still hitting 18–25% margins. Sellers relying on averages — rather than tracking per-ASIN — are often unknowingly running several products at negative net margin.
The core discipline of Amazon selling in 2026 is not product discovery. It is unit economics. Every decision — from which products to launch to how much to spend on ads — needs to start with the full fee stack, not a simplified estimate.
“Margins no longer forgive mistakes. A 2% fee increase or a 5% rise in return rates can convert a profitable product into a loss overnight.” — Common finding across 2026 Amazon seller performance analyses
The 11 Fee Changes That Quietly Crushed Margins in 2026
Amazon’s headline communication around its Q1 2026 fee changes focused on an average increase of $0.08 per unit. That framing is technically accurate and practically misleading. The $0.08 average obscures 11 distinct structural changes, several of which carry far larger per-unit impacts for specific product types or seller behaviors.
The Changes That Matter Most
Tiered fulfillment fee increases by product size and price: Small standard items in the $10–$50 price range saw increases of $0.25–$0.28 per unit. Products priced over $50 absorbed increases of $0.31–$0.51 per unit. For sellers with higher-priced items, this alone moves the needle significantly.
Inbound defect fees surged 1,600%: This is the single most alarming change. Sellers who fail to meet Amazon’s inbound shipment requirements — wrong carton counts, missing barcodes, improper prep — now face fees of $0.32–$5.72 per unit on affected inventory. A seller shipping 500 units with a defective shipment can absorb thousands of dollars in fees they never anticipated.
Aged inventory costs doubled after 181 days: Slow-moving inventory is now dramatically more expensive to hold. The cost after 181 days has doubled, accelerating the financial pressure on sellers to clear stagnant SKUs before the aging threshold hits.
SKU-level low-inventory fees introduced: Amazon now charges fees at the individual SKU level when inventory falls below recommended thresholds. This creates a squeeze on sellers who manage lean inventory to avoid storage fees — the very strategy that used to be the correct response to the old fee structure.
Commingled inventory eliminated: While this is a quality control improvement, it eliminated a cost-saving option many smaller sellers used to avoid labeling fees ($0.55 per unit for seller-applied labels) or prep costs ($1.00–$2.20 per unit).
Prep and labeling service changes: Amazon discontinued certain prep services at specific fulfillment centers, forcing sellers to absorb those costs independently or through third-party prep centers.
The Compounding Effect
None of these changes is catastrophic in isolation. A seller moving 40,000 units per year at $25 average can see $10,000+ in annual profit erosion when all 11 changes compound across their full portfolio. The challenge is that most sellers only discovered the full impact when their Q1 2026 payouts arrived. By then, pricing, inventory orders, and ad budgets had already been set based on the old numbers.
The actionable response is to build fee audits into a monthly routine rather than an annual review. When Amazon changes its fee structure, the sellers who catch it within weeks — rather than months — have the pricing and sourcing flexibility to respond before damage accumulates.
FBA vs. FBM — The Decision Framework Most Sellers Get Wrong
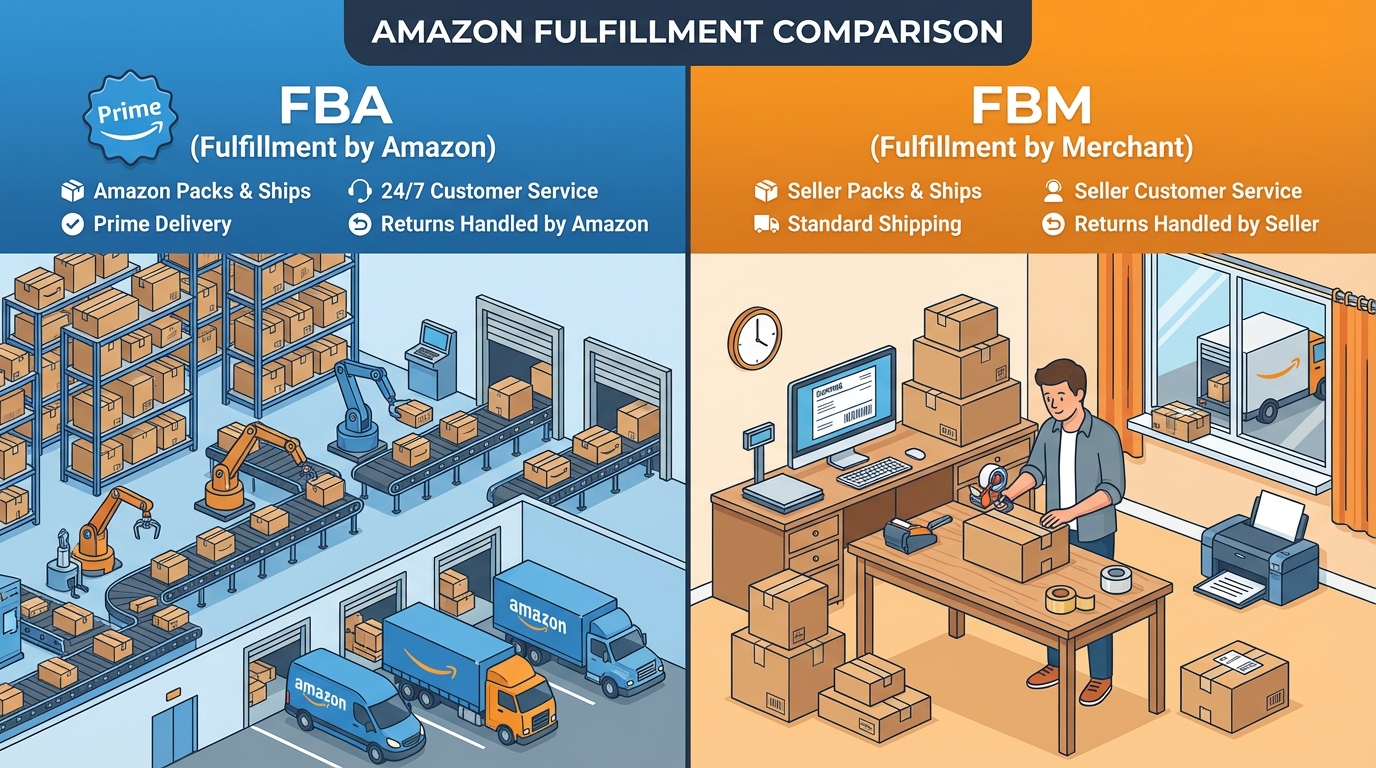
The FBA vs. FBM debate has been a fixture of Amazon seller forums for years. In 2026, it is no longer a philosophical preference — it is a financial calculation that needs to be run product by product, not account by account.
The reflexive assumption is that FBA always wins because of the Prime badge and Buy Box advantages. That assumption is costing sellers real money on a meaningful portion of their catalog.
When FBA Makes Financial Sense
High-velocity, small standard-size products in the $10–$50 range remain strong FBA candidates. The Prime badge’s conversion advantage is most pronounced in this segment, with Prime-eligible listings converting at 18–25% versus 10–13% for non-Prime equivalents. At sufficient volume (roughly 20–30+ orders per day), that conversion lift generates revenue that outpaces the fee disadvantage.
Competitive categories where Buy Box share determines visibility are FBA-favorable. Amazon’s algorithm consistently rewards FBA sellers in Buy Box allocation, and losing the Buy Box in a high-competition category is not just a conversion problem — it is a visibility problem. Products that don’t win the Buy Box can disappear from most search placements entirely.
When FBM Is the Better Financial Choice
Oversized or heavy products typically favor FBM. FBA’s dimensional weight pricing and oversize surcharges can make fulfillment fees represent 20–30% of the sale price for bulky items. A seller shipping a 15-pound item via their own carrier at $8–$12 often beats FBA’s $20–$35 fulfillment fee on the same product.
Slow-moving or seasonal inventory is particularly expensive in FBA. The combination of monthly storage fees, aged inventory penalties starting at 181 days, and low-inventory fees creates a punishing triple-exposure for products that don’t turn quickly. FBM sellers avoid all three of those costs.
High-return-rate categories such as apparel, electronics accessories, and customized items can make FBA financially toxic. Each return under FBA triggers a processing fee equal to the original fulfillment fee. A seller with a 25% return rate on an apparel SKU is effectively paying fulfillment fees on 125% of units shipped. FBM allows the seller to manage returns directly, potentially refurbishing or restocking items that Amazon would otherwise classify as unsellable.
The Hybrid Approach
The most sophisticated sellers don’t choose one model — they run simultaneous FBA and FBM listings for the same products. This approach, sometimes called “Keep a Backup” listing management, ensures that when FBA stock runs out or is tied up in inbound transit, the FBM listing captures sales that would otherwise be lost. It also provides real comparison data on actual margin differences across the same product under both fulfillment models.
SKU-Level Profitability: The Analysis Every Seller Should Be Running
Account-wide margin averages are a comfort metric, not a management metric. A seller with a 15% average net margin across their catalog may have six SKUs at 30% margin and four SKUs at -5% margin. The average looks healthy. The reality is that those four negative-margin SKUs are actively funding their own existence through the profits of the other six.
The Two-Speed Portfolio Model
The strategy gaining the most traction among high-performing sellers in 2026 is called two-speed portfolio management. The concept is straightforward: top-performing SKUs receive dedicated attention from human analysts who conduct manual fee audits, return investigations, and conversion optimization. Lower-performing products are managed through automated monitoring — rules-based alerts for when margins drop below defined thresholds, inventory levels hit danger zones, or return rates spike.
This model exists because human attention is the scarcest resource in an Amazon business. Applying equal attention to every SKU is not just inefficient — it means your best products are underserved while your worst products consume resources they don’t justify.
What to Track at the SKU Level
The data points that matter most for per-ASIN analysis are:
- Net margin per unit: Revenue minus referral fee, fulfillment fee, storage, inbound costs, COGS, and actual ad spend attributed to that ASIN
- Return rate: Percentage of units returned, and what Amazon is classifying those returns as (resellable vs. unsellable)
- Unit Session Percentage (USP): Amazon’s conversion metric per ASIN; healthy range is 7–15%
- Ad-attributed vs. organic sales ratio: A product where 80%+ of sales are ad-attributed is one where organic ranking work is overdue
- Storage velocity: How quickly inventory turns relative to the aging fee threshold
Using Brand Analytics for Deeper Insight
For brand-registered sellers, Amazon’s Brand Analytics suite — specifically the Search Query Performance (SQP) report — provides data that goes beyond what any third-party tool can replicate. The SQP report shows impression share, click share, and conversion share by search term for your brand’s ASINs, allowing you to identify exactly where in the funnel you’re losing ground to competitors.
Sellers who have used the SQP report systematically to identify high-frequency keywords with low conversion share have reported 40%+ quarterly sales growth by aligning listing copy, A+ content, and ad targeting to close those specific gaps. The data exists inside Seller Central — the majority of sellers simply don’t use it regularly enough.
The Hidden Return Rate Problem (And How to Fix It From the Listing)

Returns are one of the most under-analyzed cost centers in an Amazon business. They are accepted as inevitable, managed reactively, and rarely traced back to their actual root cause. That is a mistake, because the majority of preventable returns are caused not by product quality but by listing-created expectation mismatches.
The Real Cost of a Return
Platform-wide, Amazon processes approximately 1.2–1.5 billion returned packages annually. The average cost to process a single return is $33 when all downstream costs are included — processing fees, potential unsellable classification, and lost resale value. For sellers, a 3–5% return rate typically translates to 3–5% of gross revenue permanently lost.
Category benchmarks reveal the distribution:
- General merchandise: 5–8% return rate
- Electronics and accessories: 10–20%
- Apparel and footwear: 25–30% (some subcategories exceed 30%)
- Home and kitchen: 8–12%
If you’re in apparel and absorbing a 28% return rate without investigating its causes, you are burning a meaningful chunk of your gross revenue on reverse logistics every single month.
How Listing Quality Drives Return Rates
The most frequent causes of avoidable returns are:
Size and fit ambiguity: In apparel and footwear, the absence of a detailed size chart with both standard and measurement-based guidance is the single biggest driver of preventable returns. A customer who orders a medium because the listing doesn’t tell them anything else, discovers it fits like a small, and returns it — that return was created by the listing, not the product.
Technical specification gaps: In electronics and home goods, returns frequently originate from compatibility issues that were never addressed. Bullet points that describe features without addressing common compatibility questions (“works with X brand,” “requires Y input type”) leave buyers to discover incompatibilities post-purchase.
Hero image vs. reality gaps: When the primary product image shows a lifestyle scenario that implies things the product does not include — props, accessories, complementary items — returns spike. The listing set an expectation the product couldn’t meet.
A+ Content as Objection-Handling Infrastructure
A+ Content is often used as a brand aesthetic tool. Its more valuable application is as preemptive objection handling. A well-structured A+ module should address the top five questions that appear in the Q&A section of similar competing products, the most common complaints in competitor reviews, and the specific scenarios where the product will and will not perform as expected.
Sellers who have rewritten A+ Content through a returns-reduction lens — rather than a brand storytelling lens — report meaningful declines in return rates within 60–90 days. The logic is simple: a buyer who enters the product fully informed is a buyer who doesn’t have grounds to return it.
Conversion Rate Psychology — What the Data Says About How Buyers Decide

Amazon converts at 9.87–11.1% across all categories — roughly 7–10 times higher than a typical standalone e-commerce site. That advantage comes from the platform’s built-in trust, search intent, and frictionless checkout. But within those averages, there is a 4–6x difference between optimized and unoptimized listings in the same category.
Understanding why buyers convert — or don’t — is what separates sellers who squeeze 18–25% out of their Unit Session Percentage from those hovering at 5–7%.
The 3-Second Filter
Research consistently shows that shoppers make an initial decision within 3 seconds of landing on a product listing. In that window, they are not reading bullet points or processing brand stories. They are pattern-matching on the hero image, the price, the star rating, and the review count. If any of those four elements creates doubt, most shoppers navigate away before reading a single word of copy.
This means conversion optimization must start with those four elements — not the A+ content or the backend keywords. A hero image that clearly communicates the product’s primary use case, a price that aligns with category expectations, and a review count sufficient to establish credibility (generally 15+ for meaningful trust, 50+ for strong trust) are the prerequisites for everything else to matter.
Price-Tier Conversion Benchmarks
Conversion rates are heavily influenced by price point, which has important implications for product positioning and pricing strategy:
- Under $20: 15–25% conversion rate
- $20–$50: 10–18% conversion rate
- $50–$100: 8–15% conversion rate
- $100–$300: 5–12% conversion rate
- Over $300: 3–8% conversion rate
Products priced just above a psychological threshold — $51 instead of $49, or $105 instead of $99 — can experience disproportionate conversion drops. When margins are thin, testing pricing at and just below key thresholds is a legitimate conversion optimization tactic that costs nothing and can meaningfully affect revenue.
The Four Psychological Triggers
Value justification is the primary driver for products priced above the category average. Buyers are not asking whether the product is expensive — they are asking whether the price is justified by the specific benefits on offer. Listings that win this argument through comparison tables, specific material or performance specifications, and durability evidence consistently convert higher at premium price points than listings that simply assert quality.
Risk reduction matters most for first-time buyers in the category. The buyer’s unspoken question is: “What happens if this doesn’t work for me?” Answering that question explicitly — through a clear return policy, a compatibility guarantee, or specific use-case scenarios — reduces the psychological cost of the purchase decision.
Social proof via reviews can boost sales by up to 50% when effectively surfaced. This is not just about review count. The content of reviews matters. Listings that use A+ content to echo the specific language buyers use in positive reviews — solving the exact pain point the product was purchased to address — create a feedback loop of validation.
Scarcity and urgency, when genuine, create action. “Only 3 left in stock” is more powerful than any headline claim. The challenge for sellers is engineering legitimate scarcity through inventory management rather than artificial tactics, which Amazon’s systems now detect and penalize.
Pricing Strategy Under Margin Pressure
Pricing on Amazon in 2026 is no longer a set-and-forget decision. It is a continuous variable that affects Buy Box share, organic ranking, ad efficiency, and ultimate profitability simultaneously. Managing it as a static data point is one of the clearest signs of an Amazon business that is not being managed to its potential.
Understanding Price Elasticity on Amazon
Price elasticity measures the relationship between a price change and the resulting change in sales volume. On Amazon, most products in competitive categories are highly price-elastic — meaning a 5–10% price increase can cause a 15–30% drop in conversion, while a comparable price decrease can generate disproportionate volume gains.
The implication is that pricing decisions are never purely about margin per unit. They are about total margin contribution: the combination of per-unit profit and volume. A product priced at $27.99 with a $4.00 margin selling 400 units per month generates $1,600 in monthly profit. The same product priced at $24.99 with a $2.50 margin selling 700 units generates $1,750. The higher-volume, lower-price option is the better financial choice — but you will never discover that through assumption. You have to test it.
Dynamic Repricing With Guardrails
Dynamic repricing tools — software that adjusts prices in real time based on competitor pricing, Buy Box position, and demand signals — deliver 15–25% revenue improvements over static pricing for most product types in competitive categories. The key word is “guardrails.”
Sellers who set dynamic repricing without establishing minimum price floors based on their actual full-cost calculation — COGS plus all fees plus pro-rated ad spend — often find themselves in race-to-bottom scenarios where the repricing tool wins the Buy Box by destroying the margin. A minimum price floor calculated from your actual unit economics prevents the tool from taking you below breakeven in pursuit of volume.
The Buy Box Equation
Buy Box eligibility and allocation is one of Amazon’s most consequential and least transparent mechanisms. Price is a major input, but it is not the only one. Seller metrics — particularly Order Defect Rate (ODR), Late Shipment Rate, and Valid Tracking Rate — carry significant weight. FBA listings generally receive favorable treatment in Buy Box allocation. And account health history influences baseline eligibility.
For sellers in multi-seller categories, understanding that the Buy Box is not exclusively a price competition is important. A seller with slightly higher prices, excellent metrics, and FBA fulfillment will often win the Buy Box over a seller with lower prices and degraded seller performance metrics.
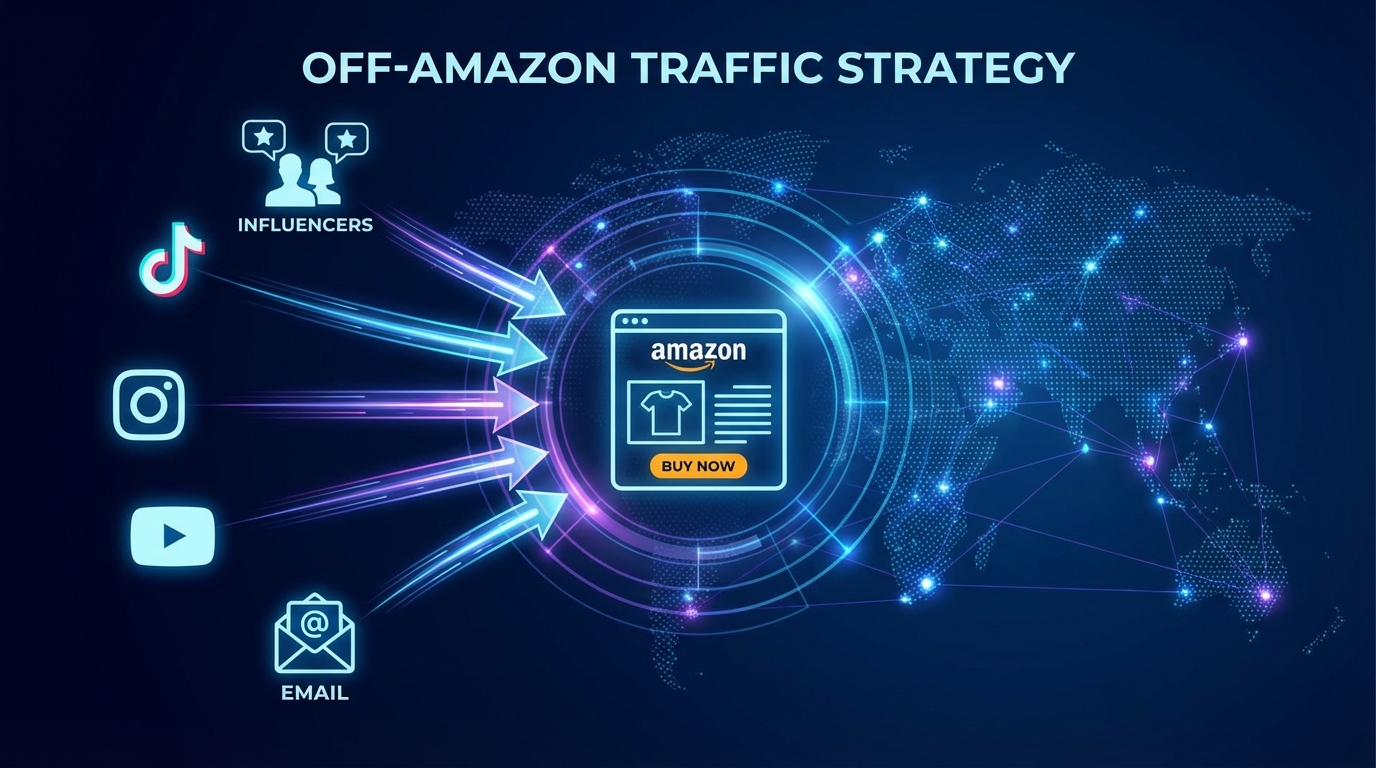
Off-Amazon Traffic — The Brand Referral Bonus Most Sellers Ignore
Amazon’s Brand Referral Bonus is one of the most underused tools in the seller arsenal. It offers brand-registered sellers approximately 10% of the sale price as a credit on referral fees when that sale is driven by verified external traffic through Amazon Attribution links. For a seller generating $500,000 annually from off-Amazon traffic sources, that is $50,000 in fee credits per year — equivalent to a significant margin improvement without changing a single product.
How the Bonus Actually Works
To participate, sellers must be enrolled in Amazon Brand Registry, use Amazon Attribution to generate trackable links for external campaigns, and drive those links to Amazon product pages. When a customer clicks an Attribution-tagged link from outside Amazon and makes a purchase, the 10% credit is applied to the seller’s referral fee on that order.
The mechanics are straightforward. The application is where most sellers fall short. Driving external traffic requires building audiences and content outside Amazon — which is a different skillset than managing an Amazon business, and one that many sellers have not developed.
The A10 Algorithm Advantage
Beyond the financial credit, external traffic carries an algorithmic benefit. Amazon’s A10 algorithm specifically rewards traffic that converts at high rates from external sources, treating this as a signal of genuine customer demand rather than marketplace-manipulated visibility. Products that receive consistent external traffic with strong conversion rates receive ranking boosts that can compound over time, reducing the reliance on paid advertising to maintain visibility.
The key metric Amazon appears to reward is not raw external traffic volume but conversion quality. Traffic that bounces — visitors who click through from social media and leave without purchasing — does not help rankings and may marginally hurt them. The objective is not to simply drive clicks from outside Amazon but to drive qualified buyers who were already intending to purchase.
Practical External Traffic Channels
Micro and nano influencer partnerships (10,000–100,000 followers) in relevant niches often deliver better ROI than macro-influencer deals for Amazon-specific traffic. Smaller audiences tend to be more engaged and more trusting of recommendations, driving higher conversion rates on the Attribution links. The Brand Referral Bonus makes these partnerships more financially attractive because the effective ad cost is reduced by 10% on every attributed sale.
Email marketing to an owned list remains one of the highest-converting external traffic sources. Sellers who have built an email list through previous purchases, lead magnets, or other opt-in mechanisms can drive near-zero-cost traffic to Amazon listings with Attribution links, capturing the 10% bonus on sales that would have cost nothing to generate.
Social platforms — particularly TikTok, Instagram, and YouTube — work best when content focuses on problem-solving or product education rather than direct promotion. A TikTok video demonstrating a kitchen tool’s use case performs better as a traffic driver than a promotional post, because it attracts viewers who are already in the problem-awareness phase of the buying journey.
Brand Building as a Margin Moat — The Private Label Playbook in 2026

The commodity-product era of Amazon private label is effectively over. Launching a generic version of an existing product with a slightly different label and expecting the algorithm to deliver sales worked in 2018. In 2026, with over 60% of Amazon sellers operating private label businesses and competition at the listing level more intense than ever, differentiation is not a growth strategy — it is a survival strategy.
What Real Differentiation Looks Like
Differentiation is frequently misunderstood as product innovation. Most successful Amazon private label brands have not invented new products. They have identified specific gaps in how existing products in their category are positioned, presented, or packaged — and filled those gaps more effectively than competitors.
Consider a home goods seller in the kitchen storage category. The category is crowded. But most listings are photographed on white backgrounds with clinical images and spec-heavy bullet points. A brand that invests in lifestyle photography showing the product in real kitchen contexts, writes bullet points in the language of the customer’s actual problem (“stops the morning chaos of searching for matching lids”), and builds an A+ module that addresses the top return reasons in competitor reviews is not building a different product. It is building a meaningfully better brand experience around the same product.
That brand experience commands pricing power. A product positioned as a thoughtful, premium solution in a commodity category can price at $29.99 where competitors sit at $21.99 — and convert at a comparable or better rate because the listing earns trust more effectively.
The Brand Registry Foundation
Amazon Brand Registry is the non-negotiable starting point for building a defensible presence on the platform. It provides IP protection against counterfeit listings, access to A+ Content (which increases conversion rates by up to 8% on average), Sponsored Brands advertising formats, a dedicated Brand Store, and access to the Brand Analytics data suite discussed earlier.
Sellers who have not enrolled their brand — even small-scale, early-stage private label businesses — are competing with one hand tied behind their back. The tools unlocked by Brand Registry are not advantages over generic sellers; they are the baseline requirements for operating a competitive brand in the current environment.
The Long-Term Brand Premium
The financial argument for brand building is ultimately about multiple. Commodity Amazon businesses — revenue-generating accounts without defensible brand assets — sell for 2–3x annual profit when exited. Brand-registered businesses with trademark protection, a diversified customer base, and off-Amazon presence sell for 4–6x and higher. The brand is not just a margin tool during operation. It is the primary value driver when the business is eventually sold.
Data suggests that differentiated private label brands with 18–35% EBITDA margins significantly outperform commodity sellers (typically 10–15% EBITDA) — both in absolute profitability and in the enterprise value that profitability generates upon exit.
The Cash Flow Problem Amazon Creates (And How to Manage It)

Amazon does not pay sellers the way most business owners intuitively expect. Revenue does not flow immediately. The combination of payout delays, inventory capital requirements, and advertising prepayment creates a cash flow dynamic that can put even profitable sellers under genuine financial pressure.
The DD+7 Payout Reality
Effective March 12, 2026, Amazon extended its standard payout schedule to DD+7 — meaning funds are disbursed 7 days after the delivery date of an order. For a seller who ships items with 2–3 day delivery and a 14-day selling cycle, funds from inventory ordered weeks ago may not hit the bank account for 3–4 weeks after that inventory was purchased.
This delay creates a compounding cash float. A seller doing $100,000 per month in revenue may have $25,000–$35,000 locked in the Amazon payout pipeline at any given time — money that has been earned but not yet received. For sellers operating close to their available capital, this float can prevent timely inventory reorders, leading to stockouts that hurt rankings and revenue simultaneously.
Inventory Capital as a Hidden Constraint
The capital tied up in FBA inventory is frequently invisible in P&L analysis. A seller with 3,000 units of inventory at $5 COGS has $15,000 locked in stock that is not generating return until those units sell. If that inventory turns every 45 days, the seller needs to maintain a rolling $15,000 inventory investment that never appears as cash.
When Amazon delays payouts, tightens inbound receiving times, or changes fulfillment routing (which affects how quickly inventory becomes “available”), that $15,000 can be effectively frozen for longer than planned. Sellers who haven’t modeled their cash cycle — the time from inventory purchase order to Amazon payout receipt — are frequently surprised to discover they are profitable on paper but cash-constrained in practice.
Building a Cash-Aware Inventory Model
The discipline of cash-aware inventory management involves calculating the full cash cycle for each major SKU: supplier lead time, shipping time to FBA, FBA receiving delay, days of inventory coverage, and payout delay. Layering those together gives you a realistic picture of how long your capital is tied up per reorder cycle.
With that number in hand, the goal is to build a cash reserve that covers at least one full reorder cycle for your top-revenue SKUs. Sellers who maintain this reserve avoid the stockout-ranking-decline spiral that punishes undercapitalized businesses disproportionately. Conversely, sellers who over-invest in inventory to avoid stockouts find themselves with aging stock, storage fees, and insufficient cash to respond to market opportunities or fee changes.
The balance point is not intuitive. It requires SKU-level reorder modeling, not gut-feel restocking.
Building a Sustainable Amazon Business in 2026 — The Practical Checklist
Across every dimension covered in this article, the sellers who are building durable, profitable Amazon businesses in 2026 share a common characteristic: they manage their businesses through structured, repeatable processes rather than reactive decisions. Below is the operational checklist that translates these insights into a monthly practice.
Monthly SKU-Level Profit Audit
- Pull actual per-ASIN data: gross revenue, referral fees, fulfillment fees, storage fees, inbound costs, returns, and actual ad spend
- Flag all SKUs below 10% net margin for immediate review: identify whether the issue is fees, return rate, ad spend, or pricing
- For negative-margin SKUs: decide within 30 days whether to reprice, reduce ad spend, switch fulfillment method, or discontinue
- Update minimum price floors across all active ASINs to reflect current fee structure
Return Rate Monitoring
- Review return reasons monthly per SKU using the Voice of Customer report in Seller Central
- Identify the top two return reasons per high-return-rate ASIN and make a specific listing change to address each
- Update A+ Content to address the most frequent objections or compatibility questions surfacing in Q&A and review comments
Advertising Guardrails
- Set ACoS caps per margin tier: a SKU with 15% net margin before ads cannot sustain 30% ACoS. Maximum sustainable ACoS equals net margin percentage (pre-ad) minus desired net margin target
- Audit negative keyword lists monthly to eliminate persistent wasted spend on irrelevant searches
- Review auto-campaign search term reports weekly and migrate converting terms to manual campaigns with appropriate bids
Inventory and Cash Flow
- Calculate the full cash cycle for your top 10 revenue SKUs quarterly
- Maintain a cash reserve covering at least one full reorder cycle for top-revenue SKUs
- Monitor aging inventory weekly for any products approaching the 181-day threshold — the doubled storage cost at that point is avoidable with timely price adjustments or removal orders
Brand and External Traffic
- Ensure all products are enrolled in Brand Registry and A+ Content is live on all top 20 ASINs by revenue
- Set up Amazon Attribution links for any external traffic sources currently driving Amazon visits
- Review Brand Analytics Search Query Performance report monthly to identify keyword gaps between impressions and conversions
Conclusion: The Sellers Who Win in 2026 Know Their Numbers Exactly
Amazon has not become a bad place to build a business. It remains one of the most accessible routes to building a profitable product company in existence. But the era of building an Amazon business on approximations — estimated margins, average fees, rough return rate assumptions — is over.
In 2026, the platform’s fee complexity, competitive density, and margin compression demand a level of operational precision that would have felt excessive three years ago. SKU-level profitability analysis is not a nice-to-have — it is the baseline. Understanding the full fee stack per unit is not advanced knowledge — it is the minimum.
The sellers who are growing profitably right now share a consistent pattern: they know what each unit actually costs them, they manage their catalog with a two-speed approach that concentrates effort where it generates the most return, they treat return rates as a listing quality signal rather than a logistics problem, and they build their business with enough cash awareness to weather the inevitable payout delays and fee surprises.
None of this requires a team of analysts or expensive software. It requires the discipline to run the same calculations consistently and act on what the numbers say — even when that means discontinuing a product you launched with high hopes, cutting ad spend on a favorite SKU, or accepting that a fulfillment model switch is the only path back to margin.
The Amazon opportunity in 2026 is real. The sellers who capture it fully will be the ones who treat it as the financial discipline exercise it has become — not just the product selection challenge it once was.