

There is no shortage of Amazon advice on the internet. Listicles, YouTube teardowns, Reddit threads, paid courses — the ecosystem of “how to sell on Amazon” content is essentially infinite. And yet, the gap between sellers who are merely surviving and sellers who are genuinely building sustainable, growing businesses has never been wider.
Here is the uncomfortable truth: most Amazon advice is either too generic to act on, or too tactical to be strategic. “Optimize your listing” tells you nothing about how. “Run PPC” ignores the structural decisions that make PPC profitable in the first place. And “choose a good niche” skips the entire methodology behind what makes a niche worth entering at all.
This post is different. What follows is a collection of ten strategies — not tips, not tricks — that reflect how Amazon’s marketplace actually operates in 2026. Each one is grounded in current data, tied to real outcomes, and designed to work together as a system rather than a checklist of isolated actions.
The sellers pulling ahead right now aren’t doing ten different things moderately well. They’re doing a handful of things with precision, measurement, and consistency. These are those things.
Strategy 1: Dominate a Micro-Niche Before You Scale Horizontally
One of the most expensive mistakes a new or growing Amazon seller can make is trying to be competitive across too many categories too quickly. The sellers who consistently build durable market positions in 2026 share a counter-intuitive approach: they go narrow first, and only expand once they’ve established undeniable dominance in a tightly scoped niche.
Why Narrow Niches Are Structurally Advantageous
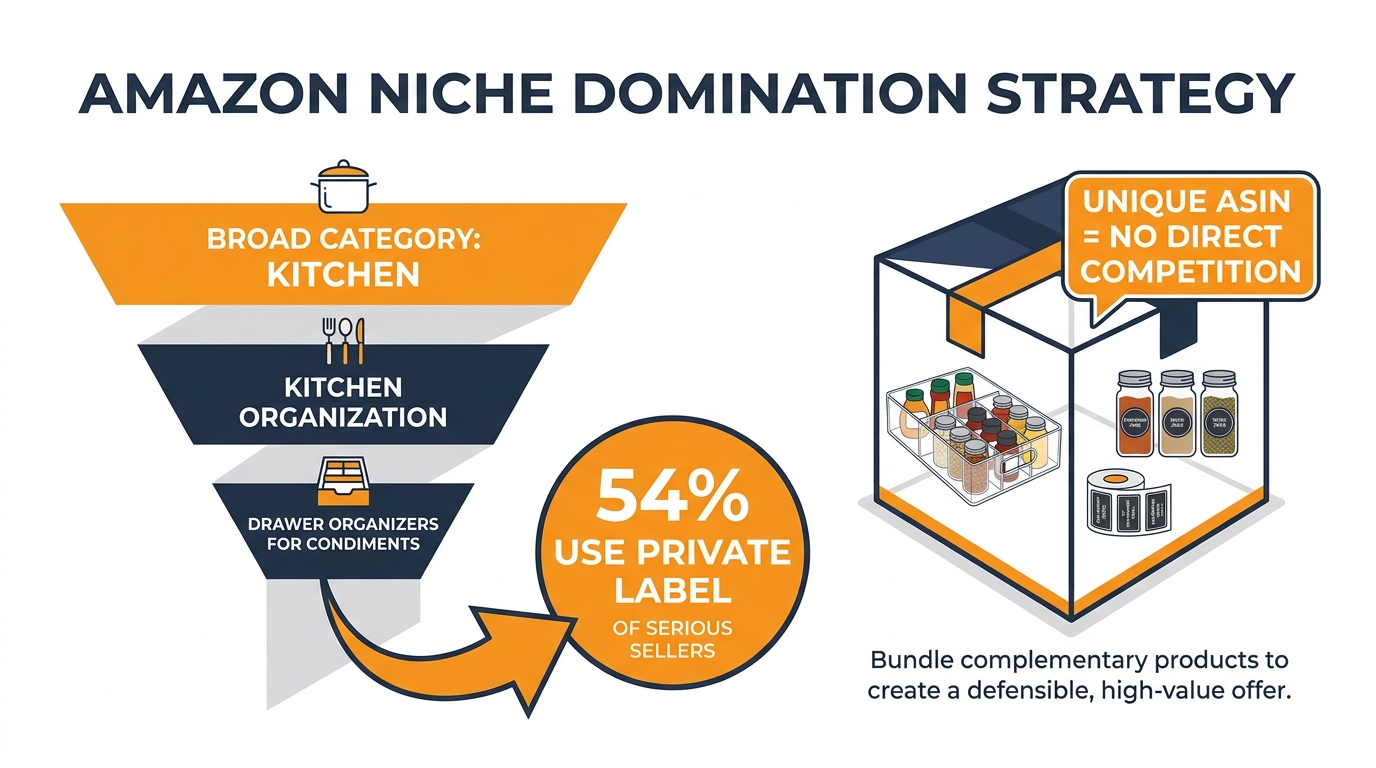
Data from Jungle Scout confirms that approximately 54% of serious Amazon sellers now use private label as their primary model — a figure that reflects a fundamental shift in the marketplace away from commodity reselling and toward brand ownership. The reason is simple: when you own a brand in a narrow niche, you control the conversation. Competitors can’t easily replicate what you’ve built, and your reviews accumulate under your ASIN rather than a shared product page.
The practical framework for micro-niche domination follows three stages. First, category narrowing: instead of targeting “Kitchen Organization,” you target “Drawer Organizers for Spice Packets” or “Under-Sink Cabinet Shelf Systems for Small Apartments.” The specificity creates a buyer with a very defined problem — and a very high likelihood of converting when they land on your listing.
Second, demand validation: tools like Helium 10, Data Dive, and Jungle Scout exist precisely for this step. You’re looking for search volume that confirms real buyer intent, competition depth that doesn’t include entrenched brands with thousands of reviews, and a price point that leaves margin after FBA fees and advertising. The mistake most sellers make is skipping this step and relying on instinct — which is how you end up with 500 units of a product nobody actually searches for.
Third, review mining for differentiation: this is where genuine product development happens. Mining 1- and 2-star reviews of your top competitors reveals exactly what buyers are frustrated about. A weak handle. Poor packaging that arrives damaged. A size that doesn’t fit standard shelf dimensions. Every complaint is a product brief. Solve the top three complaints and you’ve created a meaningfully better product, not just a cheaper knock-off of what’s already on page one.
The Horizontal Expansion Trap
Sellers who rush to launch additional SKUs before mastering one niche typically find themselves spread across five categories, none of which have enough review velocity to rank organically, and all of which require separate PPC budgets that drain cash flow. The successful model in 2026 is to own your first niche so completely — top rankings, strong review count, A+ Content, Brand Store — that it funds the next niche entry from a position of strength rather than desperation.
Emerging categories worth attention in 2026 include pet grooming accessories, kitchen organization, sustainable home goods, and functional baby products. What these share: consistent demand, identifiable buyer frustration in reviews, and price points that support real margins. But any category can work if you do the research first.
Strategy 2: Engineer a Buy Box Win That Isn’t Just About Price
The Buy Box — or “Featured Offer” in Amazon’s current terminology — determines which seller gets the default purchase button on a listing. Most sellers still believe price is the primary lever. In 2026, that belief is measurably costing them sales.
How the Algorithm Actually Weights Factors Now
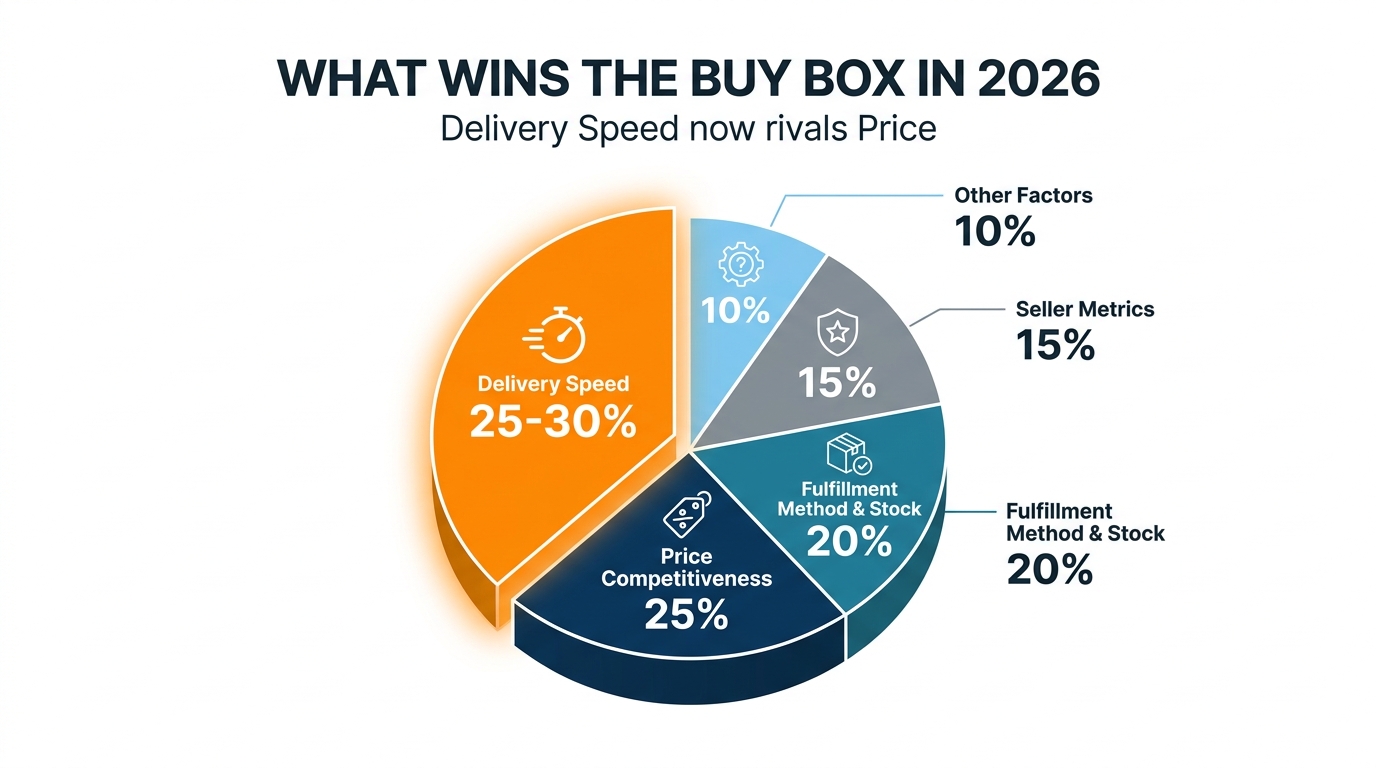
The Buy Box algorithm has shifted significantly over the past 18 months. Based on current analysis from multiple seller data platforms, the approximate weighting in 2026 looks substantially different from even two years ago:
- Delivery Speed: 25–30% (up from roughly 15% in prior years)
- Price Competitiveness: ~25% (down from ~35%)
- Fulfillment Method & Stock Availability: ~20%
- Seller Metrics (ODR, feedback score, VTR): ~15%
- Other Factors: ~10%
The most consequential change here is the rise of delivery speed as a near-equal factor to price. Analysis suggests sellers offering same-day or next-day delivery see up to an 18% improvement in Buy Box win rate compared to sellers offering identical pricing but standard delivery windows. This has significant implications for how sellers structure their fulfillment.
The Price Tolerance Band
On pricing specifically: the algorithm now operates within a tolerance band of approximately 2–3% of the lowest landed price (the price inclusive of shipping). What this means practically is that a seller priced at $20.60 with next-day delivery can legitimately beat a seller priced at $20.00 with standard 4–7 day shipping. The algorithm rewards the total value proposition, not the lowest number.
Offers priced more than 5% above the lowest competitive offer face immediate visibility penalties — they drop out of Buy Box rotation almost entirely. This tightened tolerance was introduced through 2025 updates and has been enforced consistently through 2026.
Fulfillment Strategy for Buy Box Optimization
FBA remains the single most reliable path to Buy Box dominance for most sellers, because Amazon’s own fulfillment infrastructure guarantees the delivery speed and tracking reliability (95%+ Valid Tracking Rate requirement) that the algorithm rewards. However, Seller-Fulfilled Prime (SFP) and even strong standard FBM can compete effectively if the seller maintains excellent metrics and quick dispatch times.
The practical takeaway: review your current fulfillment setup against delivery speed data by region. If your FBA inventory is concentrated in one fulfillment center and your customers are spread nationally, your effective delivery speed is lower than Amazon’s Prime badge implies. Splitting inventory across multiple FCs — or using Amazon’s own inventory placement recommendations — directly impacts your Buy Box eligibility.
Strategy 3: Build a Brand Store That Functions as a Real Conversion Engine
Most Amazon Brand Stores are treated as afterthoughts — a few product grids, a hero banner with the brand logo, and a “Shop All” page that nobody navigates to. This is a significant missed opportunity, particularly after Amazon’s January 2026 rollout of section-level analytics for Brand Stores.
The New Analytics Layer Changes Everything
Amazon Ads rolled out section-level insights for Brand Stores in beta at the start of 2026, making it possible for sellers to see renders, viewable impressions, clicks, and CTR for each individual section of their storefront. This transforms the Brand Store from a static brand asset into a measurable landing page that can be actively optimized.
The implications are substantial. A section with high renders but low clicks signals a messaging problem — the content is being seen but not compelling action. A section with high CTR but low downstream conversions points to a product-expectation mismatch. Weekly review of these metrics, treating the Brand Store with the same analytical rigor as a paid search campaign, is how leading sellers are using this data in 2026.
Architecture That Reduces “Back to Search” Behavior
The core function of a high-performing Brand Store is to reduce what’s sometimes called “back to search” behavior — the customer pattern of landing on a listing, not finding exactly what they want, and returning to search results where your competitor awaits them. A well-architected Brand Store intercepts this behavior by surfacing complementary products, different size or variant options, and use-case-specific collections that keep the buyer within your brand ecosystem.
Research on Brand Store engagement consistently shows a 40% higher customer engagement rate for stores that feature dynamic content — video demos, lifestyle context, curated collections by use case — compared to basic product grid layouts. The engagement differential also shows up in repeat purchase rates, because a buyer who explored your full brand catalog and made a deliberate choice is more likely to return than one who defaulted to the first listing in search results.
Actionable Store Architecture Framework
Structure your Brand Store around buyer intent rather than product categories. Instead of tabs labeled “Products” and “New Arrivals,” use intent-based navigation: “For Small Kitchens,” “Starter Sets,” “Gift Ideas Under $40.” Each page should have a hero image that speaks to the use case, 3–5 featured products, and a clear call to action. Add at least one video per major section — even a 30-second product demo significantly increases time-on-page and conversion likelihood.
Amazon’s Brand Keys Customer Loyalty Engagement Index has ranked Amazon #1 in Online Retail for 15 consecutive years. Sellers who tap into that trust by presenting a professional, coherent brand experience within the platform see disproportionate loyalty benefits — because buyers don’t associate their trust with a generic listing, they associate it with your brand specifically.
Strategy 4: Activate External Traffic with Amazon Attribution (and Get Paid to Do It)
Amazon’s internal advertising costs have risen steadily — ad spend growth on the platform is running at approximately 20% year-over-year, meaning that competing purely within Amazon’s ad ecosystem is becoming an increasingly expensive arms race. The sellers who are finding structural cost advantages in 2026 are the ones pulling qualified buyers from off-platform channels and, critically, getting Amazon to subsidize the effort.
The Brand Referral Bonus: Amazon Pays You for External Traffic
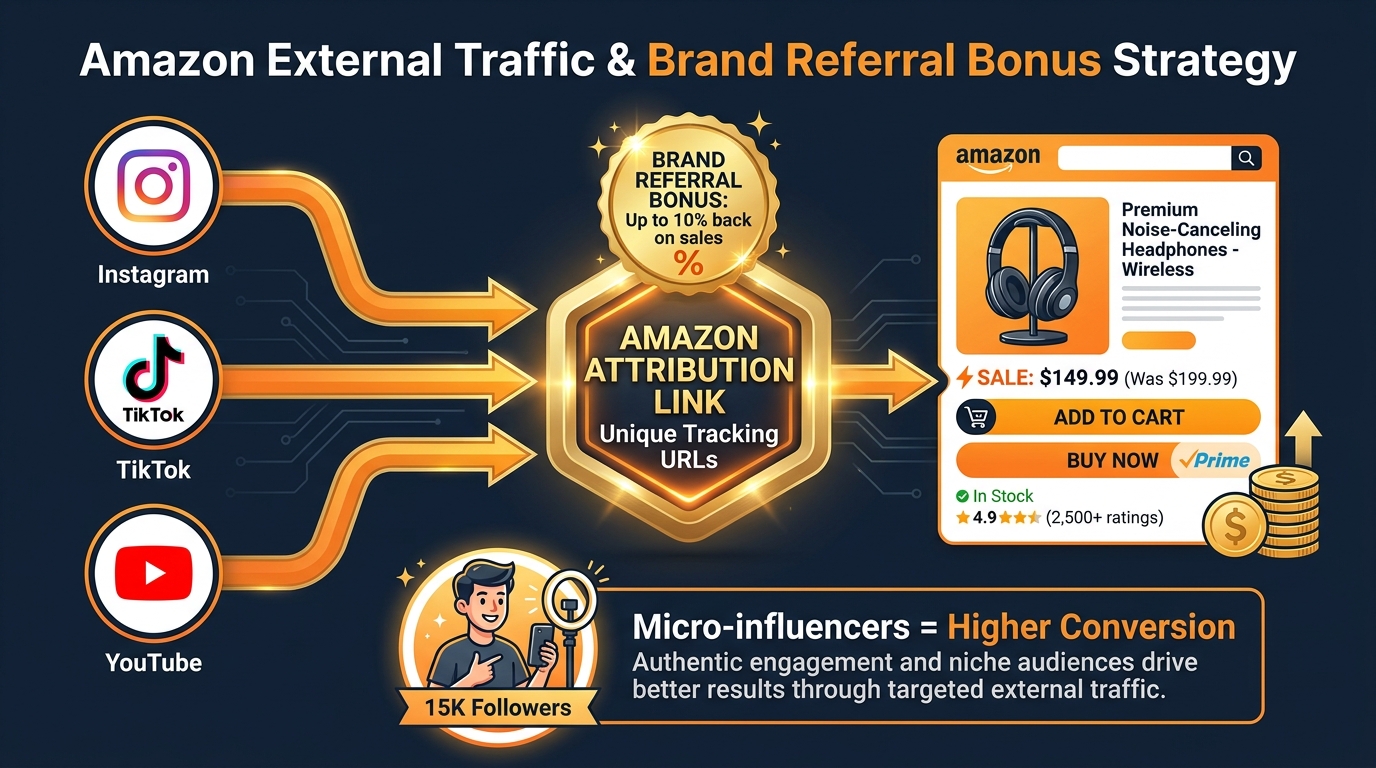
The Brand Referral Bonus program is one of the most underutilized levers in the Amazon seller toolkit. Registered brand owners who drive external traffic to their Amazon listings through Amazon Attribution links receive a credit — typically between 5–10% of the attributed sale value — applied back to their seller account. In practical terms, this means that a sale driven by your Instagram campaign or influencer partner costs you less in effective referral fees than a purely organic Amazon sale.
The mechanism: you generate a unique Amazon Attribution tracking URL for each off-platform campaign. When a buyer clicks that link and purchases within a defined attribution window, Amazon credits the bonus to your account. You track which channels are driving sales and at what cost, and Amazon essentially rewards you for reducing platform dependency while sending buyers there anyway. It’s one of the few win-win structures in Amazon’s relationship with third-party sellers.
Channels Worth Building for External Traffic
Not all external traffic sources are equal in terms of conversion quality when landing on an Amazon listing. Based on current performance data, the highest-converting external channels tend to be:
- Email lists: Buyers who opted in to hear from your brand have the highest intent and familiarity. Even a modest list of 5,000 engaged subscribers can drive meaningful sales velocity during launches and promotions.
- Micro-influencer partnerships (10K–100K followers): Authenticity and audience alignment matter more than follower count. A micro-influencer in the exact niche your product serves consistently outperforms a generic macro-influencer in terms of conversion rate.
- YouTube product review content: Evergreen video content continues to drive long-tail traffic months after publication, making it one of the highest ROI external channels for the effort invested.
- Pinterest for visual product categories: Often overlooked, Pinterest drives high-intent shoppers in categories like home decor, kitchen, beauty, and outdoor living — buyers who are actively planning purchases rather than browsing passively.
Attribution as a Measurement Discipline
The critical discipline here is treating Amazon Attribution with the same rigor as any paid marketing channel. Set up separate attribution links for each campaign, each influencer, each email send. Review the data weekly to identify which sources are driving sales at acceptable cost, and which are burning budget for clicks that don’t convert. Data-led sellers who operate this way grow 23% faster than those relying on internal Amazon advertising alone, according to platform analysis.
Strategy 5: Use the Influencer Wholesale Method to Find Your Next Winner
Product research is where most sellers spend too little time and too much guesswork. A methodology gaining significant traction in 2026 bypasses the traditional “spreadsheet + Helium 10” approach in favor of something more market-signal-driven: finding products that influencers are already selling successfully, then sourcing and listing those products on Amazon before the trend reaches saturation.
How the Method Works
The core observation is simple: when a credible influencer with a genuine audience launches or promotes a physical product, they’ve already done the demand validation for you. They know their audience. They tested the product organically. The engagement on their content — views, comments, saves, purchases — is real market signal, not keyword tool estimates.
The tactical process:
- Social media scanning: Follow TikTok, Instagram, and YouTube channels in your target category. When you see an influencer product generating consistent engagement (not just a spike from a single video), that’s a signal worth investigating.
- Helium 10 or Jungle Scout validation: Take the product to your research tools. Look for Amazon search volume and whether any existing listings are meeting demand — or whether there’s a gap between social buzz and marketplace supply.
- Sourcing the gap: If the influencer product is genuinely differentiated, approach manufacturers to produce a comparable or improved version. If it’s essentially a commodity with demand, source it wholesale and position aggressively on Amazon before the category fills up.
- Launch with momentum: New products in categories with existing social proof benefit from the residual search interest — customers who saw the influencer content and went to Amazon to find something similar become your organic traffic before you’ve spent a dollar on advertising.
Why This Outperforms Standard Product Research in 2026
Traditional product research tools tell you where demand already exists on Amazon — meaning, where competition is already established. The influencer wholesale method identifies demand that’s building on social platforms before it fully migrates to Amazon search behavior. The window of opportunity is typically 3–9 months between initial social traction and the category becoming competitive on Amazon. That window is where first-mover advantage lives.
TikTok virality signals are particularly valuable: analysis suggests that TikTok viral product moments can predict Amazon demand surges of 40–80% within 60–90 days of peak social engagement. Sellers who catch this signal early and have inventory ready often see ranking velocity that would take months to achieve through conventional PPC-heavy launches.
Strategy 6: Build Inventory Resilience with a Hybrid Push-Pull System
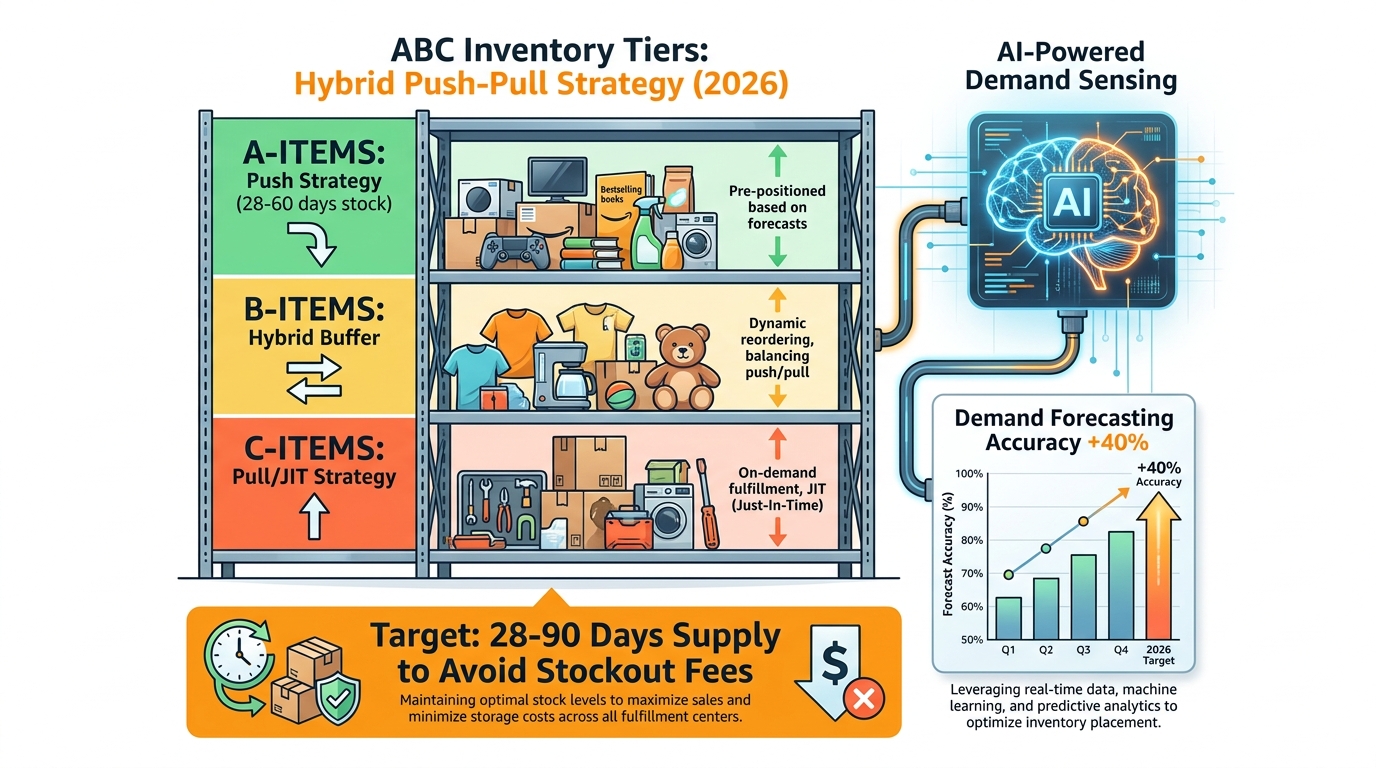
Inventory management is the operational backbone of an Amazon business, and it’s where many sellers bleed profitability silently. Running out of stock means losing rank, losing Buy Box eligibility, and potentially losing customers permanently. Carrying too much inventory means excessive FBA storage fees and tied-up capital. In 2026, the approach that consistently outperforms is a hybrid system that treats different SKUs with fundamentally different logic.
The ABC Classification Framework
Not all SKUs deserve the same inventory treatment. The ABC classification framework — borrowed from supply chain management — divides your catalog by a combination of sales volume, margin contribution, and demand predictability:
- A-Items: High volume, consistent demand, proven sales history. These deserve a push strategy — you forecast forward based on historical velocity, maintain 45–60 days of safety stock, and automate reorder triggers well before the minimum inventory threshold. A stockout on your top ASIN is the most expensive operational failure you can have. Treat prevention as non-negotiable.
- B-Items: Moderate volume, some seasonality, developing history. These warrant a hybrid buffer — enough stock to handle a 20–30% demand spike without crossing into excess territory. Review reorder points monthly as sales data matures.
- C-Items: Low volume, unpredictable demand, or early-stage SKUs. A pull or Just-in-Time approach makes sense here — maintain minimal on-hand inventory and replenish based on actual orders rather than forecast, to avoid locking capital into slow-moving ASINs.
Amazon’s Native Tools for Smarter Restocking
Amazon’s own infrastructure has expanded significantly for inventory management. The Amazon Warehousing and Distribution (AWD) program now offers automatic replenishment from a lower-cost storage facility to FBA fulfillment centers — essentially a two-tier system where you hold bulk inventory cheaply in AWD and let Amazon’s automation manage the FBA transfer. For high-volume sellers, this can meaningfully reduce both storage costs and the manual overhead of monitoring restock levels.
Amazon also enforces a Minimum Inventory Level metric — sellers who regularly fall below it face a low-inventory fee. Keeping above this threshold is no longer optional; it’s a cost avoidance discipline as much as a sales optimization one. The target range most supply chain advisors recommend for 2026 is maintaining between 28 and 90 days of supply across your active FBA inventory, calibrated to your lead times and seasonal demand patterns.
The Hidden Cost of Reactive Inventory Management
Sellers who manage inventory reactively — noticing a stockout only after it happens, then scrambling to expedite shipment — are absorbing costs that rarely show up as a single line item but erode margins consistently: expedited freight premiums, ranking recovery advertising spend, lost sales during the gap period, and the compounding effect on review velocity. A single stockout on a top-10 BSR ASIN can require 3–6 weeks of recovery time and significant ad spend to restore previous organic position. Prevention is orders of magnitude cheaper than recovery.
Strategy 7: Expand to EU Marketplaces While Most US Sellers Aren’t Looking
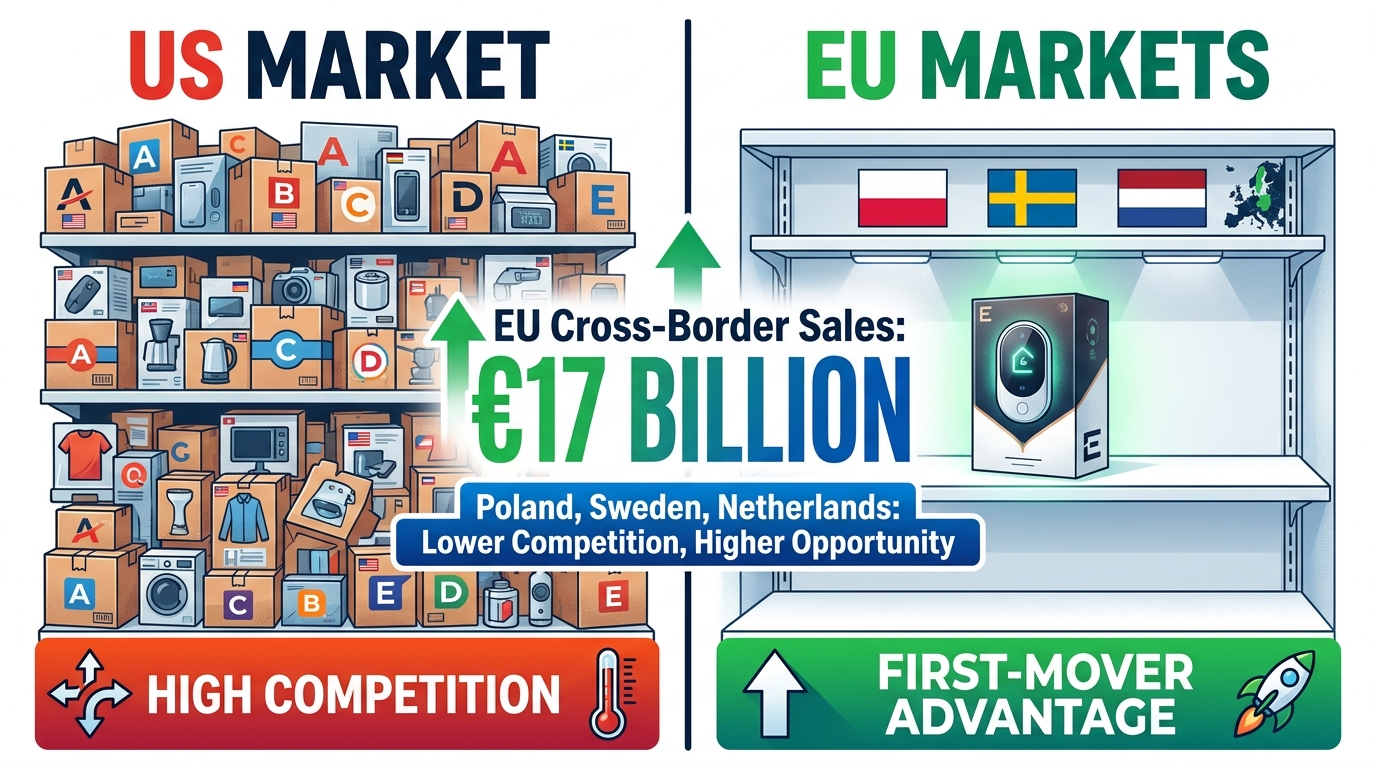
The US Amazon marketplace is, by most objective measures, extremely competitive. Categories that were relatively accessible three years ago now require significant capital, a strong review base, and a sophisticated advertising operation just to achieve visibility. Meanwhile, a significant geographic arbitrage opportunity has developed quietly across the EU — and most US-centric sellers aren’t pursuing it.
The EU Market Reality in 2026
The numbers are striking. EU SMEs collectively exceeded €40 billion in Amazon sales for the first time in 2026 (based on 2025 performance data, the first year to break this threshold). Cross-border EU sales alone reached €17 billion — up €2 billion year-over-year. Over 100,000 EU-based SMEs are now actively selling on Amazon, with 85% exporting internationally and cross-border sales accounting for more than 40% of total revenue for European Amazon sellers.
From a competitive density perspective, markets like Poland, Sweden, and the Netherlands are drawing particular attention in 2026 for their combination of growing e-commerce adoption, lower established competition versus Germany or the UK, and improved cross-border logistics infrastructure. Amazon’s Pan-EU FBA program — which now includes the Netherlands following its 2025 integration — allows automatic inventory distribution across EU countries from a single shipment, removing much of the operational complexity that previously made multi-market EU selling prohibitive for smaller sellers.
Why the Opportunity Window Is Still Open (But Narrowing)
EU e-commerce adoption continues to lag the US by several years in most categories, meaning buyer behaviors and category saturation levels resemble what US Amazon looked like in 2018–2020. Germany — Amazon’s second-largest global marketplace at approximately $38 billion in annual GMV — has the deepest pool of buyers but is becoming more competitive. The emerging markets within the EU offer the clearest first-mover dynamics.
The cross-border growth rate across EU marketplaces is running at approximately 25% year-over-year — a pace that suggests this window will not remain as accessible indefinitely. Sellers who establish positions now, build review velocity in less competitive environments, and develop localized listings will have structural advantages by the time competition intensifies in 2027 and 2028.
Practical Entry Strategy
The most efficient EU entry path for established US sellers uses existing product catalog as a starting point, testing with 2–3 of your strongest ASINs in one market (Germany is typically the highest-volume starting point, even accounting for its competition) before expanding. Key requirements: VAT registration in your target markets, translated listings that go beyond machine translation (professional translation for bullet points and A+ Content pays for itself quickly in conversion rate), and compliance with EU-specific product regulations for your category. Pan-EU FBA handles the logistics complexity once your inventory is in the network.
Strategy 8: Build Social Proof Architecture, Not Just Reviews
Reviews matter enormously on Amazon — this is not news. What is evolving is how sophisticated sellers are thinking about social proof as a structural element of their business rather than a vanity metric to chase. In 2026, the distinction between sellers who get reviews and sellers who architect social proof is becoming increasingly visible in conversion rates and ranking stability.
Review Velocity as a Ranking Signal
Amazon’s A9/A10 algorithm weighs review velocity — the rate at which new reviews accumulate — as an indicator of current market relevance. A listing with 800 reviews but few recent ones signals a product that may no longer be actively selling. A listing with 200 reviews but consistent weekly accumulation signals an actively selling, engaged product. The implication: a review strategy isn’t something you complete once and move on from. It’s an ongoing operational discipline.
The mechanics in 2026 center on Amazon’s native “Request a Review” button and automated follow-up sequences through approved third-party tools (tools like FeedbackFive operate within Amazon’s Terms of Service for automated review requests). Timing matters: review request messages sent between days 4 and 8 after delivery consistently outperform earlier or later sends. Too early, and the buyer hasn’t had time to form a meaningful opinion. Too late, and the purchase has receded from memory.
UGC as a Dual-Purpose Asset
User-generated content — customer photos and videos of your product in use — serves two functions simultaneously. On-listing, it provides authentic social proof that increases buyer confidence, particularly for purchases where buyers have uncertainty about real-world fit, size, or quality. Off-listing, it’s repurposable for paid social ads, where authenticity consistently outperforms polished brand creative in engagement and conversion metrics.
The Blueland brand case study is instructive here. Using a micro-influencer gifting campaign with 211 influencers, they generated 247,000 impressions and a 4.6% engagement rate, which translated to a 6.3x improvement in Amazon Best Seller Rank (from #36,000 to #5,800) and a 4.7x increase in monthly sales, representing approximately $129,000 in incremental revenue at a 13x return on investment. Critically, the UGC generated in that campaign was then repurposed into listing imagery and paid social ads — multiplying the value of the original investment significantly.
The Feedback Loop Between Reviews and Advertising
There’s an important mechanical relationship between review count and advertising efficiency that many sellers overlook. A listing with fewer than 15 reviews typically converts at a significantly lower rate than one with 50+ reviews, regardless of ad quality. This means the same advertising spend produces fewer sales — and fewer sales mean less organic rank improvement per ad dollar. Prioritizing review accumulation on a new ASIN before scaling ad spend is not patience — it’s efficiency. The conversion rate increase from crossing the 50-review threshold can reduce your effective Cost Per Acquisition by 30–40%, making every subsequent ad dollar more productive.
Strategy 9: Segment Your PPC Campaigns and Manage TACoS, Not Just ACoS
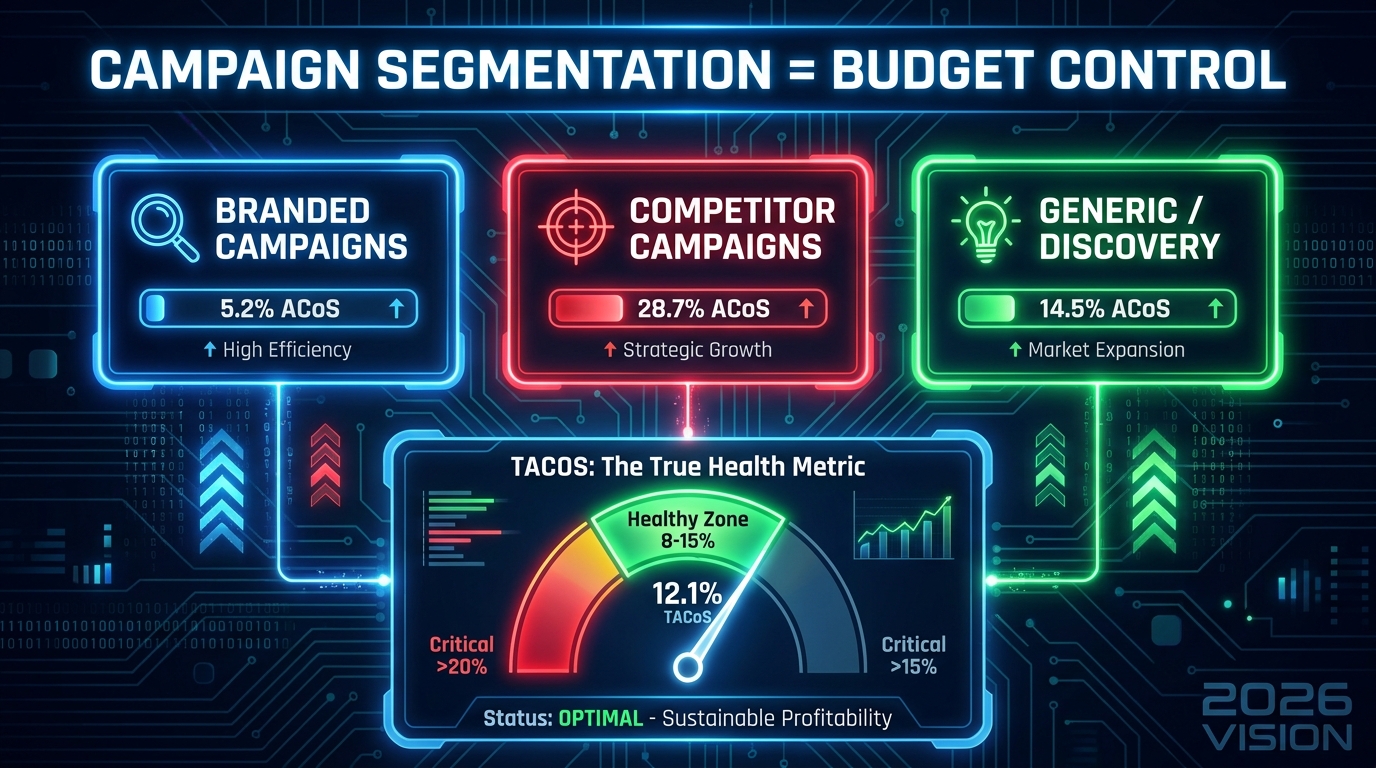
Amazon advertising is now a significant cost center for most sellers — and with category-wide ad spend growing at roughly 20% annually, the question isn’t whether you should advertise, but whether you’re advertising intelligently. The sellers consistently extracting profitable outcomes from Amazon PPC share one structural discipline: they segment their campaigns by intent, and they manage Total Advertising Cost of Sale (TACoS) rather than the narrower Advertising Cost of Sale (ACoS) metric that most dashboards highlight by default.
Why Campaign Segmentation Is Non-Negotiable
Running all keywords through a single Sponsored Product campaign — or even just auto and manual campaigns — is the advertising equivalent of pointing a fire hose in a general direction and hoping some water hits the target. Effective PPC architecture in 2026 separates campaigns into at least three distinct buckets:
- Branded Campaigns: Keywords featuring your own brand name or ASIN. These typically have the highest conversion rate and lowest ACoS of any campaign type, because the buyer is already brand-aware and intent is explicit. Bidding on your own branded terms protects your visibility and prevents competitors from stealing these high-intent clicks with their own conquesting campaigns.
- Competitor Campaigns: Keywords or ASINs targeting direct competitors. These are inherently less efficient (lower conversion rates, higher CPCs) but serve a specific purpose: intercepting buyers who are evaluating alternatives. These campaigns require tight budget discipline and regular negative keyword additions to prevent budget waste.
- Generic / Discovery Campaigns: Broad category keywords where you’re fishing for new customer acquisition. These tend to have higher ACoS but are necessary for building awareness in buyers who don’t yet know your brand exists. Long-tail keyword targeting within this bucket dramatically improves efficiency — a buyer searching “stainless steel insulated travel mug with handle for backpack” has far higher purchase intent than one searching “travel mug.”
Understanding TACoS as a Business Health Metric
ACoS (Advertising Cost of Sale) measures your ad spend as a percentage of ad-attributed revenue only. This creates a distorted picture because it ignores organic sales that your advertising helped generate through improved ranking. TACoS — Total Advertising Cost of Sale — divides your total ad spend by your total revenue (organic + ad-attributed), giving you a true picture of what advertising is actually costing your business.
A healthy TACoS range for most established Amazon businesses in 2026 is approximately 8–15%, depending on category margins and business stage. A new product launch might justifiably run TACoS of 25–40% as it builds rank and review velocity. An established listing with strong organic rank should be trending toward 5–10%. If your TACoS is rising over time on an established product, it means you’re losing organic rank and becoming more dependent on paid traffic to maintain sales volume — a warning signal worth investigating immediately.
The Single-Keyword Ad Group (SPAG) Approach
For sellers managing larger catalogs and looking for precise keyword-level bid control, the Single Product Ad Group (SPAG) method isolates individual keywords into their own ad groups, allowing you to see exact-match performance data for each keyword in isolation and adjust bids without the crosstalk that occurs in multi-keyword groups. This approach requires more setup effort but consistently delivers better data quality and bid efficiency for sellers with the catalog size to justify it.
Strategy 10: Create Proprietary ASINs Through Strategic Product Bundling
Of all the strategies in this post, bundling deserves special attention because it simultaneously addresses multiple competitive vulnerabilities: price competition, Buy Box sharing, review splitting, and copycatting. A well-designed product bundle creates a proprietary ASIN that no other seller can list on — which means you own 100% of the buy box, 100% of the reviews, and 100% of the pricing power.
How Bundles Create Structural Competitive Moats
When you sell a standalone product that’s also available from multiple other sellers — or worse, a generic that any supplier can replicate — you’re always competing on price. Your reviews accumulate on a shared ASIN. Your Buy Box win rate depends on a fractional algorithm you don’t control. Competitors can list the same product overnight.
A bundle changes all of this. Combine your standalone product with a complementary item that buyers frequently purchase together, and you’ve created a unique ASIN that sits in its own search result position. Buyers searching for keywords that match both components of your bundle encounter your listing — and no one else’s. You set the price. You accumulate all reviews. You hold the Buy Box by default.
Bundle Design Methodology
The most effective bundles aren’t random combinations of products — they’re designed around keyword intent and buyer behavior data. The process:
- Identify the core product’s peripheral needs: What else does a buyer typically need within 30 days of purchasing your product? Customer reviews often mention companion products explicitly (“would be great with a storage case”). This is your bundle component.
- Validate the bundle keyword: Search Amazon for phrases like “[core product] with [complement]” or “[core product] set.” If Amazon autocomplete surfaces the phrase or if existing search volume shows buyer demand for the combination, you have confirmation that the bundle serves real purchase intent.
- Confirm the economics: The bundle’s combined COGS plus FBA fees for a larger/heavier package must still produce acceptable margin at a price point buyers will pay. Generally, bundles should price at 15–25% below what the individual components would cost purchased separately, while still improving your per-unit margin through higher Average Order Value and consolidated ad spend.
- Use packaging as part of the value proposition: Premium packaging — a reusable case, a travel pouch, a storage box — transforms the bundle’s perceived value without proportionally increasing cost. The “unboxing experience” created by thoughtful packaging also generates better photos and UGC from customers who feel they received something worth sharing.
High-Opportunity Categories for Bundling in 2026
Beauty, pet supplies, kitchen organization, baby products, and outdoor gear are consistently among the highest-performing bundle categories because buyers in these spaces are frequent repeat purchasers who value convenience and completeness. A pet grooming bundle (brush + nail trimmer + storage pouch) addresses multiple adjacent needs in one purchase — the average order value increases, the buyer’s friction decreases, and your proprietary ASIN faces no direct competition on Amazon’s product page.
Making the Strategies Work Together: The Integrated Seller Operating System
Reading these ten strategies individually might create the impression that they’re separate initiatives — a menu of options to pick from based on time and budget. That’s a less productive framing. The sellers who extract the most from these approaches are those who understand how they compound when implemented together.
The Compounding Relationships
Consider how niche domination (Strategy 1) enables everything downstream: a focused niche means more relevant UGC (Strategy 8), more efficient keyword targeting in PPC (Strategy 9), and a brand store that cohesively serves one clearly defined audience (Strategy 3). The Bundle strategy (Strategy 10) is only possible after you understand your niche deeply enough to know what complementary products buyers actually want. EU expansion (Strategy 7) is most viable once you’ve refined your listing quality and review base in a primary market — you’re taking a proven asset to a new geography, not testing an unproven product in an unfamiliar environment.
External traffic (Strategy 4) feeds Buy Box performance (Strategy 2) through sales velocity, which in turn feeds organic rank, which reduces your reliance on paid traffic — a virtuous cycle that gradually improves TACoS over time (Strategy 9). Inventory resilience (Strategy 6) is what keeps the entire system running — a stockout breaks every other strategy simultaneously.
A Practical Sequencing Framework
For sellers earlier in their Amazon journey, a reasonable sequencing priority looks like this:
- Nail niche selection and product differentiation (Strategy 1)
- Build a review base to at least 50+ before scaling ads (Strategy 8)
- Establish inventory management systems before volume requires it (Strategy 6)
- Structure PPC properly from the start (Strategy 9)
- Build the Brand Store as reviews accumulate (Strategy 3)
- Add external traffic once the listing converts well (Strategy 4)
- Develop bundles as you understand buyer behavior (Strategy 10)
- Pursue Buy Box optimization as catalog matures (Strategy 2)
- Explore EU expansion once the US business is stable (Strategy 7)
- Integrate the influencer wholesale method for next product discovery (Strategy 5)
For established sellers with existing catalog and revenue, many of these can be pursued in parallel — but it’s worth auditing which of the ten are genuinely operational versus which are being done halfway. A partial implementation of any of these strategies delivers a fraction of the potential return.
Conclusion: Strategy Is What Separates Durable Amazon Businesses from Fragile Ones
Amazon in 2026 is not a forgiving marketplace for sellers who approach it reactively. Rising advertising costs, tightening Buy Box algorithms, growing sophistication among competing sellers, and Amazon’s own continued expansion into private label categories all create pressure that rewards structure, data discipline, and deliberate strategy.
The ten strategies in this post share a common thread: they’re all about building assets rather than chasing short-term wins. A micro-niche position is an asset. A branded Amazon store is an asset. An external traffic channel with a strong Brand Referral Bonus return is an asset. A proprietary bundle ASIN with 300+ reviews and no direct competitors is an asset. Each one requires investment — of time, attention, and often capital — but each one also compounds over time in ways that purely tactical plays do not.
The sellers who will look back on 2026 as the year they pulled definitively ahead are the ones who stopped treating Amazon as a series of one-off transactions and started treating it as a platform on which they’re systematically building a brand that buyers trust, algorithms reward, and competitors can’t easily replicate.
That is ultimately what sustainable Amazon selling looks like — and these ten strategies are the architecture to get there.