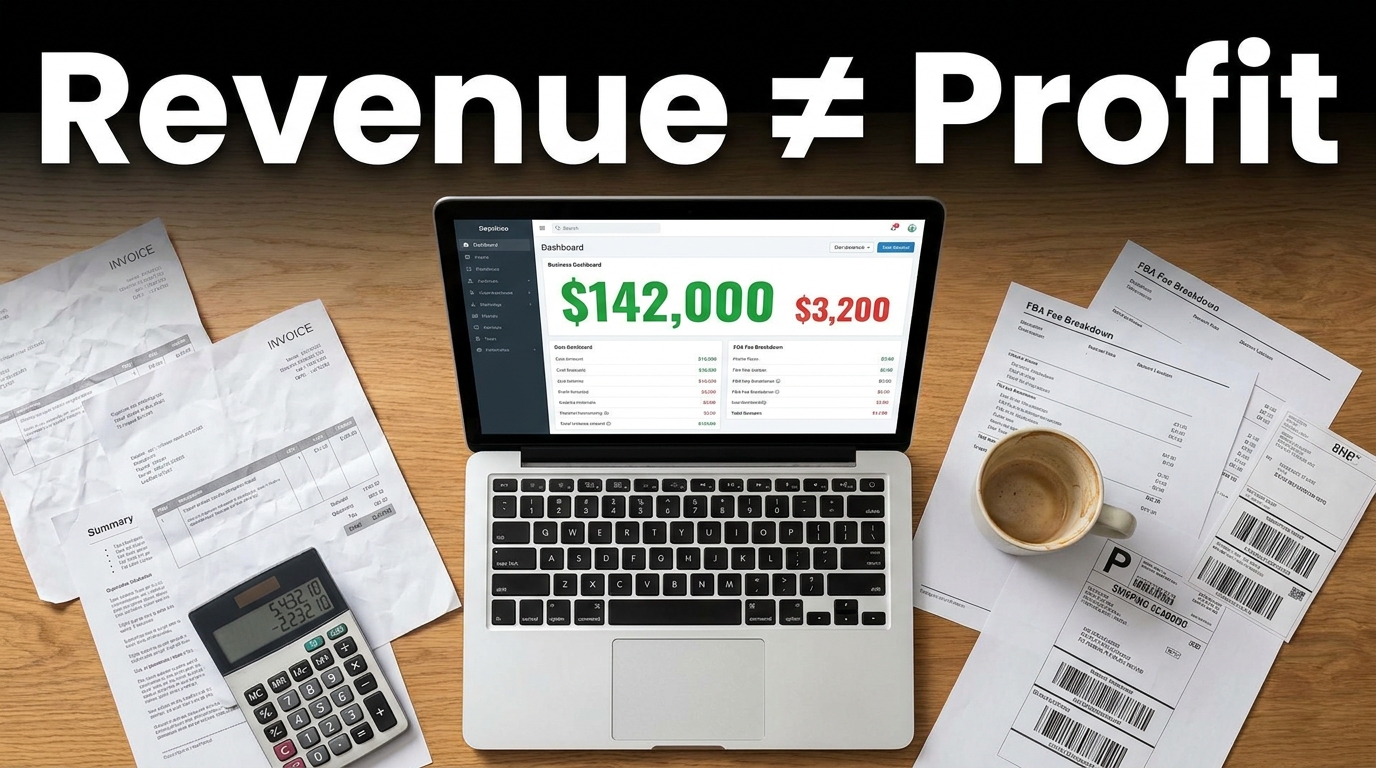

Ask most Amazon sellers how their business is performing and they’ll quote you a number — monthly revenue. Ask them what they’re actually making and the conversation gets noticeably quieter.
This isn’t a character flaw. It’s a structural problem baked into how the Amazon platform presents data. Seller Central puts your gross sales front and center. The fees, costs, and leaks that erode those sales are scattered across half a dozen reports, buried in invoices, and — in the case of some of the most damaging expenses — never explicitly surfaced at all.
The result is an industry-wide blind spot. Sellers celebrate crossing $100K, $500K, or $1M in revenue without fully reckoning with the fact that their actual take-home margin might be sitting at 8%, 12%, or — in some cases — net negative once every cost layer is properly accounted for.
A 2024 survey from Jungle Scout found that while over 65% of Amazon sellers reported being profitable, a significant portion of respondents admitted they had never calculated their true net margin on a per-unit basis — accounting for all fees, advertising spend, return rates, and overhead simultaneously. They were profitable on paper in the way that a restaurant owner is profitable if they forget to count their labor costs.
This article is a ground-level unit economics reality check for Amazon sellers at every stage. We’re not going to talk about algorithm tactics or image optimization. We’re going to talk about money — specifically, where it goes and how to know, before you place a single order, whether a product can actually make you any.
The Profit Illusion: Why Revenue Is the Wrong Number to Watch
Every Amazon seller starts with revenue because it’s the number that moves. It goes up when you run a promotion, when you win a keyword, when you launch a new product. It’s motivating. It feels like progress. And in certain conversations — with investors, with manufacturers, with partners — it’s a useful number to cite.
But revenue is a vanity metric without context. A business doing $800,000 in Amazon revenue with 6% net margins is making $48,000 a year. That same seller’s neighbor doing $200,000 at 28% net margin is taking home $56,000. The second seller has a healthier business with less capital tied up, lower operational complexity, and dramatically lower risk exposure to fee changes or algorithm shifts.
The Three Numbers That Actually Matter
When you’re evaluating Amazon product performance with any seriousness, you need three numbers — not one:
- Gross Margin: Revenue minus COGS (cost of goods sold, including manufacturing, freight, and prep). This tells you what you’re left with before Amazon takes its cut.
- Contribution Margin: Gross margin minus all Amazon fees (referral, fulfillment, storage) and advertising spend. This is the number that tells you whether a unit is cash-flow positive.
- Net Margin: Contribution margin minus all overhead — software tools, team costs, photography, returns, chargebacks, sample costs, account fees. This is what you actually keep.
The gap between gross margin and net margin is where most sellers’ optimism dies. Products that look great at the gross margin level — 60% margin! — can land at 14% net once the full cost structure is applied. For a $25 product, that’s $3.50 per unit. After you’ve shipped 500 units, paid for your first PPC campaign, absorbed a returns spike, and paid for quarterly storage, your actual check is a fraction of what the revenue dashboard implied.
The Revenue Trap in Action
Consider a common real-world scenario: a seller launches a kitchen gadget priced at $29.99. In month three, they’re doing $30,000 in monthly revenue — roughly 1,000 units sold. That sounds meaningful. But when you break it down:
- COGS (product + freight): $9.50 per unit
- Amazon referral fee (15%): $4.50
- FBA fulfillment fee: $3.86
- Monthly storage (prorated): $0.65
- PPC spend (blended ACoS 28%): $8,400 total = $8.40 per unit
- Returns at 9% rate: ~$2.40 per unit absorbed cost
Total cost per unit: $29.31. Net profit per unit: $0.68. Total monthly profit on $30,000 in revenue: approximately $680.
That’s not a typo. The seller is working full-time to manage a $30,000 revenue line that is generating $680 in profit — a 2.3% net margin. And that’s before they’ve accounted for the cost of tools, their time, or the next round of inventory they need to purchase to keep selling.
This is the profit illusion. And the only way out of it is building a complete unit economics model before you source a single unit.
The Full Cost Stack: Every Layer That Eats Your Margin
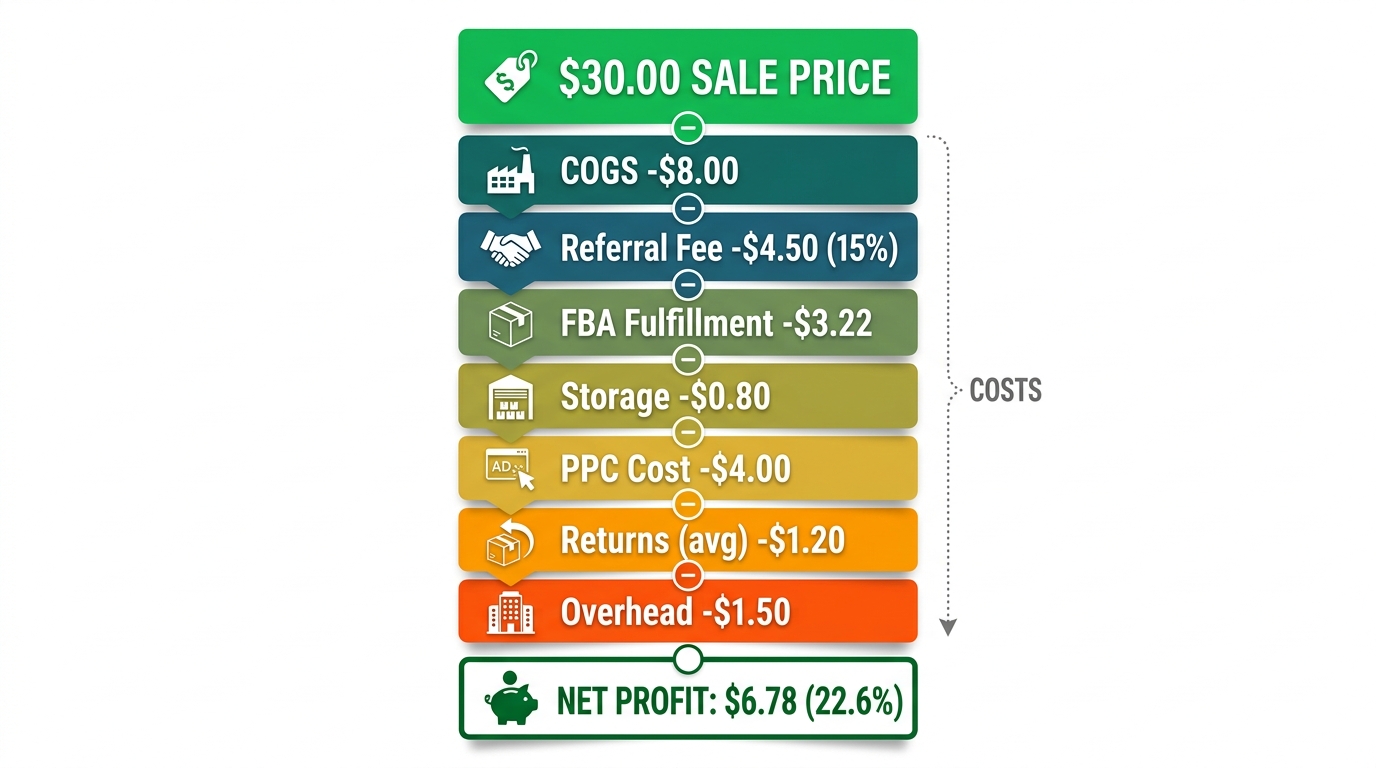
Amazon’s fee structure is not designed to be opaque — but it is genuinely complex, and complexity creates blind spots. There are roughly eight distinct cost categories that a serious Amazon unit economics model needs to account for. Miss any of them and your model is telling you a story, not the truth.
Layer 1: Cost of Goods Sold (COGS)
COGS is the starting point, but many sellers define it too narrowly. COGS is not just the factory price. A complete COGS calculation includes:
- Ex-works (EXW) manufacturing cost: What the factory charges per unit
- Export packaging: Inner boxes, master cartons, poly bags, labels
- Freight (ocean or air): Including origin charges, destination charges, and port fees
- Import duties and tariffs: Vary by HTS code and country of origin — and they changed significantly in 2026 under revised trade policy
- Customs brokerage fees: Often $100–$200 per shipment, easy to forget at small volumes
- Amazon FBA prep costs: If you’re using a 3PL prep center to apply labels, bubble wrap, or repack items before sending to Amazon
- Inspection costs: Third-party quality inspections in-country before shipment
A seller who sources a product for $6.00 EXW from a Chinese manufacturer might see a landed COGS of $9.50–$11.00 per unit once every element is included. That’s a 58–83% variance from their initial calculation — and it compounds across every other margin analysis they run.
Layer 2: Amazon Referral Fees
Referral fees are the most straightforward fee type, but they vary enough by category to matter significantly. The baseline for most categories is 15%, but the range runs from 5% (certain apparel items under $15) to 45% (Amazon Device Accessories).
Categories that often catch sellers off guard:
- Baby Products: 8% under $10.00, 15% above — if your product hovers near that threshold, even small price fluctuations change your math
- Jewelry: 20% on the first $250, stepping down to 5% above $1,000 — the tiered structure requires care in modeling
- Grocery & Gourmet: 8% under $15, 15% above — a common reason food sellers avoid the $15–$20 price point
- Clothing & Accessories: 17% — one of the higher general-merchandise rates, which is why apparel margins are notoriously tight on Amazon
The practical implication: your product category should be confirmed — not assumed — before you finalize your financial model. Listing a product in the wrong category doesn’t just affect discoverability; it can unexpectedly change your referral fee structure.
Layer 3: FBA Fulfillment Fees
Amazon’s FBA fulfillment fees are based on the dimensional weight and physical dimensions of your product. As of 2026, the fee tiers have continued to evolve, and sellers who haven’t revisited their calculations since 2023 are likely working from outdated numbers.
The key fee tiers for standard-size items (non-apparel) as a general framework:
- Small standard (under 4 oz): Approximately $3.06–$3.22
- Large standard (1–2 lb): Approximately $4.75–$5.48
- Large standard (2–3 lb): Approximately $5.87–$6.40
- Oversize items: Begin at $9.61 and escalate rapidly with weight
These base rates are then subject to holiday peak fulfillment surcharges — historically running from mid-October through mid-January — which have added $0.20–$1.50 per unit depending on size tier. If your product’s peak selling season overlaps with Q4, your fulfillment cost is higher during the exact period when you’re doing the most volume.
The most common seller mistake here is modeling fulfillment based on product weight alone, without accounting for dimensional weight. Amazon uses whichever is greater. A lightweight but bulky product — think a foam pool noodle or a camping pillow — will be charged at a dimensional weight that bears no resemblance to its actual weight on a scale. Sellers have discovered this gap for the first time when they see their first month’s FBA report.
Storage Fees: The Silent Margin Killer Most Sellers Underestimate
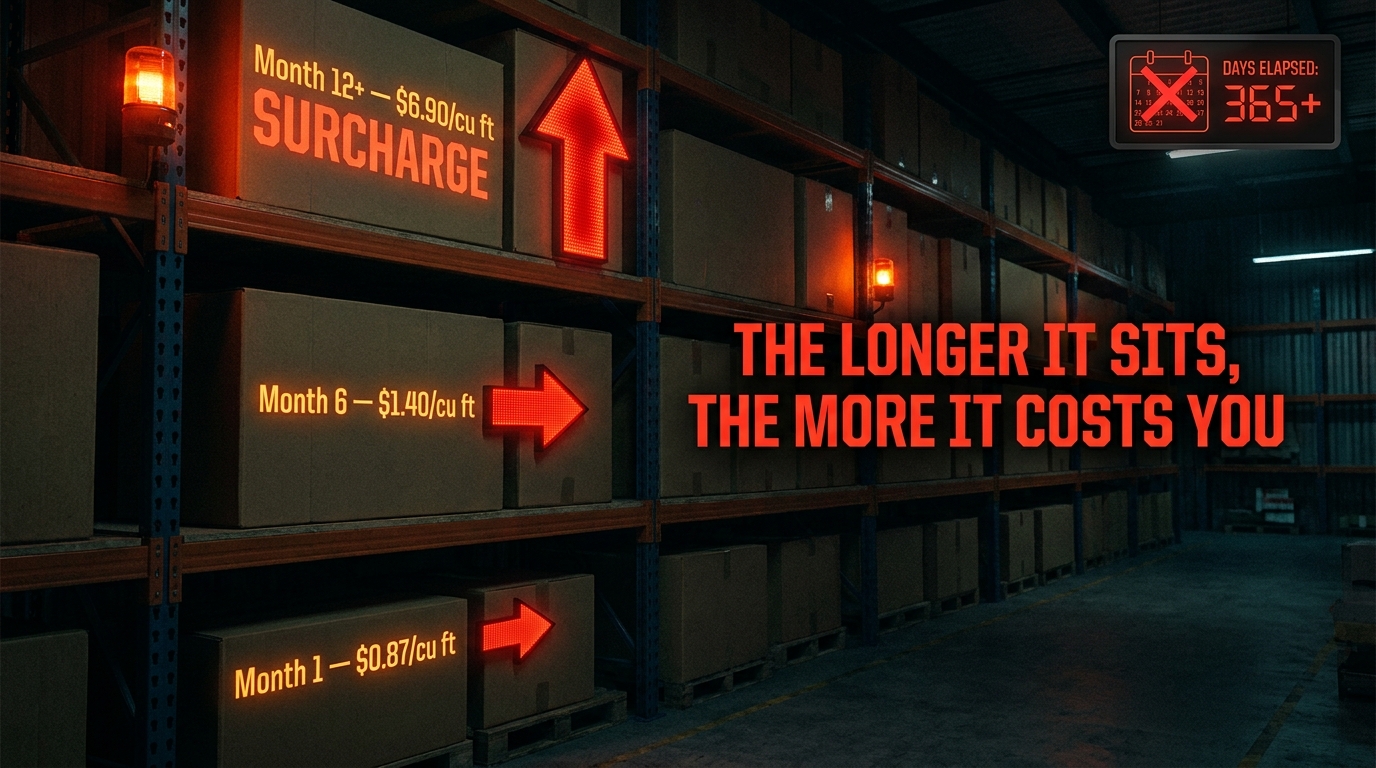
Storage fees are the cost that separates thoughtful inventory managers from sellers who are slowly bleeding out without realizing it. On a per-cubic-foot basis, monthly storage fees look manageable. Applied to overstocked, slow-moving inventory over months, they become catastrophic.
How Monthly Storage Fees Work
Amazon charges monthly storage fees based on the average daily cubic footage your inventory occupies across their fulfillment network. The current fee structure creates two distinct cost environments:
- January–September (off-peak): Approximately $0.87 per cubic foot for standard-size items
- October–December (peak season): Approximately $2.40 per cubic foot for standard-size items
For oversize items, those rates are lower per cubic foot but the total volume occupied is obviously much larger, so total charges can be substantial.
The Aged Inventory Surcharge
This is where storage fees turn genuinely dangerous. Amazon applies an aged inventory surcharge — formerly called the long-term storage fee — to items that have been sitting in fulfillment centers for extended periods. As of 2026:
- Items aged 181–270 days: Surcharge of approximately $1.50 per cubic foot per month on top of base storage
- Items aged 271–365 days: Surcharge of approximately $3.80 per cubic foot per month
- Items aged 365+ days: Surcharge of approximately $6.90 per cubic foot per month
Do the math on a product that has 200 units sitting unsold for a year. If those units occupy 20 cubic feet of fulfillment space, the aged inventory surcharge alone is running at $138 per month — on top of base storage. After 12 months of slow movement, the total storage charges can easily exceed the product’s entire COGS.
The Inventory Performance Index (IPI) Knock-On Effect
There’s a second-order consequence of poor inventory management that’s distinct from storage fees but closely related: your Inventory Performance Index score. Amazon uses IPI to measure how effectively you’re managing your FBA inventory. Sellers with IPI scores below Amazon’s threshold face restock limitations — meaning even if you want to send more of a winning product into FBA, you may be blocked from doing so because your overall account is weighed down by slow-moving items.
This creates a genuinely painful trap: your hero product can’t get restocked because your zombie SKUs are dragging your IPI below threshold. The storage fees are costing you money in two ways — directly, through the fees themselves, and indirectly, through constrained access to fulfillment capacity for the products that actually sell.
The Practical Fix
Inventory management at Amazon requires setting hard restock rules before items enter the network. For every product you send to FBA, you should define in advance:
- Your sell-through rate target (what % of inventory should sell within 90 days)
- Your removal trigger point (at what age will you request a removal order rather than pay aged inventory fees)
- Your stranded inventory audit cadence (weekly or bi-weekly review of non-buyable listings that are still incurring storage)
Removal orders cost approximately $0.97–$1.78 per standard-size unit. That’s real money, but it is almost always cheaper than continuing to pay compounding storage fees on unsellable inventory.
PPC Advertising: The Cost Most Sellers Are Measuring Wrong
Amazon PPC is not optional for most sellers. In 2026, organic rank and paid rank are intertwined tightly enough that attempting to compete in most categories without advertising is effectively choosing not to compete at all. But the way most sellers account for PPC in their unit economics model is structurally flawed — and that flaw distorts every business decision they make downstream.
The ACoS vs. TACoS Confusion
Most sellers monitor ACoS — Advertising Cost of Sale — which measures ad spend as a percentage of ad-attributed revenue. A 25% ACoS on a $30 product means you spent $7.50 in ads for every $30 sale that came through a sponsored placement.
But ACoS only accounts for sales that Amazon attributes to a click on your ad. It ignores the organic sales you’re also generating. The number that actually tells you the health of your overall advertising effort is TACoS — Total Advertising Cost of Sale — which divides your total ad spend by your total revenue (organic + paid).
A product with 25% ACoS but 60% organic sales rate might have a TACoS of just 10%. A product with 20% ACoS but 95% paid traffic dependency has a TACoS of 19%. The first product has a healthier advertising relationship with its business. The second is essentially a paid media play with thin organic support — and if CPCs rise in that category, the whole model can crack.
The Blended Rate Model
For unit economics purposes, the correct way to account for PPC is to calculate your blended ad cost per unit sold:
- Take your total monthly ad spend for a product
- Divide by total units sold (not just ad-attributed units)
- That number is your actual per-unit advertising cost
If you spent $4,000 in PPC for a product that sold 800 total units, your blended ad cost is $5.00 per unit — regardless of what your ACoS dashboard says. That $5.00 goes into your unit economics model alongside every other cost layer.
Launch vs. Mature Phase Accounting
One nuance that gets sellers into trouble: PPC economics during a product launch are structurally different from mature-phase economics, and confusing the two produces a distorted picture of product viability.
During launch, you’re bidding aggressively to acquire initial rank, reviews, and velocity signals. ACoS of 60%, 80%, or even 100%+ during this phase can be intentional — you’re buying market position, not maximizing short-term profit. But sellers who don’t explicitly define their launch window and transition criteria continue operating in “launch mode” economics indefinitely, treating high ACoS as normal rather than as a temporary investment.
The discipline is to set a clear transition milestone — typically at a defined review count threshold or BSR target — and then explicitly shift PPC strategy and profitability expectations. A product that can’t reach acceptable TACoS economics within 90–120 days of launch is telling you something important: either the market is too competitive for your current cost structure, or the product-market fit isn’t strong enough to support organic velocity growth.
Returns, Refunds, and the Math Nobody Talks About
Amazon’s customer-friendly returns policy is one of the primary reasons shoppers choose the platform over alternatives. For sellers, it is one of the most underestimated line items in the entire cost structure — and one of the most category-dependent variables in the model.
Category Return Rates: The Wide Range
Return rates on Amazon vary enormously by category. Sellers who benchmark their model against average return rates without knowing their category’s specific behavior are working from the wrong baseline. Industry data suggests approximate average return rates by major category:
- Clothing & Apparel: 20–30% — the highest category average, driven by fit and color discrepancy issues
- Electronics & Accessories: 10–15% — driven by “doesn’t work as expected” and compatibility issues
- Home & Kitchen: 8–12% — driven by size/dimension mismatches and quality perception gaps
- Beauty & Personal Care: 5–8% — generally lower because products are consumable and harder to return once opened
- Grocery & Gourmet: 3–6% — lowest general category return rate
These are illustrative ranges. The critical point is that your model needs to use a return rate assumption that reflects your actual category and product type — not a blended average.
The True Cost of a Return
This is where return economics get complicated. When a customer returns a product to Amazon, the costs to the seller include:
- Return shipping cost: Amazon often covers this for the customer, but it is borne by the seller through fee structures
- FBA return processing fee: Amazon charges a return processing fee for products in categories where free returns are offered
- Lost product value: Many returned items are not resellable as new. Amazon grades them as “used” or “damaged,” and sellers must either resell at a significant discount in Amazon Warehouse Deals (typically 30–50% of list price), or request removal and attempt resale through other channels
- Lost COGS: If the item is unsalvageable, you’ve absorbed the entire manufacturing and freight cost with zero revenue
A simplified return cost model: if 10% of units sold are returned, and 40% of returned units are non-resellable, then for every 100 units you sell, you’re effectively eating the full COGS on 4 units — plus return processing fees on 10. For a product with a $9.50 COGS, that’s $38 in lost COGS per 100 units, before processing fees. At scale, this becomes a very material number.
How to Pressure-Test Your Return Rate Assumption
Before launch, read your competitors’ 1- and 2-star reviews for products in your category. Catalog every complaint about product condition on arrival, size misrepresentation, and quality below expectation. These are your forward-looking signals for what your return rate will look like — and they tell you where your listing content needs to set clearer expectations to deflect preventable returns.
FBA vs. FBM: A Real Unit Economics Comparison
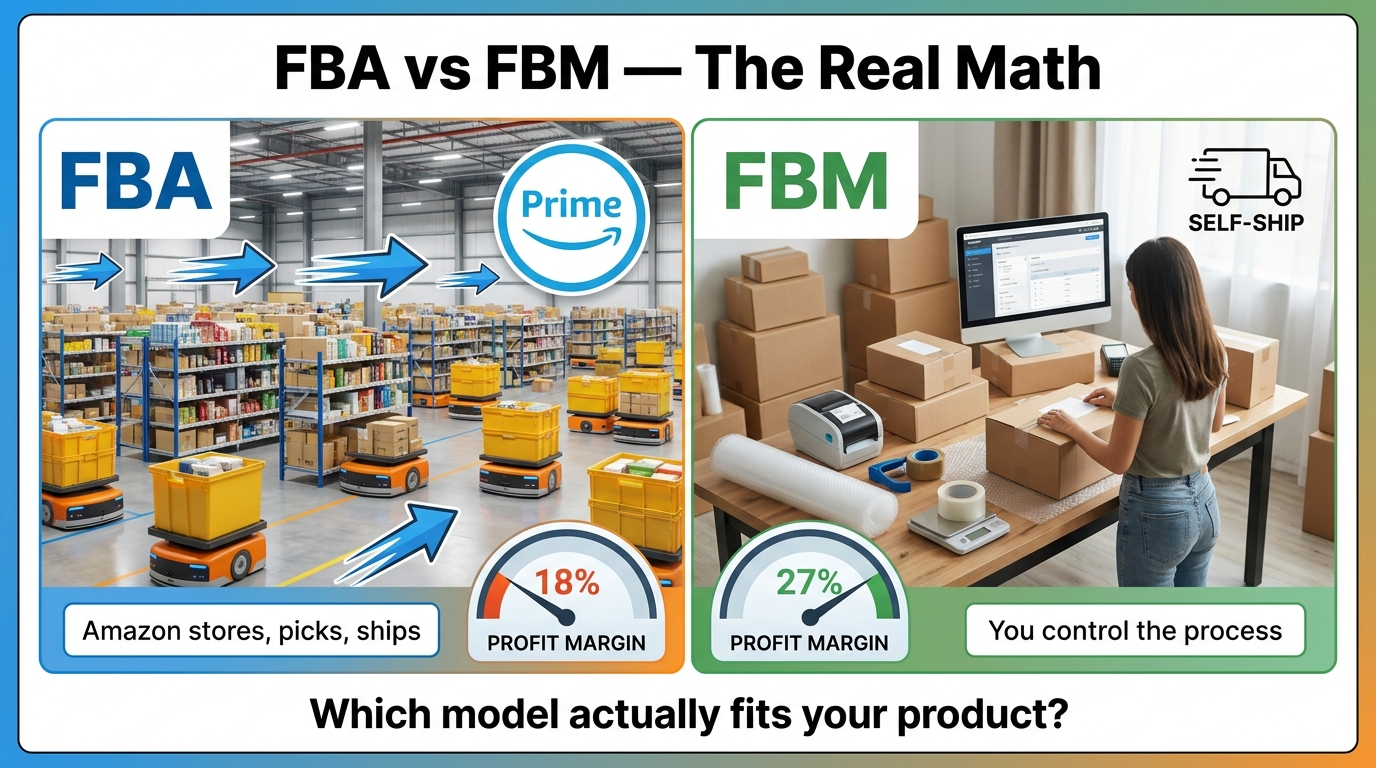
The FBA vs. FBM decision is framed almost exclusively around Prime eligibility and customer experience. Those are real factors. But the actual decision should be rooted in unit economics — and the answer is not universal. It depends on product characteristics, sales velocity, and your operational infrastructure.
When FBA Has the Edge
FBA’s structural advantage is twofold: the Prime badge drives conversion (Amazon data has historically suggested conversion rate uplift of 30–40% for Prime-eligible listings vs. non-Prime equivalents in comparable categories), and Amazon’s fulfillment network can ship faster and cheaper than most independent 3PLs at comparable volume levels.
FBA makes the most economic sense when:
- Your product is small, lightweight, and high-velocity — low cubic footage means low storage fees, and high turnover means you’re never paying aged inventory surcharges
- Your product is sold in a category where Prime eligibility is expected — if every competitor on page one has the Prime badge, converting without it is a significant structural disadvantage
- Your product requires no special handling or customization at point of fulfillment — FBA is a standardized system; items that need inserts, kitting, or special packaging add cost and complexity
- Your return handling preference is hands-off — FBA manages returns processing for you, which has real operational value even at a cost
When FBM Changes the Math
FBM — where the seller ships directly to the customer from their own warehouse or a 3PL — often looks worse on paper because you lose the Prime badge. But for specific product profiles, the economics can strongly favor FBM:
- Heavy or bulky items: FBA’s size-weight tiers can make fulfillment fees prohibitive for large products. A seller shipping a 10-pound item via FBA might pay $14–$18 in fulfillment fees alone. A 3PL or direct ship via UPS/FedEx can undercut that materially for heavy-but-not-dimensional goods
- Low-velocity, high-margin items: Products that sell slowly but carry high prices — specialty tools, niche professional equipment, certain collectibles — accumulate significant storage fees under FBA. FBM eliminates this entirely
- Products requiring custom kitting or inserts: If every order needs a handwritten note, a multi-SKU kit assembled to order, or any customization, FBA cannot accommodate it. FBM gives you control
- Sellers with existing 3PL relationships or warehouse capacity: If your marginal cost to fulfill an order through your existing infrastructure is $3.50 and FBA would charge $5.48, the FBM math is straightforward
Seller Fulfilled Prime: The Middle Path
Amazon’s Seller Fulfilled Prime (SFP) program allows qualifying sellers to display the Prime badge while fulfilling orders from their own warehouse — provided they meet Amazon’s stringent SFP requirements around shipping speed, cancellation rate, and delivery performance. SFP can be the right answer for sellers with the operational capacity to meet those standards and products whose economics favor non-FBA fulfillment. The qualification bar is high, and not maintaining SFP standards results in suspension from the program — but for sellers who can execute it, SFP captures the conversion benefit of Prime without surrendering control of fulfillment economics.
The Right Way to Model a Product Before You Launch
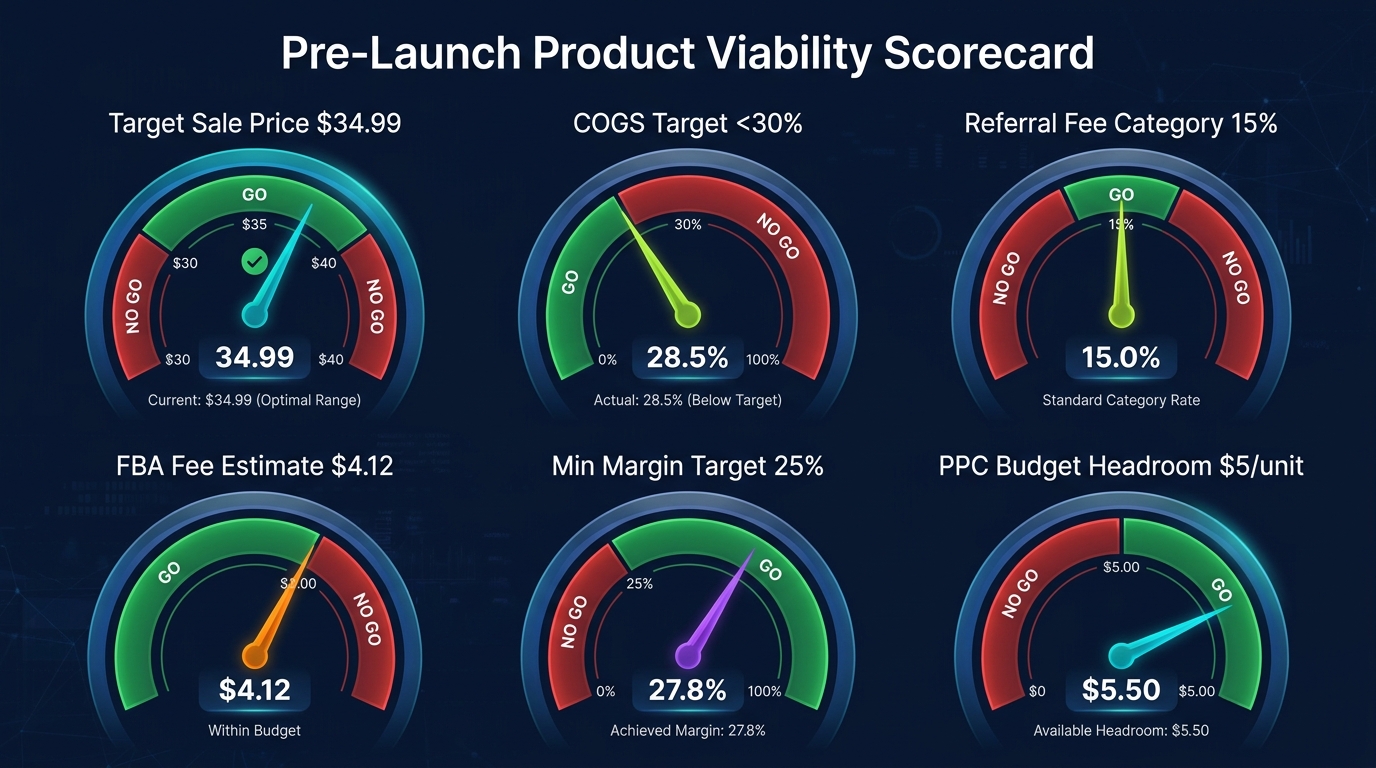
The single most valuable thing an Amazon seller can do — before sourcing, before photography, before a listing is written — is build a complete unit economics model at the target price point. Not an optimistic model. Not a best-case model. A model that uses realistic assumptions for every cost layer and tests the product’s viability against a minimum acceptable margin threshold.
Step 1: Define Your Price Point Range
Start with the market, not your cost structure. Research the top 10 selling products in your target subcategory. Note the price distribution: where is the volume concentrated? Where are there pricing gaps? What price point do the top-rated products cluster around?
Your target sale price should be determined by what the market will support, not reverse-engineered from your COGS. If the market clears at $24.99 and your model doesn’t work at $24.99, that’s critical information to know before you’ve placed a 500-unit order.
Step 2: Build the Full Cost Stack Bottom-Up
With your target price set, build your cost stack line by line:
- COGS (fully loaded): Manufacturing + packaging + freight + duties + prep. Get a real freight quote. Don’t estimate duties — look up your HTS code.
- Amazon referral fee: Look up your category’s exact percentage. Don’t assume 15%.
- FBA fulfillment fee: Measure your product and packaging. Look up the exact size tier. Use Amazon’s Revenue Calculator in Seller Central — it’s free and accurate.
- Storage fee (monthly): Estimate based on your projected restock cadence. If you’ll hold 60 days of inventory at Amazon, calculate 60 days × daily cubic footage × monthly rate.
- PPC assumption: Use a conservative TACoS assumption based on category competitiveness. For a competitive general-merchandise category, 15–22% TACoS is a realistic mature-phase assumption. For a highly competitive category, model 25%+.
- Return assumption: Use your category’s known return rate range. Apply the blended cost model described earlier.
- Overhead allocation: Divide your monthly fixed costs (tools, team, account fees, software subscriptions) by your total projected monthly units. That per-unit overhead number belongs in every product’s cost model.
Step 3: Set a Hard Minimum Margin Threshold
Before you run the model, decide on your minimum acceptable net margin. Most experienced Amazon sellers cite 20–25% net margin as the threshold below which a product doesn’t provide enough cushion against fee increases, competitive pricing pressure, or unexpected return spikes.
A product sitting at 15% net margin is one Amazon fee increase away from breaking even. A product at 28% net margin can absorb a significant fee change, a promotional period, or a returns spike and still remain profitable. The buffer isn’t just comfort — it’s operational resilience.
Step 4: Stress-Test the Model
After you’ve built your base case model, run three stress scenarios:
- Scenario A (Fee increase): What if FBA fulfillment fees increase by $0.50 and referral fees by 1%? Does the product still clear your minimum margin?
- Scenario B (Price compression): What if competition forces you to drop price by 10% within 12 months? What does your margin look like at $22.49 instead of $24.99?
- Scenario C (PPC inflation): What if CPCs in your category rise 30%, pushing your TACoS from 18% to 23%? Are you still above water?
Products that fail two or more stress scenarios are not viable businesses — they’re bets. You should know which one you’re making before you commit capital.
How Product Selection Decisions Create Margin Problems Downstream
Most margin problems on Amazon aren’t caused by poor execution. They’re caused by poor selection — products chosen based on opportunity signals (high BSR, lots of demand) without sufficient analysis of the fee and cost structure that determines whether that opportunity translates into actual profit.
The Category Margin Trap
Some Amazon categories are structurally low-margin environments, and no amount of operational excellence will change that reality. Electronics accessories with 15% referral fees and intense competition from brands with much larger ad budgets. Clothing categories with 17% referral fees and 25%+ return rates. Furniture with high dimensional weight pushing fulfillment fees into double digits per unit.
This doesn’t mean these categories are unsellable — but it does mean that a product in these categories needs to either carry a meaningfully higher price point or achieve a COGS structure dramatically below competition. Entering an electronics accessories category at a $19.99 price point with a standard Chinese manufacturer’s COGS is almost certainly a marginal or negative-margin proposition once the full cost stack is applied.
The Product Variation Tax
Sellers who launch products with multiple variations — sizes, colors, configurations — often underestimate the inventory management complexity this creates. Each variation is a separate inventory commitment. A 3-color, 2-size product requires stocking 6 distinct ASINs. If two of those variations consistently underperform, their inventory is generating storage fees while the winning variations run stockouts.
The unit economics of a variation must be modeled for each variant independently, with realistic velocity assumptions. An apparel seller who orders equal quantities of 8 sizes — assuming uniform demand — will almost always end up with overstock in extreme sizes and stockouts in medium ranges. The storage fees on the overstock and the lost sales on the stockouts both damage overall product profitability in ways that a top-level revenue view completely obscures.
The Accessory and Bundle Economics Opportunity
One underused lever in unit economics management is strategic bundling. Amazon allows sellers to create virtual bundles through the Brand Registry program, pairing complementary products into a single listing at a combined price. The economics of this approach can be compelling:
- Bundle price typically exceeds the sum of individual items (value perception premium)
- Referral fee is charged once on the bundle price, not separately on each item
- FBA fee is charged based on the combined package dimensions — often less than two separate fulfillment fees
- PPC cost per sale may be similar, but revenue per sale is higher, improving TACoS automatically
For a seller with complementary products already in their catalog, testing virtual bundles is a low-risk way to test whether bundled unit economics outperform standalone economics on the same SKUs.
Warning Signs Your Catalog Is Bleeding Cash Right Now
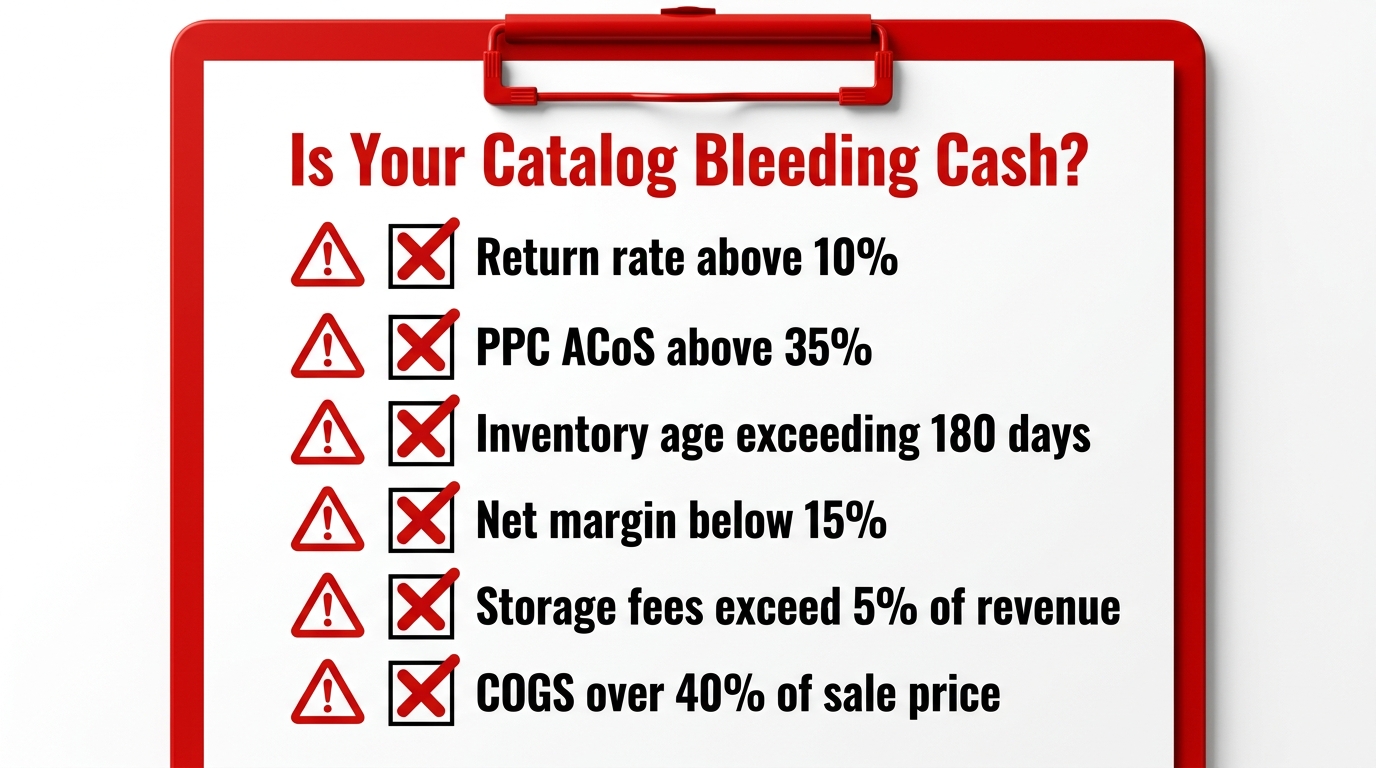
Even sellers who are generating real profit at the portfolio level often have individual products in their catalog that are quietly destroying value. The problem is that Seller Central’s standard reports don’t make this visible — you have to look for it deliberately.
Six Metrics That Flag a Cash-Bleeding Product
Run this diagnostic against every active product in your catalog quarterly:
- Return rate above 10% (non-apparel): Anything above 10% in a non-apparel category warrants immediate investigation. Pull the return reasons from Seller Central’s Return Analysis report. If “not as described” or “quality not as expected” dominate, the listing or the product has a problem that’s costing you money with every sale.
- TACoS above 30% at mature phase: A product that has been selling for 6+ months and still requires 30% of total revenue to be allocated to advertising is either in an unsustainably competitive position or has insufficient organic rank to justify continued investment. At 30% TACoS, you are spending a dollar and getting $3.33 in revenue — but after referral fees, COGS, and fulfillment, you’re likely at break-even or below.
- Inventory age exceeding 180 days: Pull your FBA Inventory Age report in Seller Central. Any ASIN with units older than 180 days is already in the surcharge tier and is burning money. If the units are still saleable, consider a deep promotional push to clear them. If they’re not moving even with discounting, calculate whether removal is cheaper than continued storage.
- Net margin below 15%: Using the full unit economics model described in this article, calculate each product’s true net margin. Any product below 15% deserves a deliberate strategic choice: can margin be improved through COGS reduction, price increase, or PPC efficiency? Or should the product be discontinued and the inventory capital reallocated?
- Contribution margin that turns negative in Q4: Some products look fine year-round but become loss-makers in Q4 when peak fulfillment surcharges kick in. If your product has thin enough margins that the $0.20–$1.50 seasonal surcharge tips it negative, you either need to adjust Q4 pricing proactively or consider FBM fulfillment during peak months.
- COGS creep without price adjustment: Raw material costs, freight rates, and import duties fluctuate. Sellers who haven’t renegotiated supplier pricing in 12+ months and haven’t audited freight costs since their last large shipment may be operating on a cost structure that’s materially higher than their original model assumed — without having raised prices to compensate.
Building the Habit: Quarterly Unit Economics Reviews
The sellers who consistently maintain healthy margins across large catalogs tend to share one operational habit: they review unit economics by product, not just by overall account revenue, on a regular cadence. Not monthly revenue reports. Not ACoS dashboards. Full unit economics models, per product, every quarter.
What a Quarterly Review Should Cover
A structured quarterly review doesn’t need to take days. For a catalog of 10–20 products, a disciplined seller can run through a complete unit economics audit in a few hours using a spreadsheet template built from the model described in this article. Each product review should answer five questions:
- What is this product’s current net margin, based on actual (not modeled) costs from the last 90 days?
- Has COGS changed since the last review? (Check supplier invoices, freight quotes, and duty rates.)
- What is the product’s current TACoS, and is it trending up, down, or stable?
- Are there any units in FBA older than 90 days? If so, what’s the plan?
- Has the competitive price range in this product’s category shifted materially? If yes, does the current price still sit at the right market position?
When to Kill a Product vs. Optimize It
The hardest decision in Amazon catalog management is not launching a new product — it’s deciding to stop selling an existing one. Sellers develop attachment to their SKUs. They remember the excitement of launch, the early sales velocity, the hope. Those memories can keep a cash-draining product alive long past when the economics argued for discontinuation.
A useful framework: if a product has been in your catalog for more than six months, has been the subject of active optimization efforts (listing improvement, PPC restructuring, pricing tests), and still cannot clear your minimum margin threshold — then continuing to invest in it is not persistence. It’s capital misallocation. The inventory capital, advertising budget, and management attention tied up in that product could all be redeployed to a product with better structural economics.
Killing a product is not failure. It is the discipline that allows a catalog to grow sustainably rather than accumulate dead weight.
The Broader Principle: Build the Model Before You Fall in Love With the Product
Amazon selling culture has a bias toward excitement about opportunity. A seller finds a keyword with 40,000 monthly searches and 400 competing products. They imagine the revenue. They find a manufacturer. They get a sample. They get excited. They launch.
The unit economics model is an afterthought — or it’s built in a way that confirms the decision already made, using optimistic assumptions that make the numbers work.
The reversal of this sequence is the single most impactful operational change most Amazon sellers could make. The model should come first. It should use conservative assumptions. It should identify the price, volume, and cost conditions under which the product clears your minimum margin — and it should tell you whether those conditions are realistic given current market dynamics.
If the model works, launch with confidence — because you’ve done the math. If the model doesn’t work, walk away while you still have your capital. The product idea isn’t the asset. The capital and time you save by not pursuing the wrong products are what actually compound into a durable business.
Practical Tools for Building Your Unit Economics Model
You don’t need expensive software to build a functional unit economics model. The tools available to all Amazon sellers — some free, some low-cost — are sufficient to produce a rigorous analysis:
- Amazon’s FBA Revenue Calculator (free): Available directly in Seller Central or at the Amazon Services page. Enter your product’s ASIN or manually input dimensions/weight to get an accurate FBA fee estimate at your target price point. This should be the first tool you open.
- Jungle Scout or Helium 10 product databases: Use these to gather real data on estimated monthly sales volume, BSR, price history, and review velocity for competing products. Treat velocity estimates as directional, not precise.
- A simple spreadsheet model: Build a unit economics template with rows for every cost layer described in this article. Lock the formulas. Every new product evaluation goes through the same model with the same methodology.
- Seller Central’s Business Reports: The Detail Page Sales and Traffic report gives you actual conversion rates, sessions, and ordered units for existing products. The Return Analysis report gives you actual return rates by reason. The Inventory Age report gives you real storage age data. These three reports alone contain most of what you need for a quarterly unit economics review.
- Your manufacturer’s freight forwarder or a quoted 3PL: Don’t model freight costs from memory or general estimates. Get actual quotes from your actual shipping partners before you model. Freight rates in 2026 remain volatile enough that a year-old estimate may be significantly off.
Conclusion: The Math Doesn’t Care About Your Revenue Screenshot
Amazon’s marketplace generates genuine wealth for tens of thousands of sellers every year. The platform’s scale, its customer trust, and its fulfillment infrastructure create real commercial leverage that is difficult to replicate through any other channel.
But that leverage is conditional. It depends on sellers understanding the actual economics of what they’re doing — not just the top-line number that looks good in a screenshot. The costs are real, they are specific, and they compound in ways that revenue-first thinking consistently underestimates.
The sellers who build lasting, scalable Amazon businesses tend to share a common foundation: they know their numbers. They know their COGS down to the duty line. They know their FBA fulfillment fee by size tier. They know their category’s return rate and they’ve modeled it honestly. They review their unit economics regularly, they make hard decisions about underperforming products, and they don’t launch a new product until the model clears their minimum threshold.
That discipline is not exciting. It doesn’t make for a compelling origin story or a viral social post. But it is the difference between Amazon revenue and Amazon income — and that distinction is what actually matters.
Key Takeaways:
- Revenue without a complete cost model is a vanity metric — always calculate contribution margin and net margin per unit.
- Your true COGS includes manufacturing, freight, duties, prep, and inspection — not just the factory price.
- Storage fees compound with age. Set hard removal triggers before inventory enters FBA.
- Measure PPC impact via TACoS (total ad spend ÷ total revenue), not ACoS alone.
- Model return rates by category and apply the true cost of a return — not just the refund amount.
- Build your unit economics model before sourcing. Stress-test it against fee increases, price compression, and PPC inflation before committing capital.
- Audit every product in your catalog quarterly. Products below minimum margin thresholds should be optimized or exited — not tolerated.