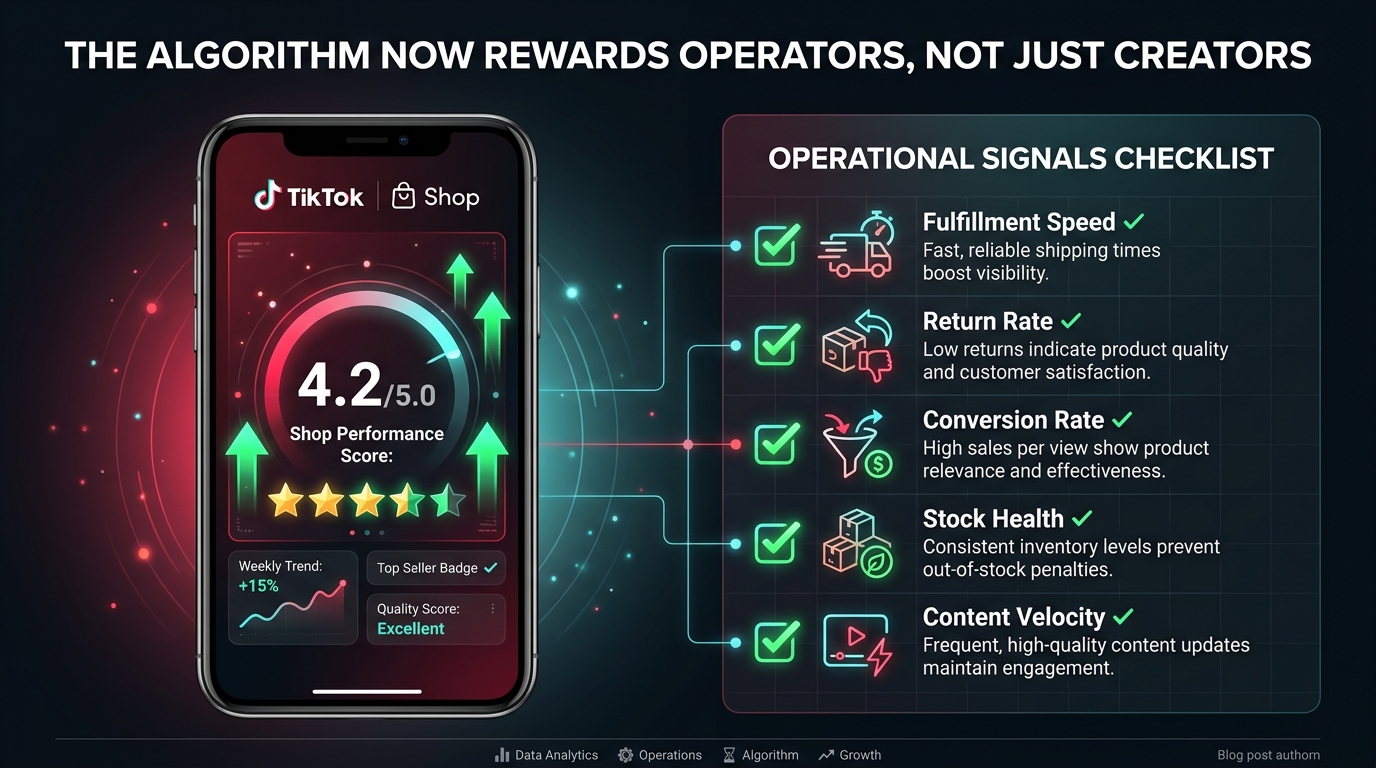

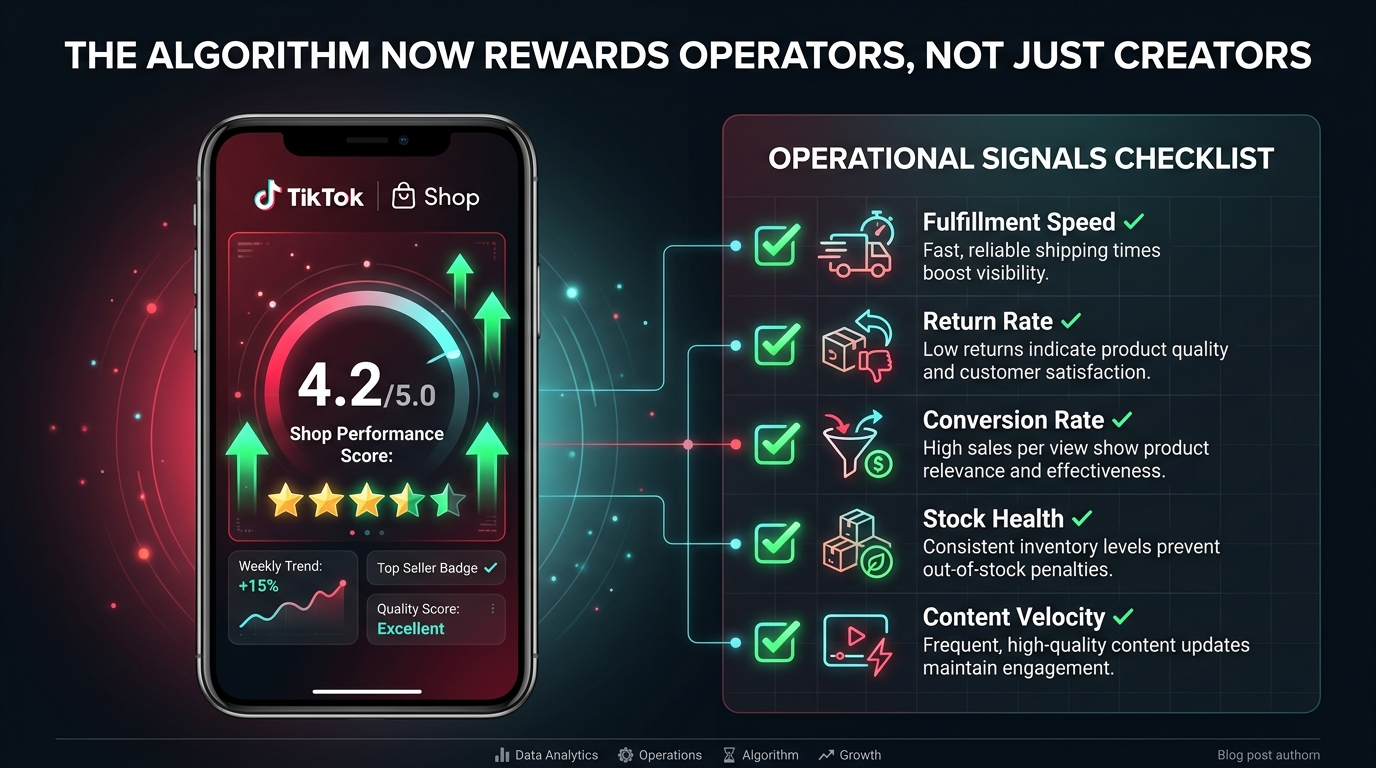
For a long time, TikTok Shop operated on a simple, intoxicating premise: go viral, and the sales follow. Post enough content, rack up enough views, and the platform’s recommendation engine would do the rest. That premise made early sellers rich, generated a wave of overnight brand stories, and convinced an entire generation of entrepreneurs that social commerce was just entertainment with a checkout button.
That era is over.
TikTok Shop’s global GMV crossed $64.3 billion in 2025 and is projected to reach $112 billion by the end of 2026. US GMV alone is tracking in the low-to-mid $20 billion range, up roughly 46% year-over-year. These are not the numbers of a scrappy, anything-goes experiment. They are the numbers of a maturing commerce platform that is increasingly behaving like one — demanding that sellers behave like operators rather than content creators.
The TikTok Shop algorithm has not simply updated its ranking signals. It has undergone a philosophical reclassification. Where the old system asked, “Is this content entertaining?” the new system asks, “Is this seller reliable, this product converting, and this fulfillment operation trustworthy?” The implications for every seller on the platform are profound — and most have not caught up.
This piece cuts through the noise. It covers the specific, measurable operational signals that TikTok’s algorithm uses to determine your visibility in 2026, explains the math behind product velocity amplification, exposes where sellers are quietly bleeding money on GMV Max automation, and maps out what a winning operational architecture actually looks like in practice. If you are optimizing your content calendar while ignoring your Shop Performance Score, you are working on the wrong part of the problem.
From “Go Viral” to “Run a Business”: The Core Philosophical Shift
The most important thing to understand about TikTok Shop’s 2026 algorithm is not any single ranking signal. It is the underlying logic that now unifies all of them. The platform has fundamentally reframed what it is rewarding.
In 2023 and 2024, TikTok Shop traffic was almost entirely driven by what the platform called “discovery commerce” — the phenomenon where a user opens the app for entertainment, stumbles across a product video or a live stream, and makes an impulse purchase. Engagement metrics like likes, comments, shares, and passive watch time were the engine. If your video was entertaining, you got distribution. If you got distribution, you got sales.
This created a gold rush dynamic. Sellers who understood content velocity — posting frequently, testing hooks obsessively, seeding enough creators — could ride the algorithm to explosive short-term GMV numbers. The system was forgiving about operational quality because it was primarily measuring content quality.
The Commerce Signal Inversion
What has changed in 2026 is a deliberate inversion of that signal hierarchy. TikTok’s internal data revealed what any experienced e-commerce operator would have predicted: content-first discovery generates sales spikes, but it does not generate sustainable, compounding commerce. High return rates, poor fulfillment experiences, and inconsistent product quality were eroding the post-purchase trust that makes customers buy again — and burning out the platform’s most valuable asset, its users’ willingness to purchase through the feed.
The response was a fundamental reweighting. According to multiple operator analyses and TikTok’s own Seller University documentation, the algorithm now treats product clicks, add-to-cart events, and completed purchases as stronger ranking signals than likes, shares, or raw view counts. A video that gets 500,000 views but drives no purchases is progressively deprioritized. A video that gets 50,000 views but drives 400 purchases gets amplified.
This is not a subtle change. It is a complete inversion of what “performing well” means on the platform.
What “Commerce-First” Means Operationally
The practical consequence is that TikTok Shop now evaluates sellers less like a content platform and more like an e-commerce marketplace. It is monitoring your dispatch speed, tracking your return rate, scoring your customer reviews, evaluating your listing quality, and factoring all of it into how widely your products are distributed. A seller with mediocre content but excellent operational metrics will now consistently outperform a seller with viral content but poor fulfillment.
That is the core shift. Everything that follows flows from it.
The Shop Performance Score — The Hidden Dial That Controls Your Visibility
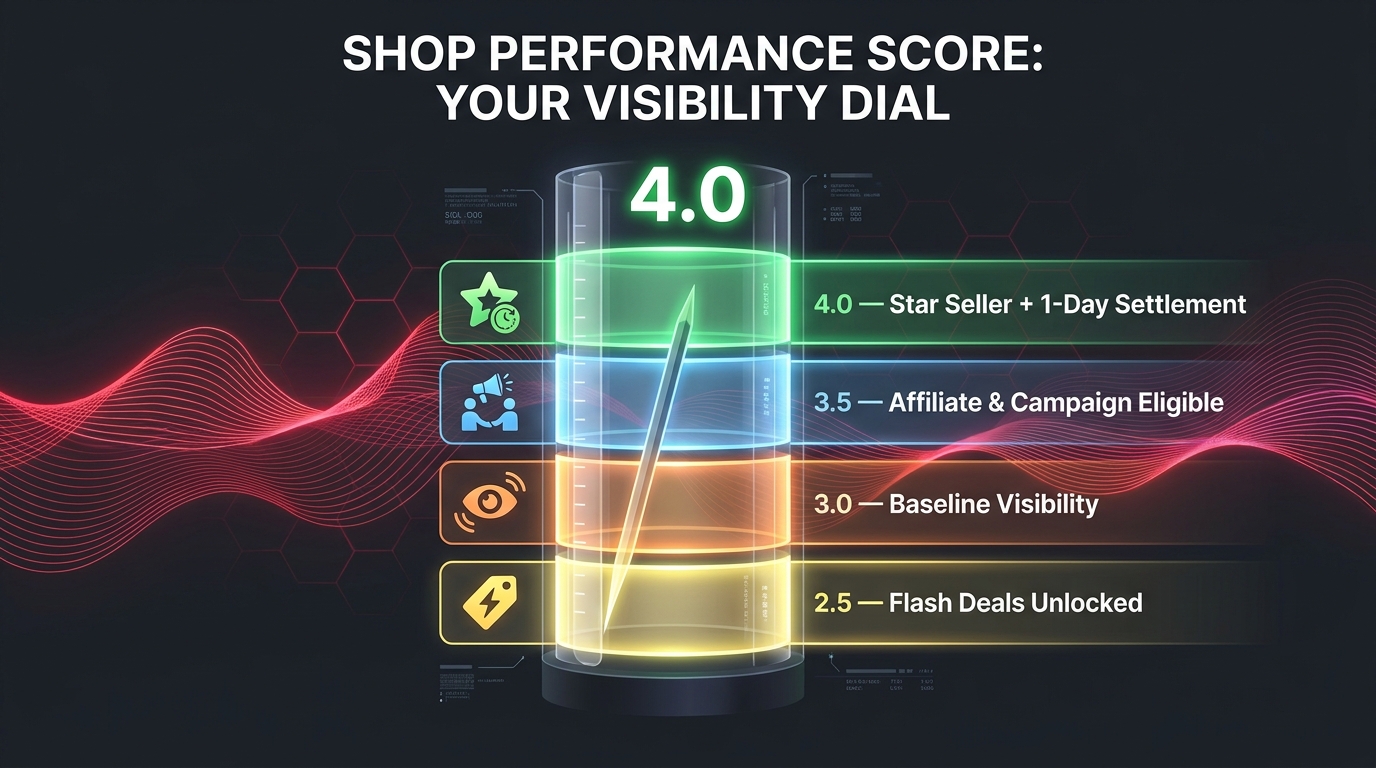
Most TikTok Shop sellers know their follower count, their video views, and their GMV. A surprisingly small number know their Shop Performance Score (SPS) — and fewer still understand that this single number is now one of the most powerful levers controlling their platform visibility.
The SPS is a 0–5 rating that TikTok Seller Center calculates on a rolling basis, roughly updated across a 28–60 day window. It is not a social media metric. It is an operational health score. And it gates access to almost every meaningful growth tool on the platform.
The Four Threshold Levels and What They Unlock
TikTok’s 2026 SPS framework operates on four distinct threshold bands, each of which unlocks — or restricts — specific seller capabilities:
- 2.5 SPS: Unlocks Flash Deals eligibility. Below this level, sellers cannot participate in any platform-wide promotional events.
- 3.0 SPS: This is the baseline visibility floor. Sellers who drop below 3.0 face direct throttling of their organic distribution. Listings become less visible in search results and the For You Page product recommendations. This is TikTok’s equivalent of a soft suspension — you remain on the platform, but the algorithm quietly stops showing your products.
- 3.5 SPS: Unlocks affiliate program eligibility and access to most TikTok Shop campaign features. This is the critical threshold for any seller whose strategy depends on creator partnerships, because below it, you cannot be featured in affiliate-driven content flows.
- 4.0 SPS: Unlocks one-day payment settlement and Star Seller designation. At this level, the algorithm actively favors your products in competitive category placements and recommendation surfaces.
The implications here are significant. If your SPS sits at 2.8, you are not just missing out on Flash Deals — you are algorithmically invisible at one of the platform’s most competitive shopping surfaces. Your content might still generate views, but the product recommendation layer that converts those views into purchases is quietly working against you.
What Actually Moves the SPS
The SPS aggregates several input metrics, with different weights depending on category. The most impactful factors in 2026 are:
- Customer review score: Your average rating and review volume, with recent reviews weighted more heavily than older ones.
- Pre-fulfillment cancellation rate: Orders cancelled before dispatch, whether by you or the customer due to stock issues.
- After-sales complaint rate: Disputes, “item not as described” claims, and return requests initiated by buyers.
- Late dispatch rate: Percentage of orders not shipped within the required window.
- Listing quality signals: Completeness of product descriptions, image quality scoring, and policy compliance.
Critically, the SPS uses category-relative benchmarking, not platform-wide averages. A 4% return rate in beauty might be excellent; the same rate in electronics might be below the category average and drag your score down. Sellers who manage their SPS without understanding their category benchmarks are flying blind.
The New Account Health Rating (AHR)
Running parallel to the SPS is a newer system called the Account Health Rating (AHR), which TikTok has been rolling out to replace the old violation points framework. Where the SPS measures operational quality, the AHR measures compliance — listing accuracy, policy violations, intellectual property issues, and prohibited product listings. Both scores now feed into the algorithm’s assessment of your seller trustworthiness. A seller can have a healthy SPS but a damaged AHR and still face visibility restrictions on specific product categories.
Managing both systems simultaneously is now a baseline competency for serious TikTok Shop operators.
Fulfillment as a Ranking Signal — Not Just Customer Service
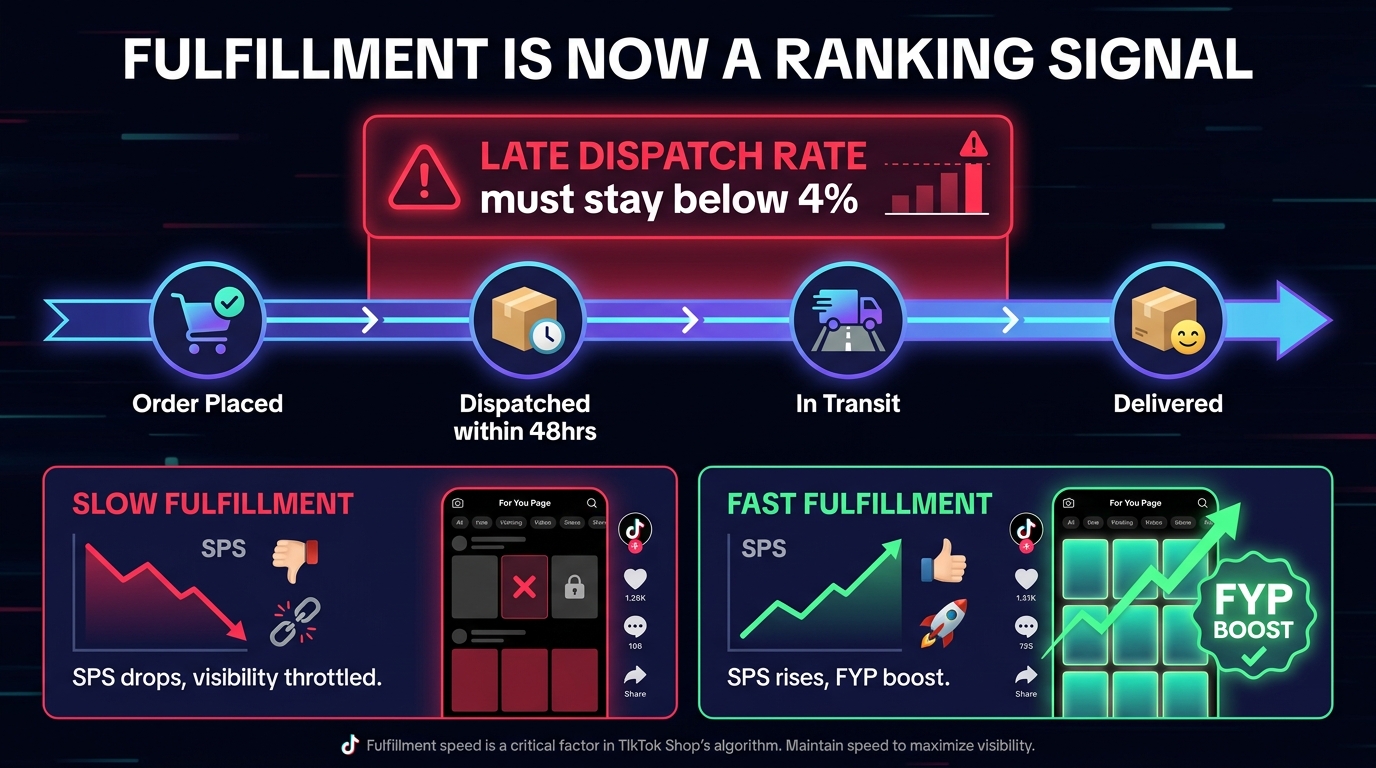
Here is a framing that most TikTok Shop content has not addressed directly: your warehouse operations are now a search ranking input. This is not a metaphor. TikTok’s algorithm reads your fulfillment data and uses it to decide how widely to distribute your products in both recommendation feeds and search results.
This creates a category of seller failure that has nothing to do with content quality. A brand can produce technically excellent videos, work with high-performing creators, and run well-structured GMV Max campaigns — and still watch its visibility decline because its 3PL partner is dispatching orders two days late.
The Specific Metrics That Matter
TikTok tracks fulfillment health through several measurable signals, each with specific thresholds that affect your SPS and, by extension, your algorithmic distribution:
- Late Dispatch Rate (LDR): The percentage of orders not dispatched within the seller’s declared handling time. For most categories, a late dispatch rate above 4% begins to negatively impact SPS calculations. Above 8%, the impact becomes severe enough to trigger visibility throttling and potential campaign eligibility restrictions.
- Pre-fulfillment Cancellation Rate (PFCR): Cancellations that occur because inventory is not available. This metric is particularly punishing because it signals stockout risk to the algorithm — a direct conflict with TikTok’s core commerce promise of reliable product availability.
- Return and Refund Rate by Category: Returns are a two-sided signal. A moderate return rate in certain categories (fashion, footwear) is expected and has less weight. Elevated return rates in categories where they should be low (consumables, electronics) disproportionately damage the SPS.
- After-Sales Resolution Speed: How quickly you respond to and resolve customer complaints. Slow resolution times compound the damage of any individual complaint by extending the negative signal window.
The Stockout Algorithm Trap
One of the most damaging — and least discussed — operational errors in TikTok Shop is experiencing a stockout at the moment when a product is gaining algorithmic momentum. Here is why this is so costly: when the algorithm identifies a product with rising sales velocity, it begins a process of progressive distribution expansion, pushing the product to wider and wider audience segments. A stockout during this window forces the algorithm to stop distribution. When inventory is restored, the product does not resume from where it left off — it is treated as a new, lower-momentum product and must rebuild its signal from scratch.
Experienced operators describe this as being “reset by the algorithm” — and it can cost weeks of momentum that took significant content investment to build. The operational fix is proactive inventory planning specifically aligned to the algorithm’s amplification windows, not reactive restocking after sellouts.
TikTok Fulfilled Network (TFN) as a Signal Advantage
Sellers who use TikTok’s own fulfillment infrastructure — the TikTok Fulfilled Network — benefit from a structural advantage in fulfillment signal quality. Because TFN logistics are under TikTok’s direct control, the platform has complete data visibility into dispatch times, which are almost never late by definition. This creates a fulfillment signal baseline that third-party logistics providers often cannot match consistently. For high-velocity products, the trade-off between the economics of TFN versus your own 3PL increasingly needs to factor in this algorithmic dividend.
The Conversion Rate Trap — What “Good” Actually Means Now
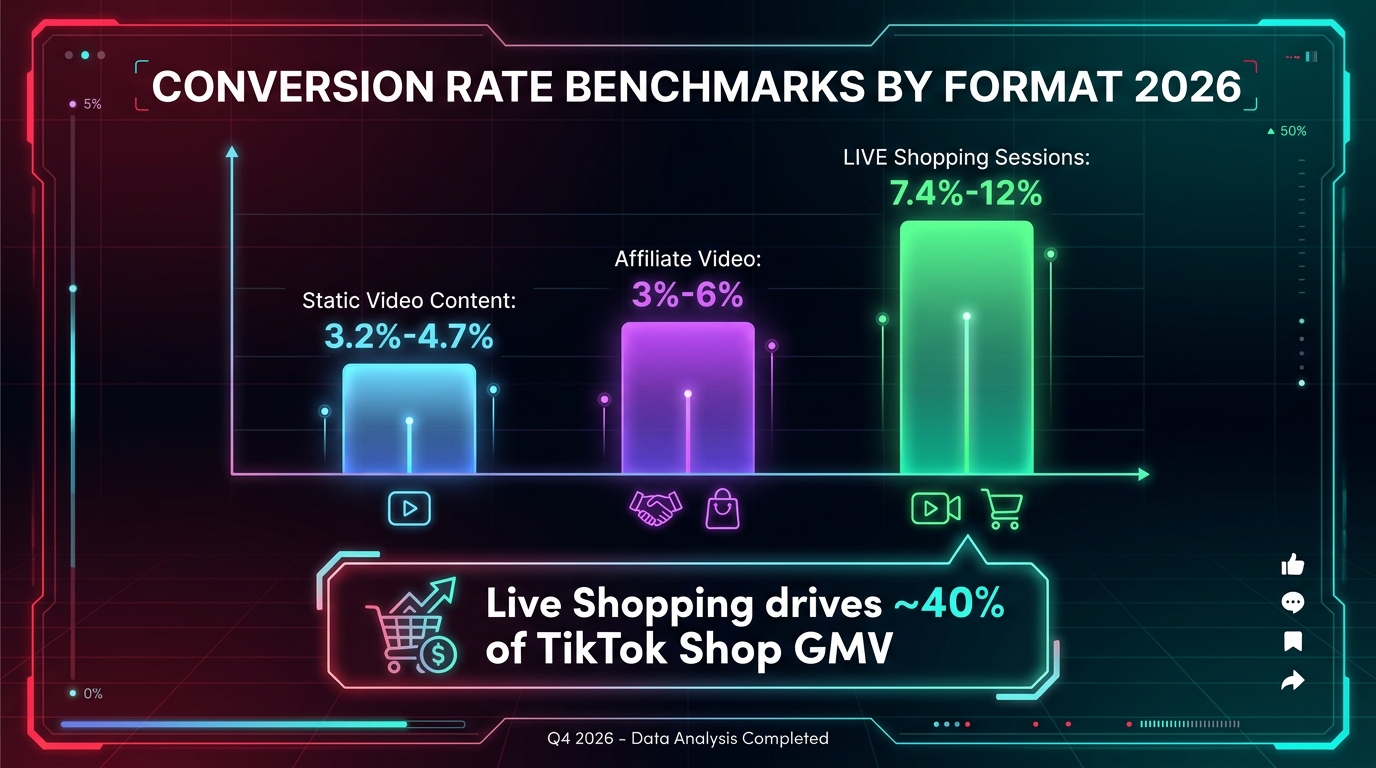
Conversion rate is one of the most misread metrics in TikTok Shop strategy discussions. Sellers frequently benchmark their conversion rates against platform-wide averages without accounting for the massive variance across traffic sources and formats. This leads to a very specific kind of strategic error: optimizing for the wrong number.
Here is the 2026 conversion rate landscape as it actually exists, based on aggregated operator data and platform-level reporting:
- Static shoppable video content: 3.2%–4.7% average conversion rate across most categories
- Affiliate creator video content: 3%–6%, with significant variance based on creator-product fit and audience overlap
- LIVE shopping sessions: 7.4%–12%, with top-performing live sellers occasionally hitting 15%+ in high-intent categories
Live shopping is not just a format preference. It is producing conversion rates that are 2–3x higher than video-only content, and it now accounts for approximately 40% of TikTok Shop’s total GMV. A seller whose strategy is entirely built around short-form video content is structurally operating at half the conversion efficiency of their live-selling competitors.
Why the Algorithm Amplifies High-Conversion Content
The algorithm’s response to conversion rate is not linear. Products and content that achieve conversion rates above their category average receive disproportionate distribution boosts — because high conversion is a direct signal that the algorithm is successfully matching products to purchase-intent users. This creates a positive feedback loop: high conversion attracts more distribution, which attracts more high-intent viewers, which maintains or improves conversion, which attracts more distribution.
Conversely, content that generates high view counts but low conversion sends a negative signal: the algorithm is distributing this content widely but generating no commerce value. Over time, this content is progressively deprioritized in product recommendation surfaces — even if it continues to get engagement on the entertainment feed.
The Listing-Level Conversion Bottleneck
One of the most common but least visible conversion killers is the product listing page itself. Many sellers invest heavily in content that successfully drives clicks but have listing pages that fail to close the purchase. Key issues include:
- Primary image quality: Low-resolution, poorly lit, or non-contextual product images significantly reduce add-to-cart rates from product pages
- Price anchoring: Lack of clear comparison pricing or value framing on the listing page increases price resistance
- Review recency: Listings with mostly older reviews perform worse than those with recent review velocity, because buyers interpret older reviews as evidence that the product is no longer actively sold
- Incomplete specifications: Missing size charts, material details, or compatibility information creates purchase hesitation — particularly in fashion and electronics
The algorithm reads listing quality directly (as part of the SPS calculation) and indirectly (through the bounce rate and add-to-cart data it collects from listing page visits). A high-traffic, low-converting listing page will eventually see reduced distribution — not because the content is poor, but because the destination is underperforming.
Setting a Conversion Rate Target That Actually Makes Sense
The right way to set conversion rate targets is by format and category, not by platform average. A beauty brand running live sessions should be targeting 8%+ and concerned if they fall below 7%. The same brand running purely video-based affiliate content should target 4%+ and investigate if they are consistently below 3%. Applying a single platform benchmark to both formats simultaneously produces an incoherent optimization strategy.
Product Velocity Math: How the Algorithm Decides to Amplify You
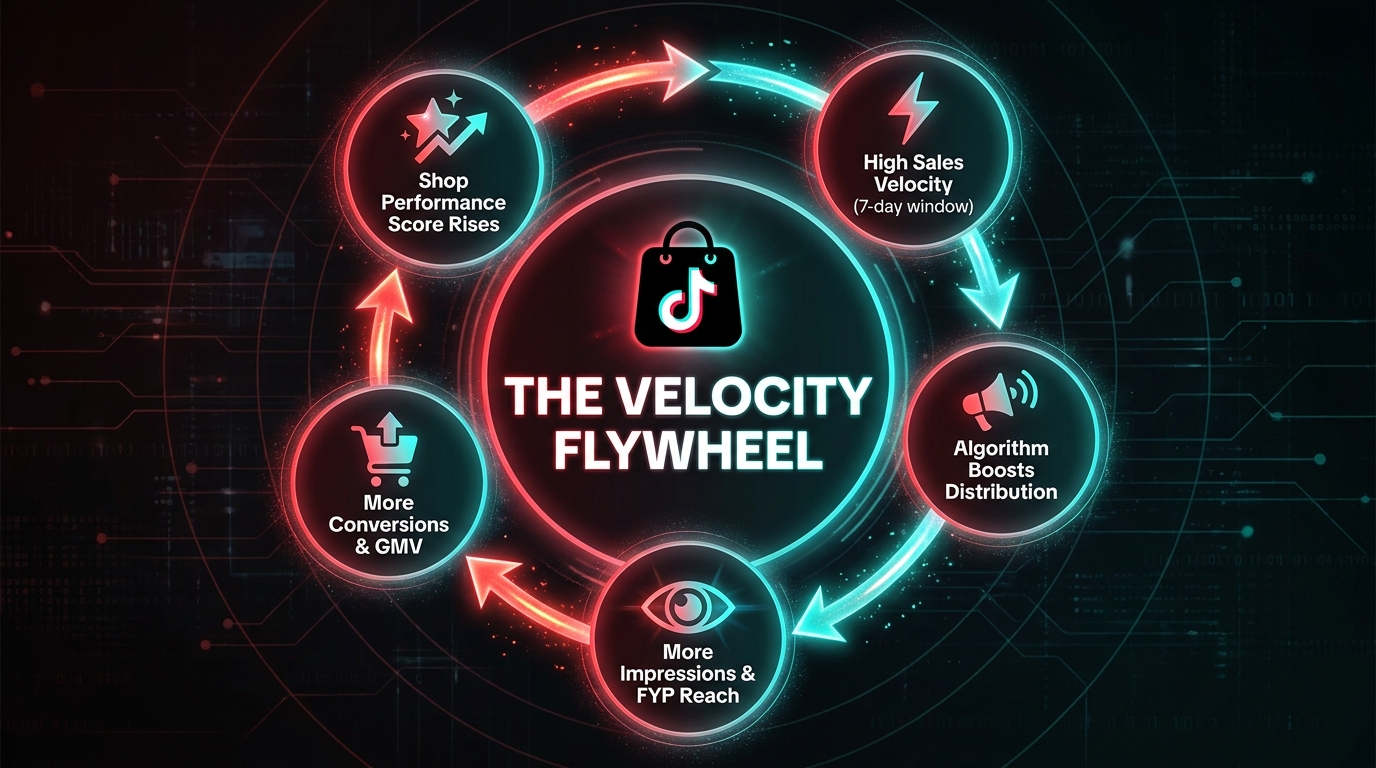
If there is one concept that separates sophisticated TikTok Shop operators from everyone else, it is a practical understanding of product velocity — specifically, how TikTok’s algorithm measures it and what it does with the measurement.
Velocity, in the algorithm’s terms, is not total sales volume. It is the rate of acceleration of sales within rolling time windows, primarily 7-day and 30-day periods. A product that sold 500 units total last month matters less to the algorithm than a product that has sold 200 units in the last 7 days on an upward trajectory. TikTok’s system is designed to identify products that are gaining momentum and amplify that momentum — because amplifying rising products generates better commerce outcomes than amplifying static ones.
The Velocity Signal Loop
The algorithm’s velocity assessment operates as a compounding loop with five distinct stages:
- Initial signal detection: The algorithm identifies products with above-average click-through rates from early distribution. High CTR signals purchase intent from the audience that has seen it.
- Conversion confirmation: Products where click-through converts to purchases at above-category-average rates are flagged for expanded distribution. The system is confirming that intent is translating to action.
- Velocity window expansion: Products with strong 7-day velocity receive expanded placement — more prominent positions in search results, more product recommendation slots in the FYP, and higher priority in live stream product showcase queues.
- Momentum amplification: Expanded placement drives more sales, which increases the 7-day velocity reading further, which triggers another round of distribution expansion.
- SPS dividend: Rising sales velocity improves the SPS through increased review volume and positive seller metrics, which feeds back into broader campaign eligibility and additional distribution surfaces.
This loop explains why some products appear to “explode” on TikTok Shop seemingly overnight, while others with similar quality stagnate. The explosive products hit all five stages in rapid sequence. The stagnating ones break the loop at stage two — typically because their conversion rate on the initial distribution is insufficient to confirm the momentum signal.
How to Manually Seed Velocity
Understanding the velocity loop reveals a counter-intuitive strategic insight: the most valuable thing you can do for a new product launch on TikTok Shop is not to produce the best possible video. It is to generate concentrated early purchase signals in a short window. Several operational approaches accomplish this:
- Coordinated launch day promotions: A limited-time discount on launch day concentrates purchase activity into a narrow time window, generating the 7-day velocity spike that triggers initial algorithm amplification
- Affiliate seeding before organic push: Activating 10–20 micro-creators to publish simultaneously (rather than staggered over weeks) creates a compressed burst of product clicks and purchases that the algorithm reads as a velocity event
- LIVE session launch strategy: Launching a product in a live session rather than through video content generates immediate purchase signals in real-time, which the algorithm processes faster than asynchronous video engagement
- GMV Max early seeding: Running a small-budget GMV Max campaign in the first 48–72 hours of a product launch provides an initial purchase signal from paid traffic that the algorithm uses to calibrate its organic amplification targeting
The Diminishing Returns Window
Velocity is not a permanent advantage. The algorithm’s amplification is calibrated to detect momentum and extend it — not to reward historical performance indefinitely. Products that reach a velocity peak and then plateau face a progressive reduction in amplification as the momentum signal weakens. This is why top TikTok Shop operators plan regular “re-ignition” campaigns for hero products — structured content events or promotion windows designed to regenerate velocity signals for products that have reached plateau.
GMV Max and the Automation Layer — Where Sellers Are Quietly Bleeding Money
GMV Max became the mandatory, automated default campaign type for TikTok Shop Ads in mid-2025. By 2026, it is the primary — and in many contexts, the only — available format for running paid commerce campaigns on the platform. It is also, based on operator reports and agency analyses, one of the most misused tools in the TikTok Shop ecosystem.
GMV Max works by automating targeting, bidding, and ad delivery to maximize the total GMV it can generate from your campaign budget. It uses TikTok’s machine learning to identify users most likely to purchase, dynamically allocates spend across creative assets, and optimizes in real-time without manual adjustments. In theory, this should produce better results than manual campaign management. In practice, seller errors in setup and management are systematically undermining the tool’s effectiveness.
The Learning Phase Problem
GMV Max campaigns require a learning phase — a window during which the system is collecting enough purchase data to calibrate its targeting model. This phase typically requires 50 conversions within the first 7 days to exit learning and enter optimized delivery. The most common and costly seller error is intervening during the learning phase: editing the campaign, adjusting the budget, or pausing and restarting the campaign before it has collected sufficient data.
Every intervention resets the learning phase clock. Sellers who intervene multiple times in the first week are essentially paying for data collection repeatedly while never allowing the system to move into optimized delivery. The result is chronically underperforming campaigns with high CPAs that appear to confirm that TikTok ads “don’t work” — when the actual problem is seller behavior disrupting the learning mechanism.
The ROI Target Calibration Error
GMV Max allows sellers to set a target ROAS (Return on Ad Spend) that the system optimizes toward. The second most common critical error is setting this target too aggressively too early. Sellers who set a 5x or 6x ROAS target from campaign launch are essentially instructing the algorithm to find only ultra-high-converting audiences — and those audiences are narrow. The campaign delivers very low volume at high efficiency, generates insufficient conversion data to support scale, and plateaus quickly.
The correct approach, recommended consistently by operators who have scaled GMV Max successfully, is to launch with a realistic, category-benchmarked ROAS target (often 2x–3x for established categories) and scale the target incrementally — typically 20% increases after each performance plateau — rather than setting ambitious targets upfront.
The Creative Volume Requirement
GMV Max’s automation layer requires creative variety to function effectively. The system tests multiple creative assets simultaneously and allocates spend toward the best performers — but this dynamic optimization only works with sufficient creative inventory. Campaigns running on a single video asset or two creative variations exhaust their optimization surface quickly and cannot adapt to audience fatigue as the campaign matures.
Effective GMV Max campaigns in 2026 are running 5–10 creative variations minimum at campaign launch, including different hooks, lengths, visual approaches, and calls to action. The system’s ability to find winning creative combinations is the primary source of performance improvement over time. Starving it of creative inputs defeats its core advantage.
Attribution Blind Spots
TikTok’s 2026 official guidance has shifted to emphasizing total channel ROI rather than direct attribution within GMV Max — meaning the platform now explicitly acknowledges that GMV Max campaigns drive organic, affiliate, and direct sales that do not appear in campaign attribution windows. Sellers who evaluate GMV Max purely on its reported in-platform ROAS are systematically undervaluing its contribution. The correct measurement framework combines GMV Max reported data with Seller Center total GMV trends during campaign periods, not just campaign-attributed conversion data.
The Search-FYP Balance: Rebuilding Your Traffic Architecture
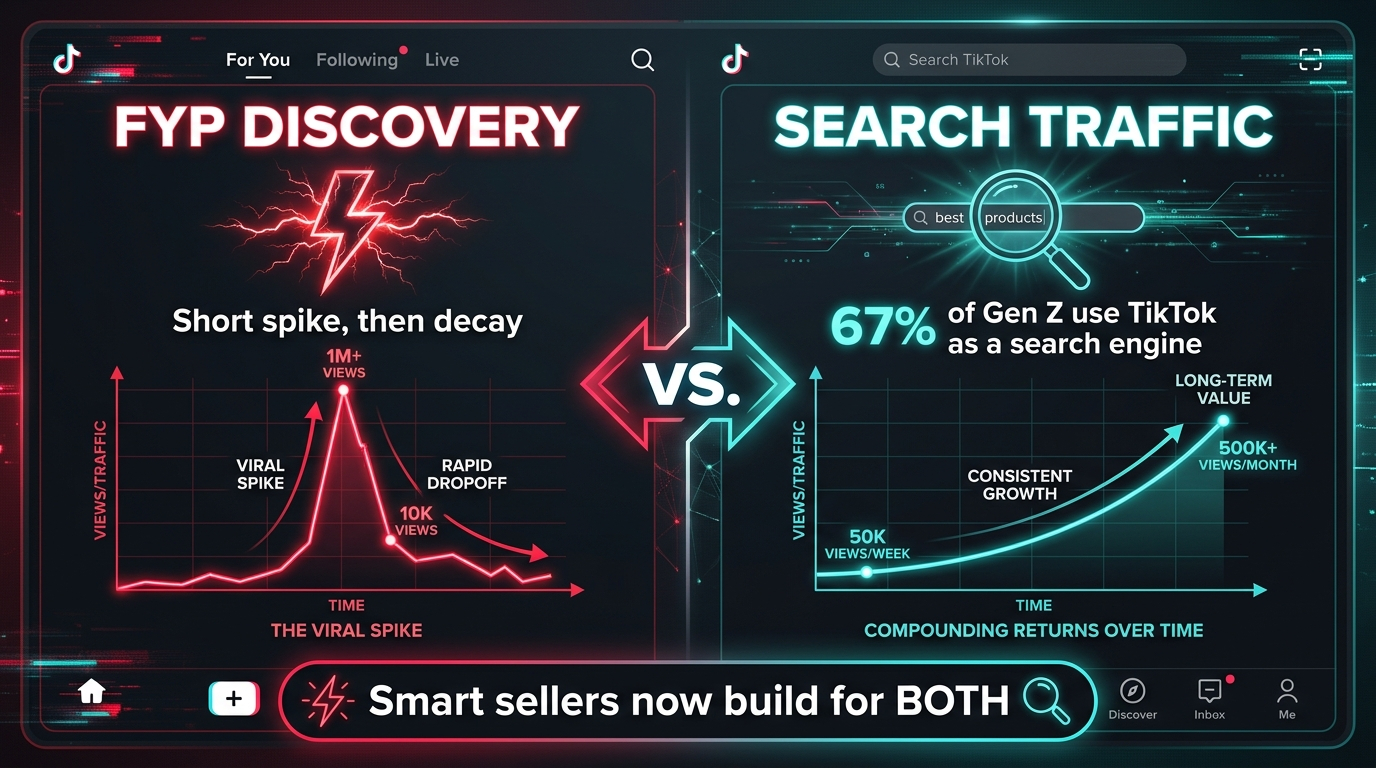
TikTok search has crossed a threshold that most sellers have not fully internalized: 67% of Gen Z now use TikTok as a primary search engine — up from 51% just two years ago — and TikTok search query volume has grown 174% year-over-year. These are not metrics that suggest search is an emerging supplement to FYP-driven discovery. They are metrics that indicate search is becoming a parallel primary channel that operates on fundamentally different principles.
The FYP and search function as two distinct traffic architectures that require different content strategies, different optimization approaches, and different performance expectations.
FYP Traffic: The Spike-and-Decay Pattern
FYP-driven discovery is what most TikTok Shop sellers have built their entire strategy around. A piece of content gets algorithmic momentum, is distributed widely, generates a burst of purchases, and then decays as the content ages. The decay is not a failure — it is structurally inherent to how the FYP works. The FYP rewards novelty and recency. Every piece of content has a shelf life, typically measured in days to weeks, after which its distribution decays regardless of its original performance.
This architecture creates a specific operational demand: constant new content input to maintain a steady flow of FYP-driven traffic. Sellers who stop producing content do not simply pause their FYP traffic — they experience a rapid decline in distribution as their content pool ages out of the algorithm’s active consideration.
Search Traffic: The Compounding Architecture
Search traffic operates on the opposite principle. Content that is properly optimized for TikTok search — with relevant keywords in titles, captions, and spoken audio — continues to receive search-driven traffic indefinitely, as long as the search query remains relevant. This is compounding traffic: a piece of search-optimized content published six months ago can still generate product page visits and purchases today, with zero ongoing investment in content production.
For TikTok Shop sellers, search-optimized content is not just an SEO play. It is a working capital efficiency play. Every piece of search-optimized content that continues generating traffic reduces the marginal cost of customer acquisition over time. FYP-only strategies require constant reinvestment in content production to maintain traffic volume. Search-balanced strategies build a passive traffic asset that reduces this dependency.
Building a Dual-Architecture Content Strategy
The most sophisticated TikTok Shop operators in 2026 are explicitly building for both channels simultaneously, with different content types assigned to each function:
- FYP content: Short, hook-driven, trend-responsive videos designed for impulse discovery. Optimized for watch time, completion rate, and immediate conversion. High production cadence, short shelf life, measured by 7-day GMV contribution.
- Search content: Longer, information-rich videos that answer specific product questions — tutorials, comparisons, “how to use,” and ingredient/specification breakdowns. Optimized for search query relevance and listing page click-through. Lower production cadence, long shelf life, measured by 90-day GMV contribution.
- Evergreen hybrid content: Product demonstrations that address common buyer questions while incorporating strong hooks for FYP virality potential. The goal is content that performs on both channels — FYP spike plus search longevity.
Separating your content strategy by channel function is not just an optimization tactic. It changes how you allocate production resources, how you measure content ROI, and how you think about content as a business asset rather than a performance expense.
Category Winners and Losers — What the Data Actually Says
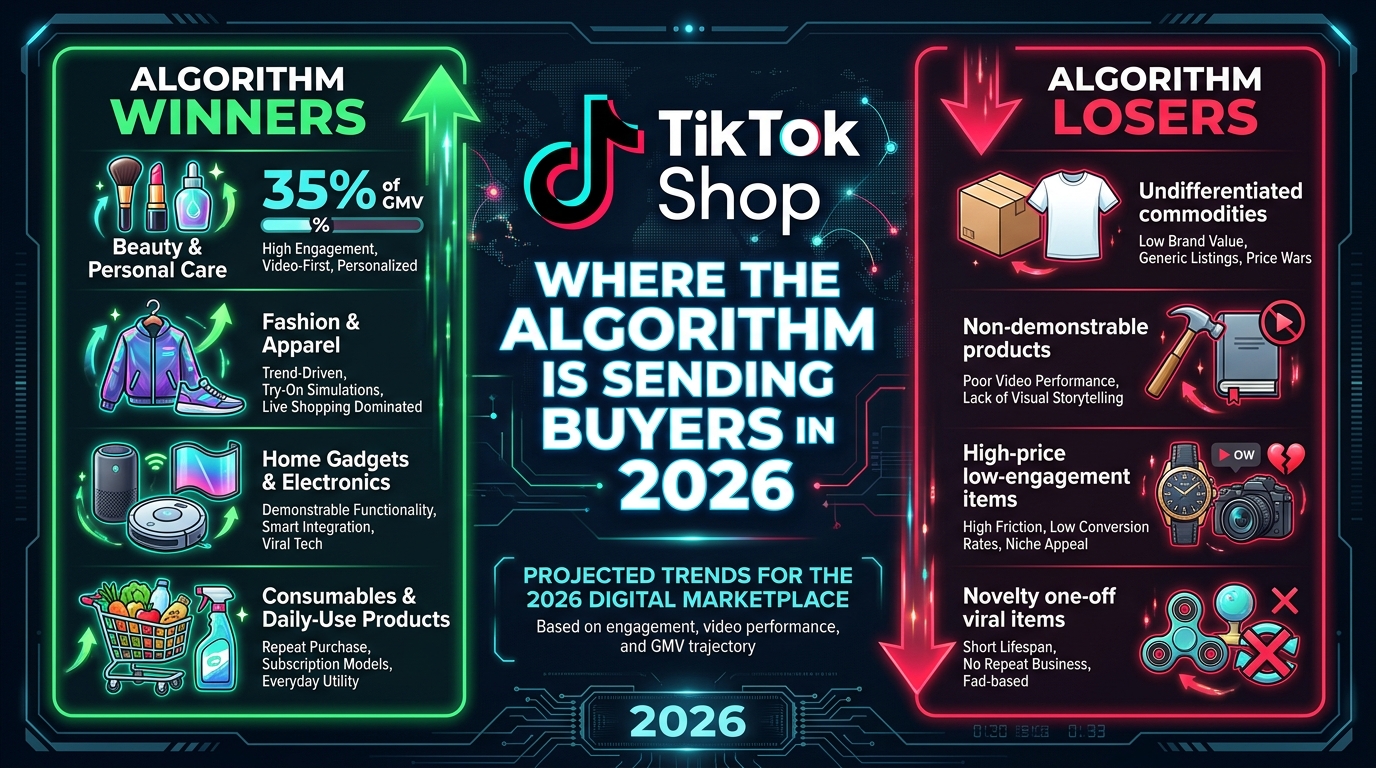
Not all categories experience the algorithm’s commerce-first shift equally. The 2026 data reveals a clear pattern of winners and losers that tracks a specific product attribute: demonstrability. Products that can be shown working — that have a visible transformation, a clear before/after, or a satisfying process — generate higher watch time, more organic shares, stronger conversion signals, and better algorithm performance. Products that cannot demonstrate their value visually are structurally disadvantaged in TikTok’s commerce ecosystem.
The Current Category Leaders
Beauty and Personal Care remains the dominant category, accounting for approximately 35% of TikTok Shop’s total GMV, with year-over-year growth of around 52%. The category’s advantage is the transformation narrative — before/after demonstrations, application tutorials, and ingredient education all create the kind of watch-time-extending content that the algorithm rewards. Price points in the $15–$45 range generate the impulse purchase threshold where the FYP-to-purchase conversion is most efficient.
Fashion and Apparel is the second major category, with strong performance in the $20–$80 range. Try-on content, styling videos, and outfit-building demonstrations align naturally with TikTok’s highest-retention content formats. The category’s challenge is the return rate — fashion has structurally higher returns than most categories — which requires careful SPS management to avoid score degradation from return volume.
Home Gadgets and Electronics Accessories is the fastest-growing category in 2026, with electronics and accessories growing significantly faster than platform-average GMV. Demonstration content for novel household gadgets — kitchen tools, cleaning devices, organizational products — generates extremely high completion rates because the product functionality is inherently watchable. This category has become one of the most competitive on the platform as sellers recognize the algorithmic advantage.
Consumables and Daily-Use Products — supplements, personal care consumables, cleaning products, and food items — benefit from the algorithm’s implicit preference for repeat-purchase products. Consumables drive subscription-like repurchase behavior that generates sustained velocity signals, not just launch spikes. The algorithm, which measures 30-day velocity, rewards this repurchase pattern with sustained distribution.
The Categories That Are Struggling
Undifferentiated commodities — products that look identical to dozens of other listings with no unique visual hook, brand story, or demonstrable advantage — face severe algorithmic disadvantage. With no content differentiation and thin margins that limit affiliate commission viability, these products generate poor click-through rates that suppress their distribution from the initial distribution phase.
High-price, low-engagement items — products over $150 that require research-intensive purchase decisions — struggle with TikTok’s impulse commerce infrastructure. The platform’s purchase flow is optimized for quick decisions. High-consideration products generate high browse behavior but low conversion, which the algorithm reads as a negative signal even when the audience interest is genuine.
Non-demonstrable products — items whose value cannot be shown in a 30–60 second video — lack the content foundation that drives TikTok’s commerce loop. If you cannot make a compelling product video, you cannot generate the watch-time and conversion signals that the algorithm requires for distribution amplification.
Building an Affiliate Infrastructure That Survives Algorithm Shifts
TikTok Shop’s affiliate ecosystem has undergone a structural change that mirrors the platform-wide shift from entertainment to commerce signals. In 2024, affiliate creator selection was largely driven by reach metrics — follower count, average view count, and audience demographic overlap. In 2026, the algorithm has effectively reorganized the affiliate hierarchy around commerce performance: creators who consistently drive purchases outrank creators who consistently drive views, regardless of their relative audience sizes.
This is a significant reconfiguration for brands that built their affiliate programs around reach-first creator selection criteria. The follower count a creator has is increasingly irrelevant compared to their conversion rate on similar products.
The Micro-Creator Advantage
The 2026 affiliate data consistently points toward a conclusion that many brands are still reluctant to fully operationalize: micro-creators (10,000–100,000 followers) with high product-audience alignment convert at higher rates than macro-creators with large but diffuse audiences. This is not surprising from an e-commerce perspective — a creator whose entire audience consists of skincare enthusiasts will convert a skincare product at a higher rate than a lifestyle creator whose audience spans multiple interest categories. But operationally, most brands still concentrate their affiliate budgets on a small number of high-follower creators because the economics are easier to manage.
The brands that are winning on TikTok Shop affiliate in 2026 have inverted this model. They are running wide affiliate seeding programs — recruiting 50–200 micro-creators simultaneously, providing standardized product seeding and content briefs, and then identifying the top performers by conversion data (not view data) for deeper investment. The wide-funnel approach accepts that most creators will underperform, specifically to identify the handful that convert at exceptional rates.
Creator Health Signals and the Algorithm Connection
The Creator Health Rating (CHR) — the creator-side equivalent of the seller’s AHR — now directly affects how the algorithm distributes affiliate content. Creators with strong CHR scores (high completion rates on their videos, positive audience commerce behavior, low complaint rates) have their affiliated product content distributed more widely in recommendation surfaces. A brand partnering with a creator who has a poor CHR score is not just accepting a less effective creator — it is accepting algorithmically suppressed distribution of all the content that creator produces for them.
Vetting creators for CHR health is not currently intuitive in TikTok’s interface, but sophisticated operators are building affiliate partner management processes that include CHR assessment alongside traditional engagement rate metrics.
Open vs. Targeted Collaboration Strategy
TikTok Shop’s affiliate system offers two collaboration modes: Open Collaboration (any creator can apply to promote your products) and Targeted Collaboration (you invite specific creators directly). Most brands default to Open Collaboration because it requires less management overhead. This is the wrong default for brands at meaningful scale.
Open Collaboration generates high application volume but low creator quality consistency. Targeted Collaboration allows brands to build curated creator rosters based on verified performance data. The most effective approach combines both: Open Collaboration as a discovery mechanism to identify high-performing creators organically, followed by Targeted Collaboration invitations to lock those performers into ongoing partnerships with higher commission structures and exclusive product access.
The Operational Flywheel — How to Stack All These Signals
Each of the signals discussed in this piece — SPS, fulfillment health, conversion rate, product velocity, GMV Max calibration, search-FYP balance, affiliate quality — functions as an individual optimization lever. But the sellers who are achieving sustained, compounding growth on TikTok Shop in 2026 are not optimizing these signals independently. They are stacking them into a self-reinforcing operational loop where each signal improvement feeds the next.
Understanding how these signals compound is what separates a collection of tactics from a coherent operational strategy.
The Flywheel Sequence
The most effective operational flywheel starts with product selection and runs through five interconnected stages:
Stage 1 — Product-market fit validation: Before investing in content or affiliate infrastructure, operationally excellent sellers validate that a product can achieve above-average conversion rates on the platform. This means testing the listing with a small paid GMV Max campaign before organic content investment, using the conversion data to confirm or reject the product’s commerce viability. Products that do not convert above category average in testing are not launched at scale.
Stage 2 — Fulfillment infrastructure alignment: Products that pass conversion testing are set up with fulfillment infrastructure specifically designed to maintain dispatch SLAs at scale — not just under low-volume launch conditions. This means pre-positioning inventory, establishing dispatch protocols, and confirming 3PL partner capacity before content and affiliate programs drive volume.
Stage 3 — Velocity seeding: Products with confirmed conversion rates and operational fulfillment backing are launched with concentrated velocity seeding — coordinated affiliate activation, launch day promotions, and an initial LIVE session — to generate the 7-day velocity spike that triggers algorithmic amplification. The goal at this stage is not maximum GMV. It is maximum velocity signal strength in the shortest possible window.
Stage 4 — SPS protection during scale: As algorithmic amplification drives volume growth, the operational focus shifts to protecting the SPS from the stress of rapid scaling. This means monitoring return rates, dispatch performance, and complaint rates in real-time during volume spikes, and having pre-established escalation protocols for fulfillment issues before they damage the SPS below critical thresholds.
Stage 5 — Reinvestment and re-ignition: Products that have been through a full velocity cycle — launch spike, plateau, decay — are candidates for structured re-ignition campaigns: fresh creative batches, new affiliate cohort seeding, promotional windows, or format shifts (adding LIVE selling to a previously video-only product). The goal is to regenerate the velocity signal before the product’s SPS contribution decays from reduced review volume and purchase activity.
Where Most Sellers Break the Flywheel
The flywheel breaks at different points for different seller archetypes. Content-native sellers (creators who built TikTok audiences before opening a shop) typically excel at Stages 1 and 3 but break at Stage 2 and Stage 4 — their fulfillment infrastructure was never designed for commerce scale, and rapid volume growth damages their SPS faster than they can respond. Brand-led sellers typically excel at Stage 2 but break at Stage 3 — they have the operational infrastructure but lack the affiliate relationships and content agility to generate concentrated velocity signals.
The sellers who consistently win are those who recognize their flywheel break point and build specifically to address it, rather than doubling down on the stages they are already good at.
The Operational Imperative: What Needs to Change Right Now
TikTok Shop’s algorithmic maturation is not a threat to sellers who are operationally serious. It is a consolidation event that is separating the sellers who happened to benefit from the platform’s wild early growth from the sellers who have built sustainable commerce operations. The consolidation is well underway. The top performer concentration data — where a small percentage of sellers generate a disproportionate share of GMV — reflects this separation in real numbers.
The following operational priorities represent the most impactful changes sellers can make right now, ranked by their effect on the signals that matter most to the 2026 algorithm:
Immediate Priority: Audit Your Shop Performance Score
Open Seller Center, find your SPS, and understand where it sits against the four critical thresholds (2.5, 3.0, 3.5, 4.0). If you are below 3.5, you cannot effectively run an affiliate program — one of the highest-ROI channels on the platform is algorithmically inaccessible to you until your SPS improves. If you are below 3.0, your organic visibility is being throttled right now, regardless of how good your content is. SPS improvement must become the top operational priority before any content or paid campaign investment makes sense.
Short-Term Priority: Fix Your Fulfillment Metrics
Pull your late dispatch rate and pre-fulfillment cancellation rate from Seller Center analytics. If either metric is above the 4% threshold, treat it as an emergency — not a housekeeping item. Every day these metrics stay elevated, the algorithm is suppressing your distribution. Address root causes (3PL performance issues, inventory positioning errors, SKU count overextension) before investing in content that the algorithm will partially suppress anyway.
Medium-Term Priority: Add LIVE to Your Format Mix
If your entire content strategy is video-only, you are operating at approximately half the conversion efficiency of your live-selling competitors. You do not need to run daily live sessions immediately. A structured 2–3 live sessions per week for your top-converting products, combined with proper product showcasing and in-stream offer structures, will materially change your conversion rate profile — and the algorithm will respond to that change within the 7-day velocity measurement window.
Structural Priority: Build for Search, Not Just FYP
Audit your existing content library for search optimization. If your video titles, captions, and spoken content do not include the specific keywords buyers use when searching for your product category on TikTok, you are generating zero compounding traffic from your content investment. Adding a search-optimized content track to your production calendar does not require abandoning your FYP strategy — it requires dedicating 20–30% of your content capacity to longer-form, keyword-rich product content that builds passive search traffic over time.
Ongoing Priority: Manage Your Velocity Windows
Stop treating product launches and promotional events as isolated campaigns. Build a 90-day product velocity calendar that plans re-ignition events before momentum decays — not after. The cost of re-building velocity from zero is significantly higher than the cost of maintaining it through structured, periodic re-ignition. Your best-performing products deserve a proactive maintenance strategy, not just a reactive rescue campaign when they plateau.
The platforms that reward operators over entertainers are the ones that build sustainable, defensible commerce ecosystems. TikTok Shop has made its choice. The sellers who recognize it early enough to restructure accordingly will build positions that compound for years. The sellers who do not will find that no amount of great content can compensate for a business that the algorithm has quietly decided not to trust.
Conclusion: The Operator Era Has Begun
The TikTok Shop algorithm has completed a transition that was structurally inevitable from the moment the platform crossed $30 billion in GMV. A marketplace of that size cannot be governed by entertainment signals alone. Buyers expect reliable fulfillment. Sellers expect fair competition. The platform needs sustainable commerce quality to protect its user relationship and its ad revenue. The algorithm has been updated to enforce all of these requirements simultaneously — and it will continue to tighten them as the platform grows.
The sellers who will win the next chapter of TikTok Shop growth are not the ones with the largest audiences, the most viral videos, or the most aggressive content calendars. They are the ones who understood early that TikTok Shop is now a serious e-commerce platform that demands serious operations — and who restructured accordingly.
The operational signals covered in this piece — your Shop Performance Score, your fulfillment health metrics, your conversion rate by format, your product velocity windows, your GMV Max calibration, your search traffic architecture, and your affiliate infrastructure quality — are not nice-to-have optimizations. They are the primary determinants of your algorithmic visibility on the platform today.
The content still matters. The creative still matters. But both now operate in service of the operational foundation. Build the foundation first, and your content investment will compound. Build only content on a weak operational base, and you will keep outrunning the algorithm — until you cannot.
Your 2026 TikTok Shop Operational Audit Checklist
- ✅ Check your SPS in Seller Center — know exactly which threshold band you are in
- ✅ Pull your late dispatch rate and pre-fulfillment cancellation rate — benchmark against the 4% threshold
- ✅ Calculate your conversion rate by traffic source (video, live, affiliate, paid) — not a blended average
- ✅ Review your GMV Max campaigns for learning phase interruptions and ROI target calibration errors
- ✅ Audit your content library for search keyword optimization in titles, captions, and audio
- ✅ Identify your top 5 products by GMV and build re-ignition events into your next 90-day calendar
- ✅ Assess your affiliate program by conversion data, not follower counts — cut non-converters, deepen investment in top converters
- ✅ If you are not running any LIVE sessions, schedule the first one within the next 30 days
- ✅ Review your account health rating (AHR) alongside SPS — a clean compliance record protects your operational work
- ✅ Map your product portfolio against the category winners framework — demonstrability, price point, and repurchase potential are the algorithmic filter now