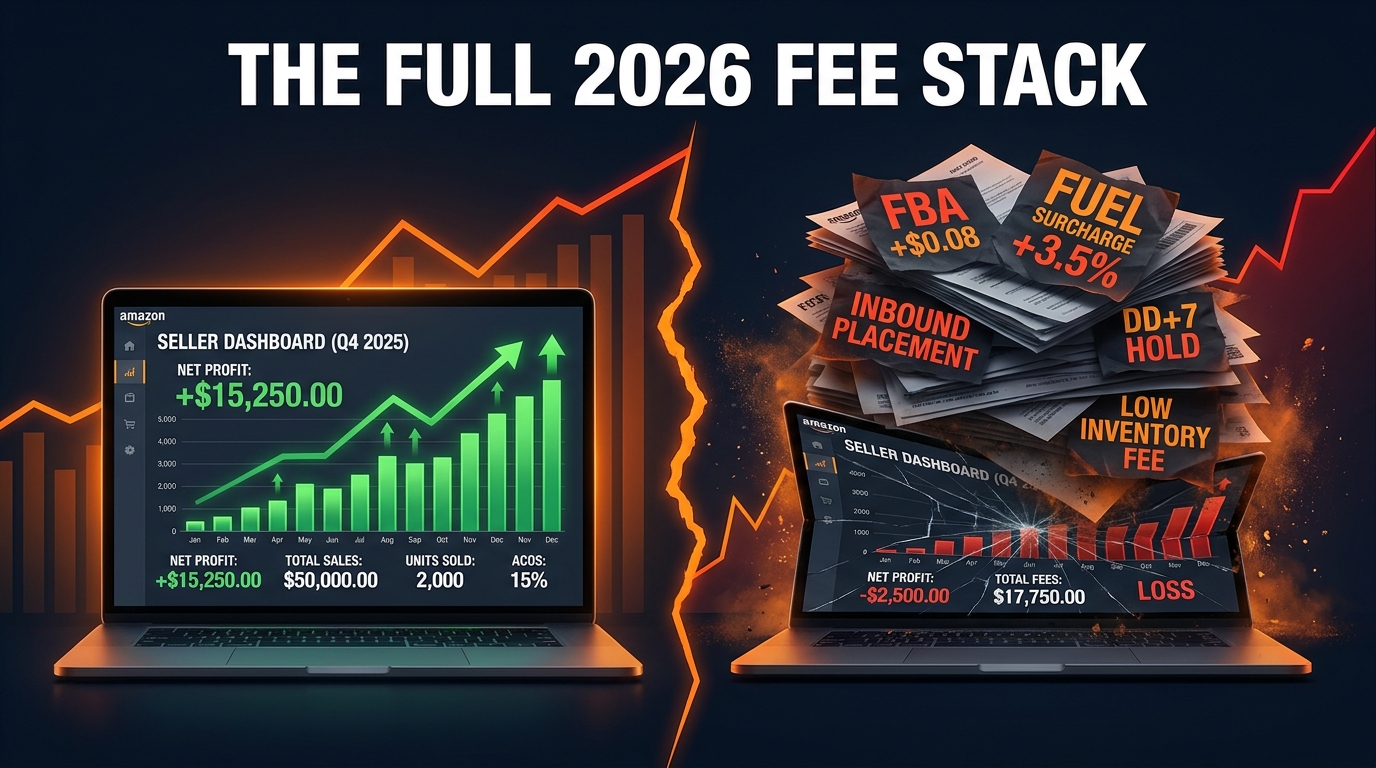

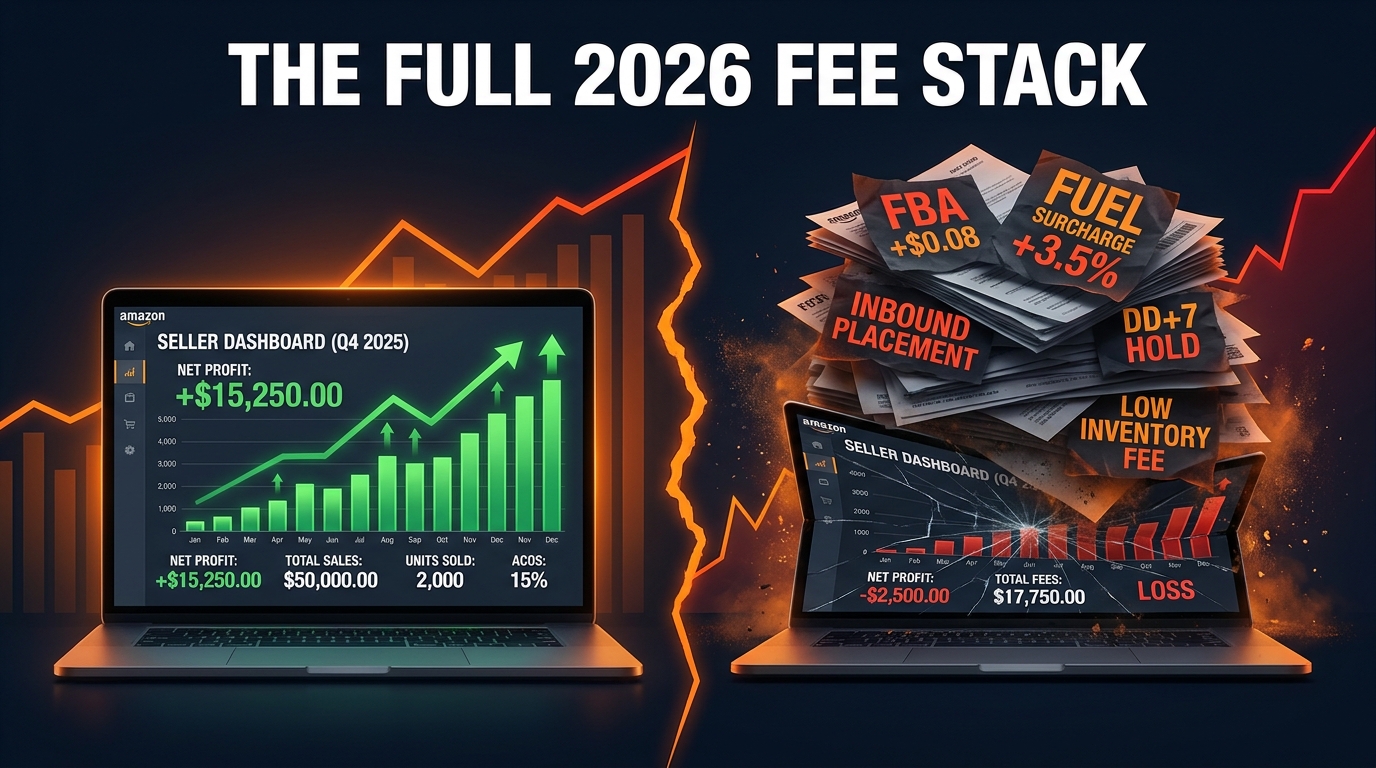
When Amazon announced its 2026 fee update, the headline figure was $0.08 per unit. That’s less than the cost of a first-class stamp. Amazon even pointed out, with some pride, that this represents under half a percent of the average item’s selling price. Framed that way, it sounds like noise — barely worth a line item in your monthly review.
It isn’t noise. And sellers who read that number in isolation and moved on are already feeling the consequences in their disbursements.
The problem isn’t the $0.08. The problem is that the $0.08 was just the opening act. Starting January 15, 2026, Amazon quietly set the stage for a broader structural cost shift — one that layered a fuel and logistics surcharge, tightened inbound placement fees, introduced a delivery-date-based payment hold, and kept the low-inventory fee active at the FNSKU level. Each change, viewed alone, looks manageable. Stacked on top of each other across a high-volume catalog, they tell a very different story.
This article is not a checklist of tips. It’s a forensic breakdown of what the 2026 fee environment actually costs — calculated across price tiers, size bands, and fulfillment scenarios — and a clear-eyed framework for maintaining growth without simply absorbing the damage. The goal is to give you the numbers, the decision logic, and the structural moves that separate sellers who are still scaling from those who are quietly bleeding out.
The Four-Wave Fee Stack: What Actually Hit Your P&L in 2026
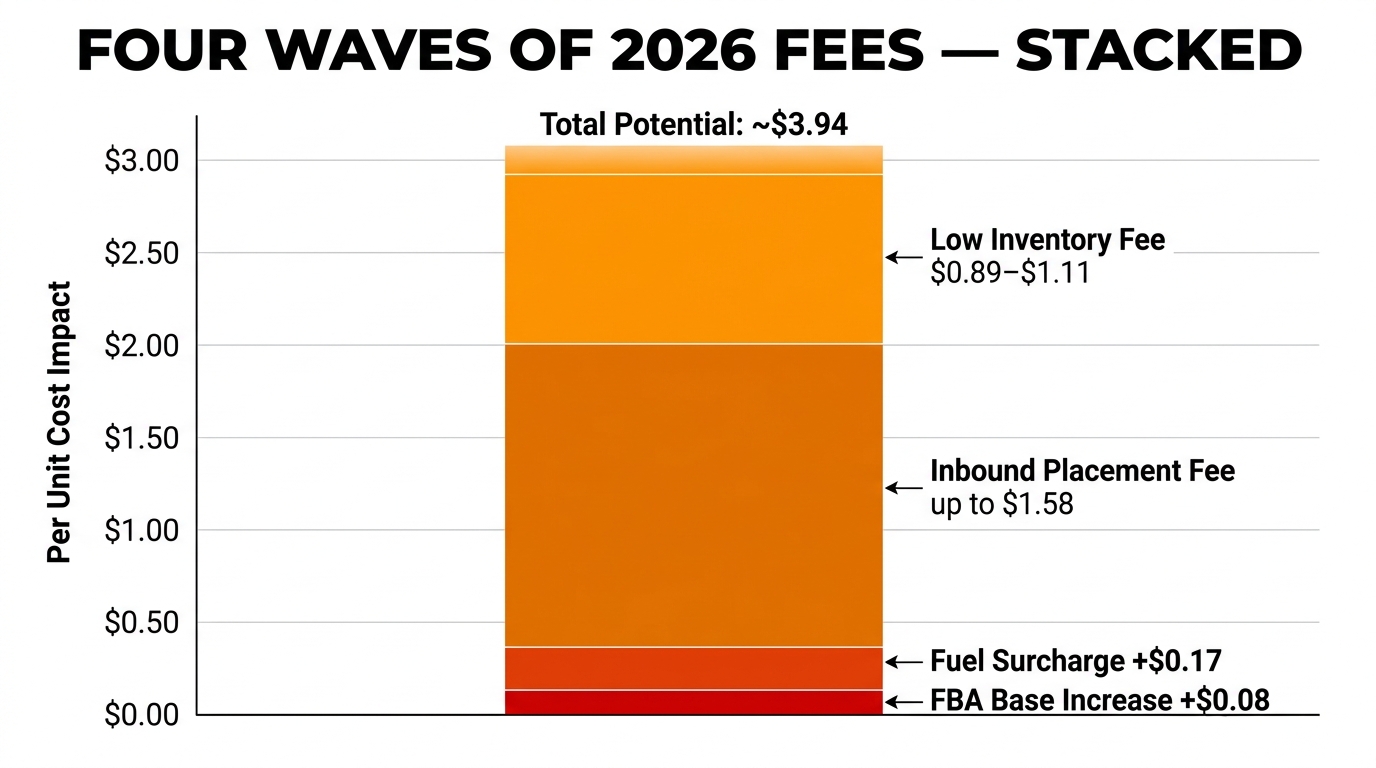
Amazon’s 2026 cost increases didn’t arrive in a single announcement. They arrived in four distinct waves across a four-month window — and the stacking effect is what matters.
Wave 1: The Base FBA Fulfillment Fee Increase (January 15, 2026)
Amazon’s first salvo was the one that got all the press. Effective January 15, 2026, FBA fulfillment fees rose across most standard-size tiers. Amazon’s official average: +$0.08 per unit, or less than 0.5% of average selling price.
But averages obscure. The real picture by price band tells a more nuanced story:
- Items under $10 (small standard): +$0.12 per unit
- Items $10–$50 (standard-size): +$0.08 per unit on average, with some sub-tiers hitting +$0.25
- Items over $50 (large standard): +$0.31 per unit in some configurations
- Oversize items: Varies, with several tiers seeing increases of $0.40 or more
For a seller moving 5,000 units per month across $25–$45 products — a common mid-tier catalog configuration — this wave alone costs an additional $400 to $600 monthly. Annoying, but survivable on its own.
Wave 2: The 3.5% Fuel and Logistics Surcharge (April 17, 2026)
This is where sellers who hadn’t modeled the full year got caught. On April 2, 2026, Amazon announced — with 15 days notice — that a 3.5% fuel and logistics-related surcharge would apply to all FBA fulfillment fees in the U.S. and Canada, effective April 17. The surcharge extended to Buy with Prime and Multi-Channel Fulfillment on May 2.
Amazon framed this as temporary, but provided no end date. The practical impact: an average of +$0.17 per standard FBA unit in the U.S. For that same 5,000-unit-per-month seller, this adds roughly $850 per month — on top of the January increase. For a seller at 50,000 units monthly, the surcharge alone is running an additional $8,500 per month, or $102,000 annualized.
The surcharge applies to fulfillment fees, not to the item’s sale price. That distinction matters: it means no referral fee equivalent, but it also means it compounds directly on the fulfillment cost base that was already raised in January.
Wave 3: The Inbound Placement Fee Increase (January 15, 2026)
Running parallel to the base fee increase, Amazon also tightened its inbound placement fee structure — the charge applied when sellers don’t comply with Amazon’s preferred multi-FC distribution model. This fee had been introduced in 2024, but the 2026 update raised the rates for minimal-split shipments and added complexity at the FNSKU level.
The range is stark: $0.00 per unit if you use Amazon-optimized splits, up to $1.58+ per unit for standard-size items sent to a single fulfillment center. For large or bulky items, the penalty for minimal splits can push past $3.00 per unit. The average seller choosing convenience over compliance on this fee is paying for it in ways that dwarf Wave 1.
Wave 4: The DD+7 Payout Hold (March 12, 2026)
Unlike the first three waves, Wave 4 doesn’t appear on a fee schedule. But it may be the most disruptive to growth-focused sellers. Starting March 12, 2026, Amazon implemented its Delivery Date Based Reserve (DD+7) policy across North America, holding seller funds for a full seven calendar days after confirmed delivery before they become eligible for disbursement.
This isn’t a fee in the traditional sense. But for a business running on working capital to fund the next inventory purchase, it functions exactly like one — it reduces the float available to operate, permanently.
“The real cost of 2026 isn’t the fees themselves. It’s the fees plus the slower cash cycle plus the operational complexity of managing all of it simultaneously.”
Together, these four waves create a cost and cash flow environment that requires a fundamentally different operational posture than what worked in 2024 or even 2025.
The Real Math — How the Layers Add Up Across Price Tiers
Numbers in isolation mislead. The clearest way to understand the true 2026 cost increase is to run it across representative product scenarios — because the impact is wildly uneven depending on your price point, size tier, and operational habits.
Scenario A: The $18 Small-Standard Item
Consider a seller with a product priced at $18, weighing 6 oz, classified as small standard. Before 2026 fee changes, a typical FBA fulfillment fee might have sat around $3.22. Under the 2026 structure:
- Base FBA fee (post-January 15, 2026 increase): ~$3.30
- Fuel surcharge (3.5% of $3.30): +$0.12
- Inbound placement (if single-FC shipment): +$0.45
- Low inventory fee (if sell-through falls below threshold): +$0.89
- Total fulfillment cost at worst-case: $4.76 vs. prior ~$3.22
That’s a 47.8% increase in fulfillment cost if you’re running a non-optimized operation. On an $18 product with a 30% referral-adjusted gross margin, that additional $1.54 per unit can consume 28% of your gross profit per unit. This isn’t a rounding error — it’s a category-level margin crisis for sellers who aren’t paying attention.
Scenario B: The $42 Mid-Range Standard Item
At $42, the math looks better in percentage terms, but worse in absolute dollars for high-volume sellers. A standard fulfillment fee of roughly $5.80 becomes approximately $6.08 after the January increase, then climbs to $6.29 after the surcharge. Inbound placement for optimized splits: $0. Low-inventory fee, avoided with proper restocking: $0.
The well-optimized mid-range seller at $42 is absorbing roughly $0.49 per unit in new costs — painful, but manageable with modest pricing adjustments. The seller who didn’t optimize inbound or manage inventory velocity is looking at $1.80–$2.30 per unit in additional costs. The operational difference between these two outcomes is the entire story of 2026.
Scenario C: The $8 Low-Price Item
Amazon’s Low-Price FBA program gives sub-$10 items a slightly different fee structure, and the 2026 changes were actually more favorable here in relative terms — the below-$10 tier saw only a +$0.05 average increase, and the program maintains discounted rates. For sellers firmly in this bracket, Wave 1 is the least damaging wave. However, Wave 2 (the surcharge) still applies proportionally, and thin margins mean that even $0.17 per unit additional can represent 5–8% of total revenue at this price point.
The lesson across all three scenarios: your fee sensitivity is entirely a function of your operating habits. Two sellers moving identical products at identical prices can have wildly different effective cost structures in 2026 based purely on how they manage inbound, inventory, and disbursement timing.
The Cash Flow Trap That’s Slowing Growth More Than the Fees Themselves
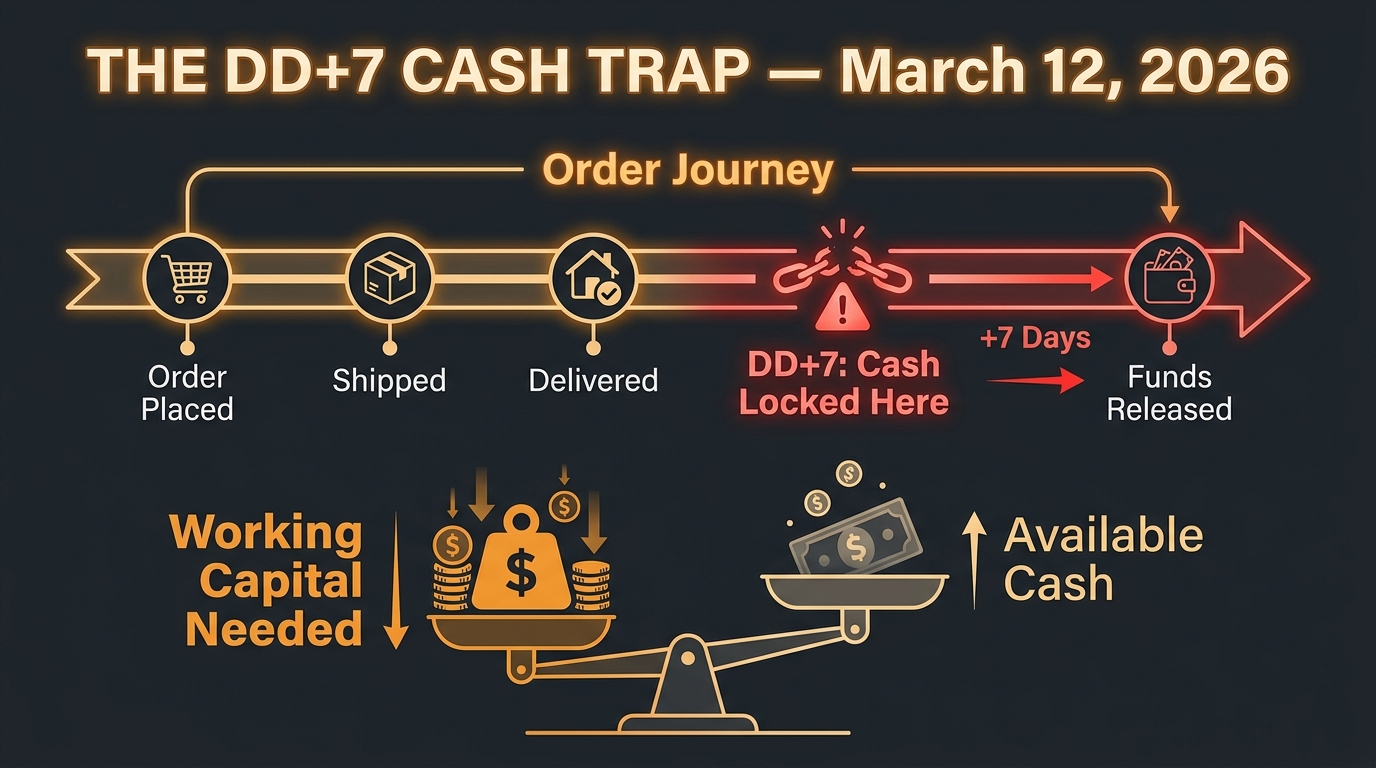
The DD+7 policy deserves its own section because it operates invisibly — it doesn’t show up on your fee report, it doesn’t generate a line item in Seller Central, and it doesn’t trigger any alert. It simply makes your money available later, and that delay has compounding consequences that most sellers haven’t fully modeled.
Understanding the Mechanics
Prior to March 12, 2026, Amazon calculated your reserve based on shipment confirmation. Orders shipped and delivered in the normal window meant funds typically became available for disbursement within a few days of delivery. Under DD+7, the clock doesn’t start until delivery is confirmed — and then runs for seven more calendar days.
For a standard Prime shipment that delivers in 2 days, this adds approximately 5 additional days of float compared to the old reserve model. On paper: minor. In practice, for a seller doing $200,000 per month in revenue, that means roughly $33,000 in additional funds tied up inside Amazon’s system at any given point — a permanent increase in the working capital requirement that doesn’t earn interest and can’t be invested in inventory.
The Compounding Effect for Growth-Oriented Sellers
The sellers most damaged by DD+7 are not the ones with stagnant catalogs — they’re the ones growing fastest. A seller scaling from $150K to $300K in monthly revenue needs to double inventory investment. With DD+7 holding an increasing proportion of funds in reserve as revenue grows, the working capital shortfall accelerates in proportion to the growth rate.
Consider the scenario: a seller growing 15% month-over-month now has to fund that growth not just from profits and reinvested revenue, but against a growing reserve pool that scales with their success. This creates a structural pressure to either slow growth (to stay within available capital) or seek external financing — at rates that further compress margins.
Practical Mitigation: Bridging the Float Gap
There are three practical responses to DD+7 that don’t involve slowing your growth:
- Accelerate disbursement frequency: Request daily disbursements from Amazon rather than the default bi-weekly. This doesn’t change the reserve rules, but it moves eligible funds out of Amazon faster and into accounts where you control deployment.
- Build a cash buffer milestone into growth planning: Before launching a major reorder or new ASIN, ensure you have 8 weeks of operating capital on hand rather than the 4–6 weeks that was sufficient under the old reserve model.
- Separate your ad spend account from your inventory capital: With Amazon now pulling PPC charges directly from disbursements in some configurations, it’s critical to model advertising costs as a direct deduction from available cash, not a separate ledger entry you account for later.
The DD+7 policy is not going away. It was implemented as a structural risk management measure, and Amazon has given no indication it will be reversed. Building your growth model around it — rather than hoping it changes — is the only durable response.
SKU-Level Triage — Finding the Winners, Cutting the Losers
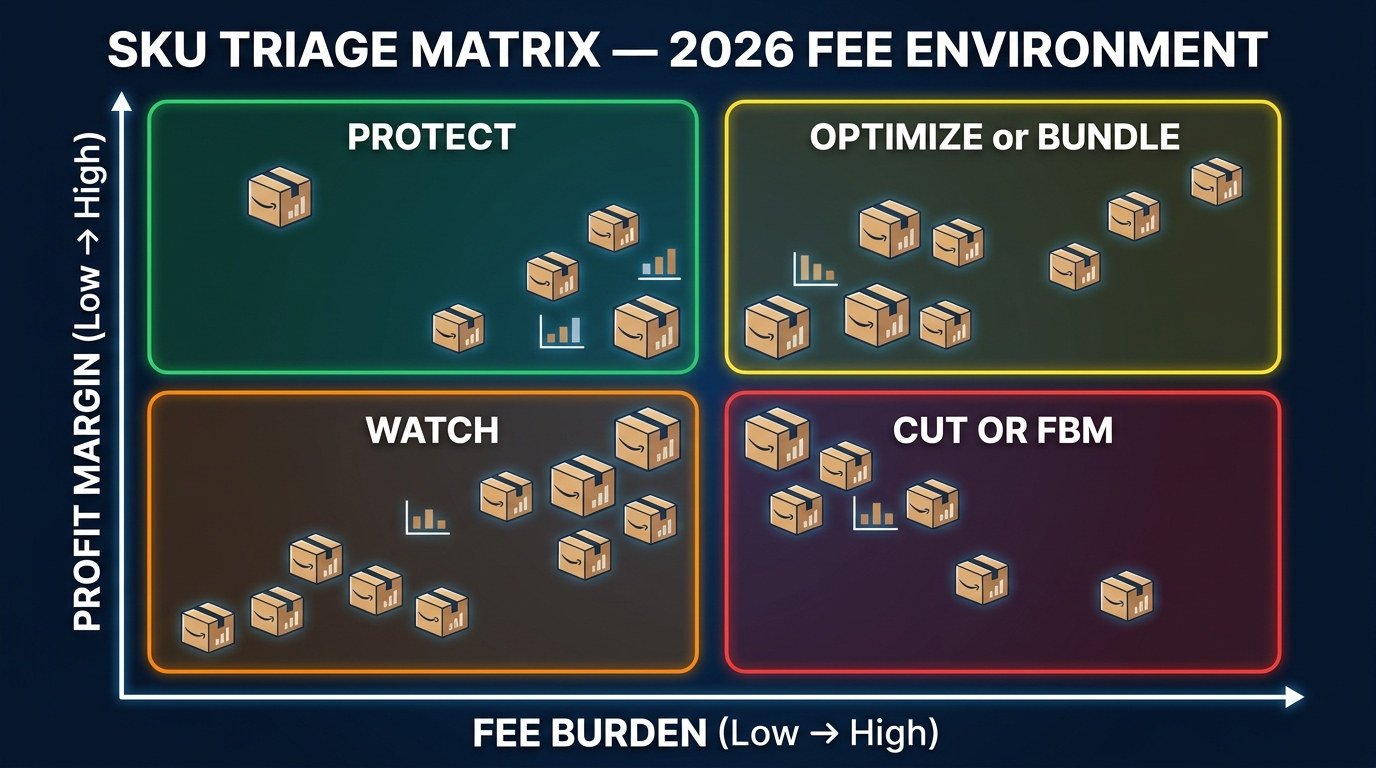
The 2026 fee environment has made one thing undeniably clear: managing your Amazon business at the catalog level is no longer sufficient. Every pricing decision, every reorder, every ad campaign needs to be anchored to SKU-level unit economics under the new cost structure — not last year’s margins, and not blended averages.
Building Your SKU Triage Model
Start with a full recalculation of net margin per ASIN using 2026 fee inputs. For each SKU, you need:
- Current selling price
- Amazon referral fee (percentage of sale price — unchanged for most U.S. categories in 2026)
- FBA fulfillment fee (post-January 15, 2026 rates, by size tier)
- Fuel surcharge (3.5% of FBA fulfillment fee)
- Inbound placement fee (actual rate based on your shipping behavior)
- Low-inventory fee (apply if your historical sell-through is below Amazon’s threshold for that FNSKU)
- Storage fees (monthly rate × average days of inventory held)
- COGS
- PPC spend per unit sold (your TACOS for that ASIN)
The resulting net margin per unit is your triage anchor. Benchmark target: most growth-focused sellers should be protecting a minimum of 15–20% net margin per SKU after all fees and ad spend. Below 12%, you’re in watch territory. Below 8%, you’re funding Amazon’s logistics network at a loss.
The Four Quadrants
Once you have SKU-level margins calculated under 2026 fees, sort your catalog into four action categories:
Protect: High margin, low fee burden. These ASINs are your cash engines. Invest in their visibility, defend their pricing, and ensure they never run into low-inventory fee territory. Double down on ad spend efficiency here.
Optimize or Bundle: High margin but high fee burden — usually because of size, weight, or inbound habits. These are salvageable with operational fixes: better inbound planning, packaging redesign to hit a lower size tier, or bundling to improve the revenue-per-shipment ratio. Before cutting, model what they look like with optimized inbound and lower TACOS.
Watch: Low margin, low fee burden. These are marginal performers that might survive fee optimization or a modest price increase. Give them 60 days after adjustments to improve. If they don’t move, they move to the next category.
Cut or FBM: Low margin, high fee burden. These are the SKUs quietly destroying your blended profitability. Cut them from FBA, evaluate FBM viability, or discontinue. Every unit you sell at 4% net margin while better inventory sits un-stocked is an opportunity cost with a specific dollar value.
The Rationalization Mindset Shift
Many sellers resist SKU rationalization because revenue looks good, and cutting SKUs feels like shrinking. The reframe: a 200-ASIN catalog with 30% of SKUs below 10% net margin is not a bigger business than a 140-ASIN catalog where every SKU hits 18%+. It’s a more complicated, more capital-intensive version of the same revenue — with more ways to lose money and less clarity about where growth is coming from.
The most operationally efficient Amazon businesses in 2026 are running leaner catalogs with tighter unit economics — not because they can’t grow, but because they’ve learned that growth built on marginal SKUs is growth that fees will eventually eat.
Inbound Placement and Low-Inventory Fees: The $0 Path Most Sellers Miss
Of all the fees in Amazon’s 2026 structure, the inbound placement fee is the one most sellers are overpaying for the most preventable reason: they ship the way they’ve always shipped, without re-engineering their inbound process around Amazon’s incentive structure.
How Amazon’s Incentive Architecture Actually Works
Amazon wants your inventory pre-distributed across its fulfillment network. When you ship everything to one FC, Amazon has to move it — and they charge you for the privilege. When you follow their optimized split plan — shipping portions of your inventory to multiple FCs as directed — they waive the fee entirely.
The math is blunt: zero dollars versus up to $1.58 per unit for standard-size items, and $3.00+ per unit for large items. On a shipment of 500 units, that’s the difference between $0 and $790 in fees for a single inbound. At scale, this is one of the highest-return operational changes any FBA seller can make.
Practical Challenges and How to Solve Them
The most common objection to Amazon-optimized splits: complexity. Shipping to multiple FCs means coordinating different shipment IDs, labels, and carrier pickups — a logistics overhead that feels disproportionate for smaller operations. The practical answer is to work with a 3PL or prep center that handles the split natively. Many prep centers already manage Amazon-compliant multi-FC distributions as a standard service. The cost of that service is almost always lower than the inbound placement fee you’d pay for consolidation.
Amazon Warehousing and Distribution (AWD) is another lever here — it functions as a middle-mile solution that can help distribute inventory across the FBA network while reducing inbound placement fee exposure. For sellers with steady-volume ASINs and predictable reorder cadence, AWD can meaningfully simplify the split logistics problem while keeping placement fees at or near zero.
Managing the Low-Inventory Fee at the FNSKU Level
The low-inventory fee — approximately $0.89 to $1.11 per unit shipped when sell-through falls below Amazon’s threshold — has an additional complication in 2026: it now applies at the FNSKU level, not the ASIN level. This matters because parent ASINs with multiple variations (colors, sizes) can have individual FNSKUs triggering the fee even if the parent ASIN looks healthy in aggregate.
The practical implication: your restock planning needs to be disaggregated to the variation level, not just the product level. A seller with 10 variations of a product who restocks “the product” at the top level may be inadvertently running 3 or 4 individual FNSKUs below the threshold — incurring the fee on each unit shipped from those variations while other variations sit with comfortable coverage.
The target inventory coverage to avoid this fee: at least 4–6 weeks of forward sell-through per FNSKU, maintained consistently. Build this into your restock alerts as a hard floor, not a guideline.
When FBM and Hybrid Fulfillment Actually Make Sense (With Numbers)
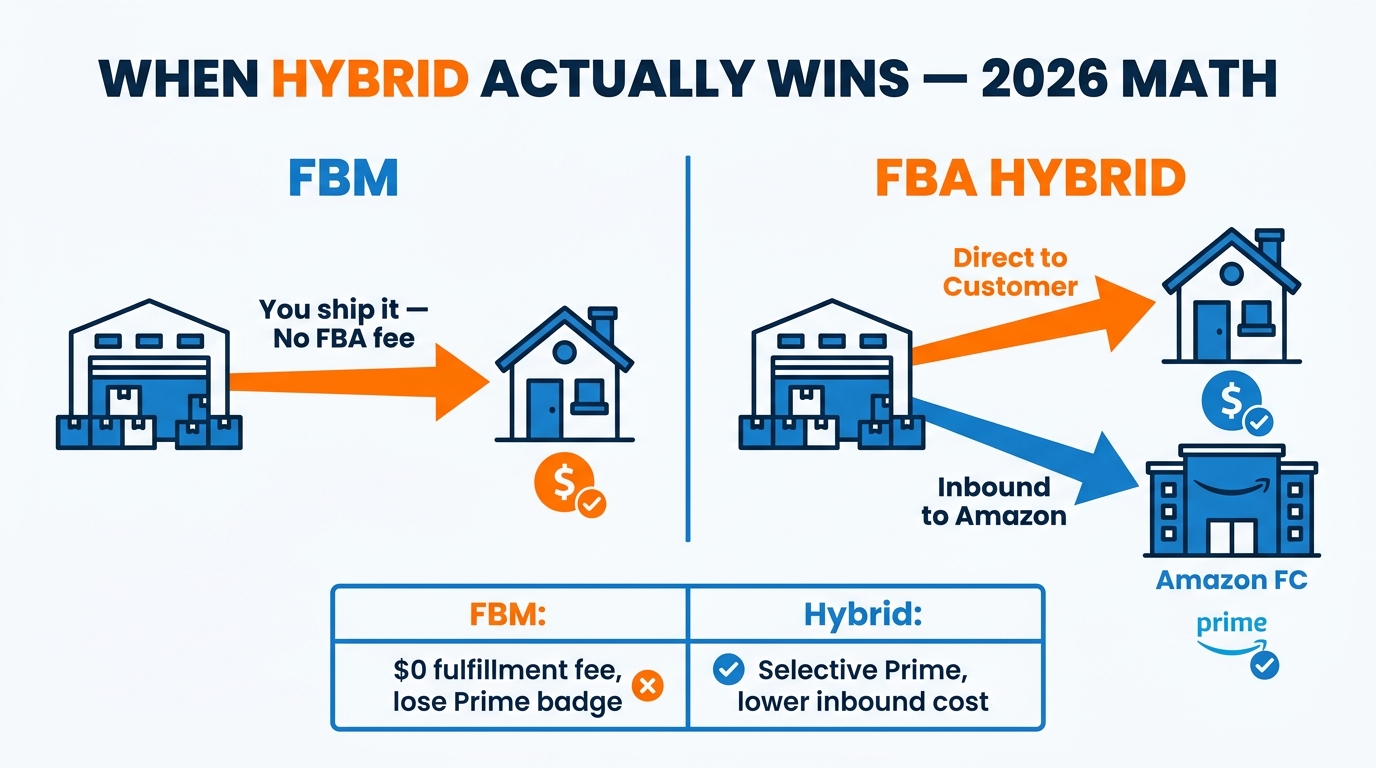
Fulfilled by Merchant has always existed as an alternative to FBA, but it’s historically been treated as the option of last resort — the fallback for out-of-stock FBA inventory, or for sellers who haven’t yet made the FBA leap. In 2026, that framing needs to change. FBM is not a fallback. For specific SKU profiles, it’s the smarter economic choice — and the question is simply knowing which SKUs belong where.
The Economics of FBM in 2026
FBM eliminates the FBA fulfillment fee, the fuel surcharge on that fee, the inbound placement fee, and the monthly storage fee. What it costs instead: your own fulfillment cost (picking, packing, shipping), and — critically — the loss of the Prime badge on most listings.
The conversion rate hit from losing Prime is real. Studies consistently show Prime badge listings convert at meaningfully higher rates, and losing it on a competitive listing can cost 15–30% of conversion depending on category. That conversion loss translates directly into lower organic ranking, which compounds over time.
So FBM doesn’t make sense for your core, high-velocity, competitive listings. But it does make sense for:
- Low-velocity, high-value items where storage fees compound and demand doesn’t justify maintaining FBA stock year-round
- Bulky or oversized items where FBA fees are disproportionately high relative to the product’s selling price
- Seasonal items where you’d otherwise pay Q4 storage surcharges on inventory that sits from February through September
- Test-launch ASINs where you want to validate demand before committing to FBA inbound minimums and placement costs
Building the Hybrid Model
The most effective approach isn’t a binary FBA-or-FBM decision — it’s a hybrid model where you route each SKU through the channel that makes the most economic sense, and revisit that routing quarterly as your sell-through data matures.
A practical framework: for any SKU where FBA total fees (fulfillment + surcharge + storage + placement) exceed 22% of selling price, model the FBM alternative with your actual shipping rates. If the FBM cost comes in at 14–16% of selling price and the item isn’t highly conversion-sensitive (lower competition, unique product, longer consideration cycle), FBM wins.
For sellers with Seller Fulfilled Prime eligibility, the hybrid case gets even stronger — SFP allows you to keep the Prime badge while fulfilling from your own warehouse, eliminating FBA fees entirely. SFP eligibility requires a premium on-time delivery rate and has strict operational requirements, but for high-volume sellers with their own logistics infrastructure, it’s worth modeling as a third option alongside FBA and standard FBM.
3PL as the Middle Path
For sellers who want FBM economics without managing their own fulfillment, third-party logistics providers — particularly those with Amazon-native integrations — offer a middle path. A quality 3PL in a favorable shipping zone can often deliver 2-day ground shipping to a large portion of the U.S. population, providing de facto Prime-like delivery speed without FBA fees. This is increasingly viable as carrier infrastructure has improved and consumers’ definition of “fast” has broadened slightly since the COVID-era Prime expectation peak.
Bundling as a Fee-Reduction Tool — Not Just an Average Order Value Play
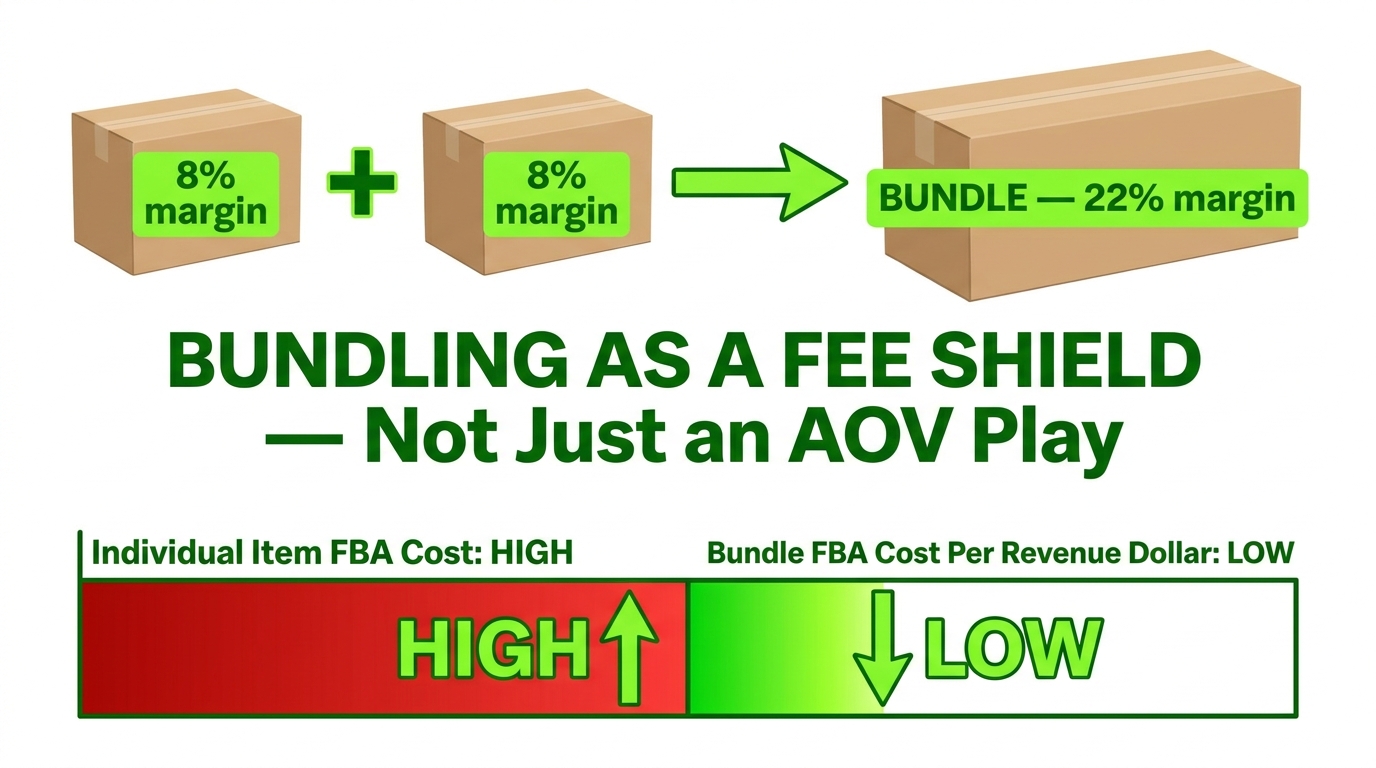
Product bundling is typically discussed as an average order value strategy — sell more per transaction, increase revenue per customer. That framing is accurate, but it misses the more immediate and quantifiable benefit in a high-fee environment: bundling changes the fee-to-revenue ratio at the unit level.
The Fee Math Behind Bundling
FBA fulfillment fees are calculated per shipment, not per dollar of revenue. When you combine two complementary items that previously shipped separately, you pay one fulfillment fee (plus a modest weight-based adjustment) instead of two. The revenue increases by the sum of both items; the fee increases by far less.
A concrete example: Item A sells for $14 with an FBA fee of $3.22 and a 12% net margin. Item B sells for $12 with an FBA fee of $3.10 and a 10% net margin. Bundled at $28 (modest bundle discount), the combined FBA fee might be $4.50 for the slightly heavier package — a fulfillment cost savings of $1.82 per transaction compared to two separate sales. At 300 units per month, that’s $546 in monthly fee savings from bundling alone, before counting any conversion or average order value benefits.
At the 2026 fee level — where that same $3.22 fee is now closer to $3.42 after the fuel surcharge — the per-unit savings from consolidation compound slightly, and the percentage of revenue consumed by fees drops as the bundle’s revenue base expands.
Bundle Design That Actually Works
Not all bundles generate this math. Poorly designed bundles — items that don’t naturally go together, heavy combinations that create a new heavyweight size tier, or bundles that are so obvious competitors immediately copy — can underperform the individual items. The principles of high-functioning bundles in a fee-optimization context:
- Complementary use cases: Bundle items customers genuinely want to use together. The bundled purchase has to make intuitive sense, or the conversion rate improvement disappears and you’re left with the same volume at higher COGS.
- Size-tier awareness: Adding a second item that tips the package into a higher size tier can eliminate the fee savings entirely. Always model the dimensional weight of the combined product before committing to a bundle design.
- Bundle as a margin defender, not just a revenue grower: Bundles that include at least one higher-margin item use that item’s margin to offset the lower margin of a companion product — improving blended profitability while also reducing the per-unit fee burden.
- Competitive differentiation: The best bundles can’t be easily replicated by competitors buying individual components and re-listing them as a bundle — usually because the bundled items are private label, or because the combination requires specific packaging or design not available separately.
Pricing Strategy in a Fee-Inflated Marketplace
The instinctive response to rising fees is to raise prices. The instinct isn’t wrong — but undifferentiated, across-the-board price increases are one of the highest-risk moves in a competitive marketplace, particularly when competitors haven’t yet passed through the same costs.
The Case for Selective, Data-Driven Repricing
The sellers managing 2026 fee increases most effectively are not raising prices uniformly. They’re identifying the subset of their catalog where price elasticity is low, competition is thin, and the margin compression is most severe — and repricing precisely those ASINs.
How to identify which SKUs can absorb a price increase without conversion damage:
- Low share-of-voice competition: If you’re one of two or three sellers in a category rather than one of twenty, buyers have fewer alternatives — price sensitivity is lower.
- High review velocity and strong ratings: Products with 4.5+ stars and 500+ reviews have earned a trust premium that supports modest price increases without conversion collapse.
- Consumable or repeat-purchase products: Customers who are already repeat buyers have demonstrated willingness to pay and lower price sensitivity than new buyers.
- Low-review-count competitors: If your best-ranked competitor has fewer reviews or lower ratings, the competitive price pressure is softer and you have more room to move.
The Price Tier Optimization Strategy
Amazon’s 2026 fee structure uses price-based tiers for fulfillment calculations. This creates a pricing optimization opportunity that most sellers are leaving unexamined. Specifically: products priced at $9.99 sit in the under-$10 tier with its lower fee structure. A product priced at $10.01 — just two cents higher — moves into the $10–$50 tier, which has a higher fulfillment fee.
For products currently priced just above a tier boundary, there’s a case for either moving the price down to capture the lower fee tier (sacrificing marginal revenue for lower cost), or moving it meaningfully higher into the new tier to ensure the additional fee is offset by sufficient additional margin. Sitting at $10.25 — just above the boundary with a higher fee but not enough price premium to offset it — is the worst of both worlds.
The Price Increase Framing Problem
When raising prices, timing and framing matter more than sellers typically account for. Price increases implemented immediately after a new product launch damage review velocity at the worst possible time. Price increases on seasonally strong products — made in advance of peak demand — are absorbed more easily because high purchase intent masks price sensitivity. Price increases on well-reviewed, mature products are less likely to trigger ranking penalties than increases on newer, less-established ASINs.
The approach: schedule price increases for the right moment in your product’s lifecycle and your category’s seasonal cycle, not simply at the moment when you’ve done the margin math and realized you need more revenue per unit.
Protecting Ad Spend Efficiency When Margins Are Compressed
Fee increases that compress gross margins create an immediate and dangerous secondary effect: they reduce the maximum bid a seller can afford in PPC while remaining profitable. If your net margin per unit dropped from 18% to 13% due to 2026 fees, your maximum viable TACOS target dropped proportionally — and any ad campaigns that were previously break-even are now loss-making.
Recalibrating Your Profit-Adjusted TACOS Target
The first step after modeling 2026 fee impacts is to recalculate your target TACOS for every significant ASIN, using the new fee-adjusted margin as the denominator. If your gross margin per unit (after fees, before ad spend) dropped from 35% to 30%, your maximum TACOS budget to hit a 15% net margin target dropped from 20% to 15%. Running the same campaigns at the same bids against a compressed margin floor is a guaranteed path to margin destruction.
Recalibrated TACOS targets should feed directly into your campaign bid caps. Any keyword or campaign where your ACOS is running above your new maximum isn’t just underperforming — it’s actively destroying margin that fees have already tightened.
Where to Cut and Where to Hold
The natural impulse under margin pressure is to cut ad spend broadly. This is usually wrong. The more defensible approach: cut spend on defensive and brand-protection campaigns for products with strong organic rank — these campaigns often have the highest ACOS and the lowest incremental impact. Hold or increase spend on top-of-search campaigns for your highest-margin ASINs, where PPC-driven velocity directly supports organic rank and long-term visibility.
The campaigns to cut first: broad match campaigns on competitive keywords for low-margin SKUs, auto campaigns on ASINs that have already achieved strong organic rank, and category targeting campaigns where conversion rates are below category average. The campaigns to defend: exact match on your highest-converting branded and category-defining keywords, and sponsored brand campaigns where your creative is demonstrably outperforming competitors.
The Fee-Adjusted Advertising Efficiency Benchmark
A useful rule of thumb for 2026: your blended TACOS across the catalog should not exceed your average gross margin minus your target net margin minus a 3% buffer. If your average gross margin is 32% and your net margin target is 15%, your maximum sustainable TACOS is 14%. Above that, you’re trading long-term profitability for short-term visibility — a trade that makes sense occasionally and deliberately, but not as an ongoing operational posture.
Europe as a Fee Relief Valve: What Amazon’s 2026 EU Changes Actually Offer
While the U.S. fee story in 2026 is unambiguously upward pressure, the European picture is different — and for sellers with the infrastructure or appetite to expand internationally, it represents a meaningful counterweight to domestic cost increases.
Amazon’s 2026 EU Fee Reductions
Amazon reduced FBA fees across several European marketplaces in 2026, including category-specific referral fee cuts and lower per-unit fulfillment costs for parcel-size and low-price items. The average reduction across impacted categories in Europe was approximately 2–4% of the FBA fee — modest in absolute terms, but directionally opposite to the U.S. trajectory.
For sellers already operating across Amazon UK, DE, FR, IT, and ES, the 2026 EU changes represent an opportunity to rebalance catalog focus — leaning into European sales for margin-sensitive SKUs while maintaining the U.S. volume that drives organic rank on the primary marketplace. Some sellers have found that the blended economics of running the same product in both U.S. and EU markets actually improve their total margin picture despite the FBA fee increases on the U.S. side.
The Reality of EU Expansion for U.S.-Primary Sellers
Expanding to European marketplaces is not a fee-avoidance strategy in any simple sense — it comes with its own complexity: VAT registration and compliance in each country of sale, multi-currency cash flow management, different category regulations, and the operational requirements of either pan-European FBA or individual country fulfillment strategies.
That said, for sellers already at the scale where a dedicated international team or agency is viable, the 2026 EU environment is more favorable than it’s been in several years — lower fees, a maturing cross-border logistics infrastructure, and Amazon’s ongoing investment in European Prime delivery speed. The long-term structural case for European expansion has improved even if the immediate fee differential alone doesn’t justify the operational complexity.
Building Fee Resilience Into Your 2026 Growth Plan
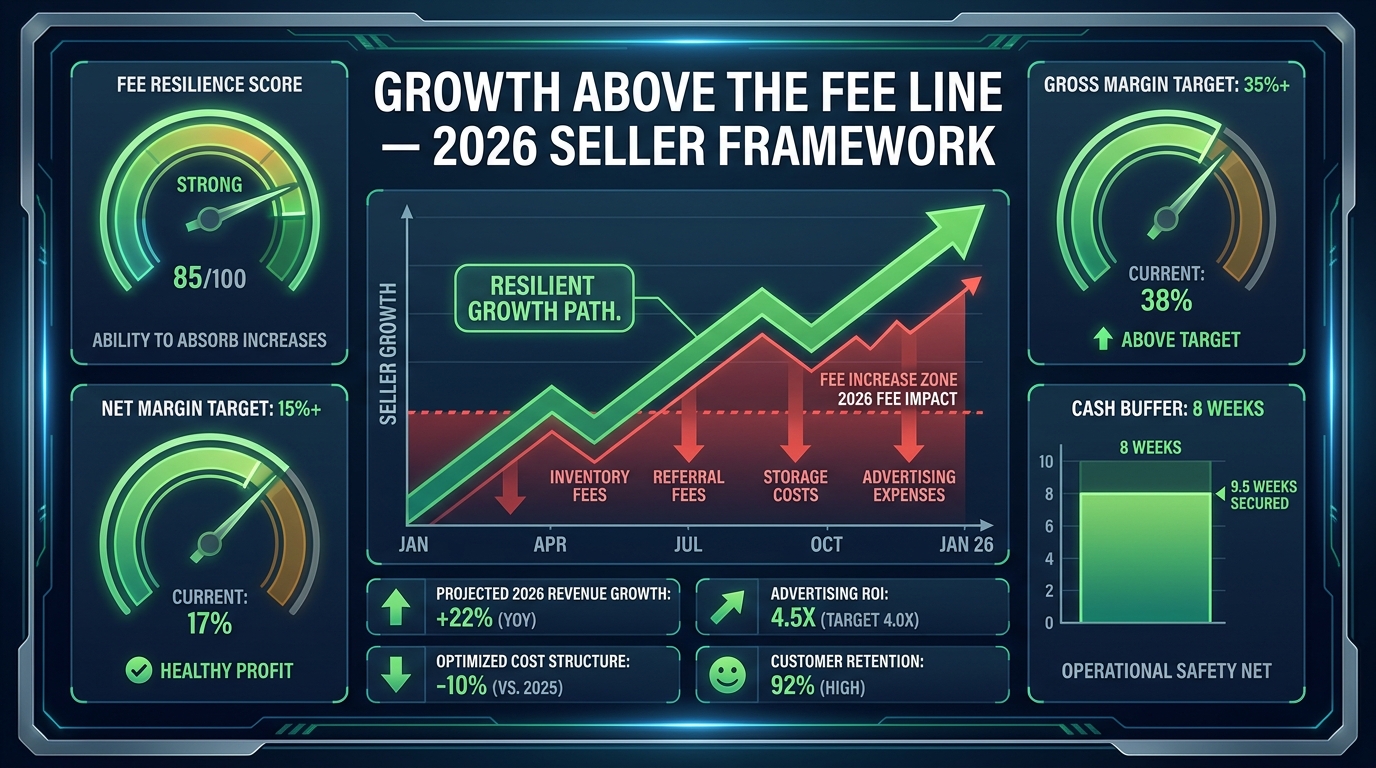
Fee resilience is not the same as fee avoidance. You cannot avoid Amazon’s fees — you can only minimize unnecessary fee exposure through operational precision, and build a business structure that remains profitable and growth-capable within the fee environment that actually exists, not the one you’d prefer.
The Four Pillars of Fee-Resilient Amazon Growth
Pillar 1: Gross margin discipline. Set a non-negotiable gross margin floor per SKU before PPC and before overhead. For most catalog types, 35% gross margin post-fees is the minimum sustainable target in 2026. Below that, there’s no buffer for PPC, no room for error on inventory timing, and no capacity to absorb the next fee increase — because there will be a next one. Products that can’t reach 35% gross margin under current fee structures need to be redesigned, repriced, rebundled, or removed.
Pillar 2: Operational precision on inbound and inventory. Treat inbound placement optimization and FNSKU-level inventory management as revenue-generating activities, not back-office logistics. Every dollar avoided on inbound placement fees goes directly to net margin. Every FNSKU kept above the low-inventory threshold avoids a per-unit charge that compounds at scale. These aren’t minor administrative tasks — they’re material profit levers in 2026.
Pillar 3: Cash flow architecture. With DD+7 permanently increasing working capital requirements, sellers need to model cash flow at a 10–12 week forward horizon rather than the 4–6 week window that was sufficient in prior years. Build an explicit cash reserve policy — a minimum number of weeks of operating cash that must remain available even at peak growth — and treat breaching that floor as a growth-pause trigger, not a financing trigger.
Pillar 4: Portfolio diversification without fragmentation. Growing your Amazon business by adding more SKUs is a margin-diluting strategy if those SKUs don’t meet your margin floor. Growing by deepening the economics of your best SKUs — better inbound, better conversion, better ad efficiency, better bundling — is how you grow revenue and margin simultaneously. The 2026 fee environment punishes portfolio breadth and rewards portfolio depth.
The Mindset Shift That Changes Everything
Amazon’s fee structure is not a cost to minimize — it’s a design constraint to build around. The sellers who thrive in 2026 and beyond are the ones who treat every fee change as an input to product, pricing, and fulfillment decisions — not as an external tax they have to absorb.
When a new fee is announced, the question isn’t “how do I avoid this?” — it’s “does this change the optimal price point, size tier, fulfillment channel, or bundle configuration for this SKU?” That question, answered systematically across every meaningful ASIN in your catalog, is the analytical foundation of a fee-resilient Amazon business.
The sellers who will look back on 2026 as the year they consolidated their competitive position are not the ones with the lowest fees — they’re the ones who built systems to manage fee dynamics continuously, made the structural decisions their competitors delayed, and kept growing while everyone else was absorbed in damage control.
Actionable Takeaways: The 2026 Fee Survival Checklist
Every section above contains specific, executable moves. For easy reference, here are the highest-priority actions by timeline:
Immediate (Do This Week)
- Recalculate net margin per ASIN using 2026 FBA rates + 3.5% fuel surcharge + your actual inbound placement fee rate
- Identify every SKU below 12% net margin — these are your triage candidates
- Request daily disbursements in Seller Central to partially offset the DD+7 cash flow impact
- Set FNSKU-level restock alerts for every variation in your catalog at a 6-week coverage floor
Within 30 Days
- Redesign your inbound shipment process to use Amazon-optimized splits — negotiate with your current prep center or identify one that manages multi-FC splits natively
- Recalculate maximum TACOS targets for all major ASINs under the new margin structure; pause or reduce bids on campaigns exceeding the new limit
- Identify two or three SKUs viable for FBM or hybrid fulfillment and model the economics with your actual shipping rates
- Identify the top bundle opportunity in your catalog (highest individual-item fee-to-revenue ratio + natural complementarity)
Within 90 Days
- Complete your full SKU triage and execute the “cut or FBM” decisions for low-margin, high-fee-burden ASINs
- Implement any price increases you’ve identified as viable, timed to seasonal strength or category opportunity windows
- Build an 8–12 week forward cash model that accounts for DD+7 reserves at projected revenue levels
- Evaluate whether your top-margin SKUs are viable on EU marketplaces as a blended economics improvement
The 2026 fee environment is demanding — but it’s demanding for every seller on the platform. The businesses that emerge from this cycle with better margins and stronger competitive positions will be the ones that made systematic, data-anchored decisions while competitors were still debating whether $0.08 per unit was worth worrying about.
It is. And now you know exactly why.