There is a particular kind of pain that TikTok Shop operators know well: the dashboard looks incredible. Affiliate GMV is up 40% month-over-month. Creators are posting. Orders are coming in. The number in the top-left corner of Seller Center keeps climbing, and your team keeps sharing screenshots in the group chat.
Then you look at the bank account.
This is the GMV trap — and in 2026, it is catching more TikTok Shop operators than ever before. U.S. TikTok Shop GMV reportedly crossed $23.4 billion this year, and the platform’s affiliate ecosystem has exploded alongside it. More creators. More products. More moving parts. And for a significant slice of the brands driving that number, more revenue is actually producing less cash.
The problem is not the affiliate channel itself. TikTok Shop affiliates can be one of the highest-ROI customer acquisition mechanisms available to a product brand today. The problem is how operators manage the channel — specifically, the almost universal habit of measuring success by GMV rather than by actual, after-all-costs, deposited profit.
This post is about changing that. Not with generic advice about “knowing your margins” — but with a concrete, operator-level framework for running a TikTok Shop affiliate program the way a finance team would: with real unit economics, structured creator tiers, disciplined seeding budgets, return-adjusted commission math, and the operational systems that make all of it measurable and repeatable.
If your affiliate program is growing and your profit isn’t, you are in the right place.
The GMV Trap: Why Growing Revenue Can Mean Shrinking Cash
Before building anything, it helps to understand exactly how the GMV trap closes around operators who should know better. The mechanism is not carelessness — it is the natural result of measuring the wrong thing at the wrong time.
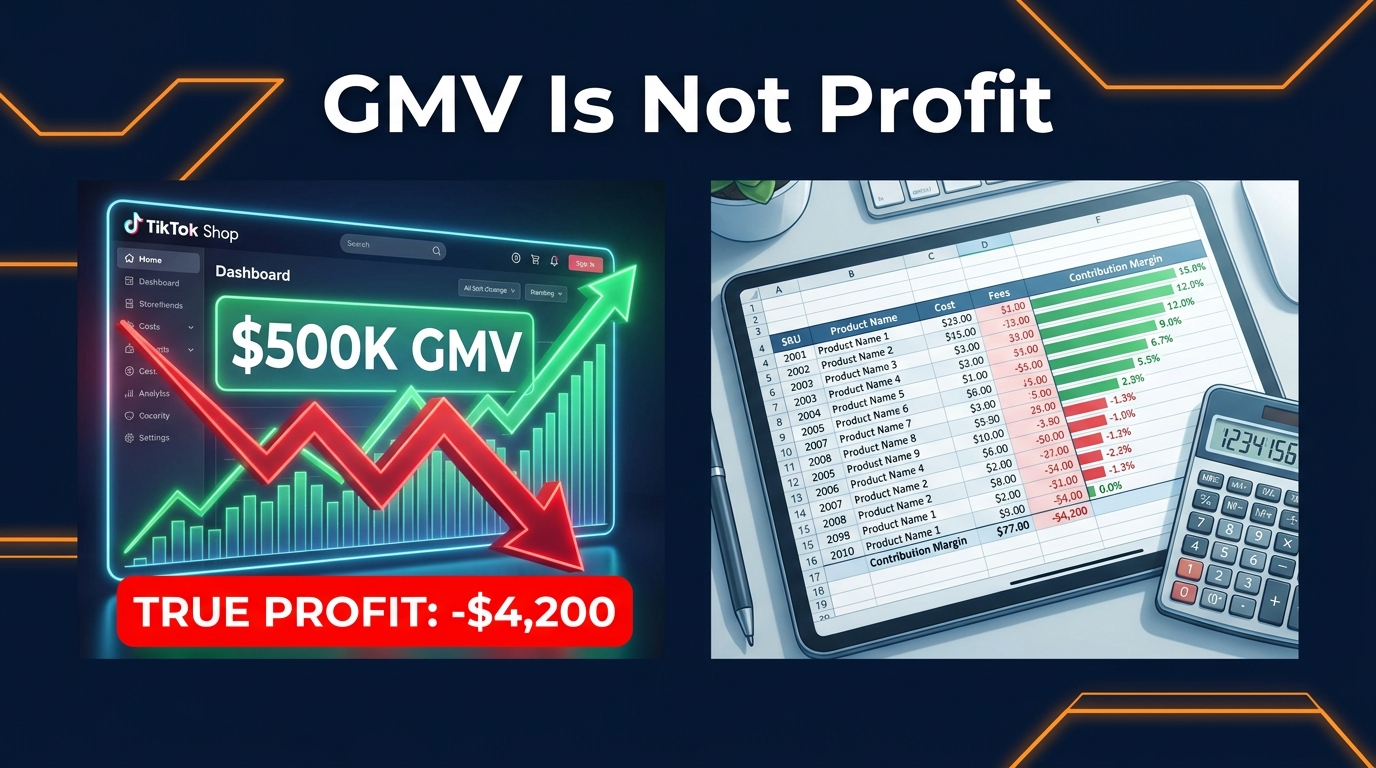
The $500K Problem
Consider a scenario that has become something of a cautionary tale in TikTok Shop operator communities: a brand hits $500,000 in monthly affiliate GMV. The founder is posting about it. The agency is taking credit for it. Then, when the actual P&L is run, total costs come in at roughly $475,000. That is not $25,000 in profit — it is $25,000 before overhead, before team salaries, before the software stack that keeps the operation running.
The math is not hypothetical. Multiple 2026 operator guides and agency analyses have documented this exact pattern. When you stack COGS, TikTok’s referral fee, payment processing, affiliate commissions, shipping and fulfillment, returns, samples sent to creators, and ad spend on Spark Ads that amplified the affiliate content, total selling costs for affiliate-driven orders routinely land between 35% and 55% of revenue — with the higher end common in categories like beauty and fashion where commission rates and return rates run high simultaneously.
Why GMV Gets Celebrated Anyway
The reason GMV dominates is partly structural. TikTok’s Seller Center surfaces GMV prominently. Affiliate dashboards report it. Creator partnerships are often measured by the GMV they drive. Even TikTok’s own promotional materials for sellers frame success in GMV terms. The entire surrounding ecosystem — agencies, software vendors, creator networks — uses GMV as the common currency of performance.
There is also a psychological component. GMV is a vanity metric with real narrative power. It is easy to share, easy to understand, and easy to use when talking to investors or partners. Contribution margin per SKU, adjusted for returns, after platform fees, is none of those things. But it is the only number that actually tells you whether the business is working.
The Affiliate-Specific Complexity
What makes TikTok Shop affiliates particularly difficult to profit-track is that costs arrive at different times and through different mechanisms. Commissions are deducted from settlements. Platform fees are applied at the transaction level. Return costs show up weeks later, sometimes after commissions have already partially cleared. Spark Ad spend is managed separately. Sample costs are often not tracked in the same system as order revenue at all. The result is that no single report tells you what an affiliate-driven order actually cost — you have to build that view yourself.
That is what this framework is designed to help you do.
The Real Cost Stack: What You Actually Pay Per Affiliate-Driven Order
Before you can manage an affiliate program for profit, you need an accurate picture of what each order costs. Not an estimate. Not a rounded approximation. A line-by-line accounting of every dollar that leaves the business per unit sold through an affiliate.
The Seven Cost Categories
For a standard affiliate-driven TikTok Shop order in 2026, the cost stack breaks into seven distinct categories:
- Cost of Goods (COGS): Product cost, packaging, and inbound freight to your warehouse or 3PL. For most physical product brands on TikTok Shop, this runs 30–45% of selling price. Products under $20 tend toward the higher end of that range relative to price; higher-ticket items often have more room.
- TikTok Referral/Platform Fee: In the U.S. market in 2026, this is typically around 6% of GMV, though it varies by category. Some categories see higher rates, and fee structures have shifted upward in recent years as TikTok has moved toward monetizing the platform more aggressively.
- Payment Processing: Standard 2–2.5% for most payment methods. Small in isolation, but material when stacked with everything else.
- Affiliate/Creator Commission: The most variable line item. Open collaboration baseline rates typically run 10–15%. Targeted creator deals range from 15–25%, with some aggressive launch campaigns and top-creator arrangements reaching 30–50% on specific SKUs. This is also the line item that most operators treat as the entire cost of the affiliate channel — which is the first major error.
- Shipping and Fulfillment: Includes outbound shipping, packing labor, and if using TikTok’s Fulfilled by TikTok (FBT) service or Shop Fulfillment Program (SFP), the associated fees. In many configurations, this lands at 8–12% of order value, with the SFP shipping fee alone adding around 6% in some U.S. categories.
- Returns and Refunds: Both the direct cost of the returned product and the operational cost of processing returns. More on the commission interaction with returns in a later section — the effective cost impact is almost always larger than operators assume.
- Amortized Sample and Seeding Costs: The cost of free product sent to creators, divided across the total orders those creators generate. This is real acquisition cost, and it belongs in the per-unit economics calculation.
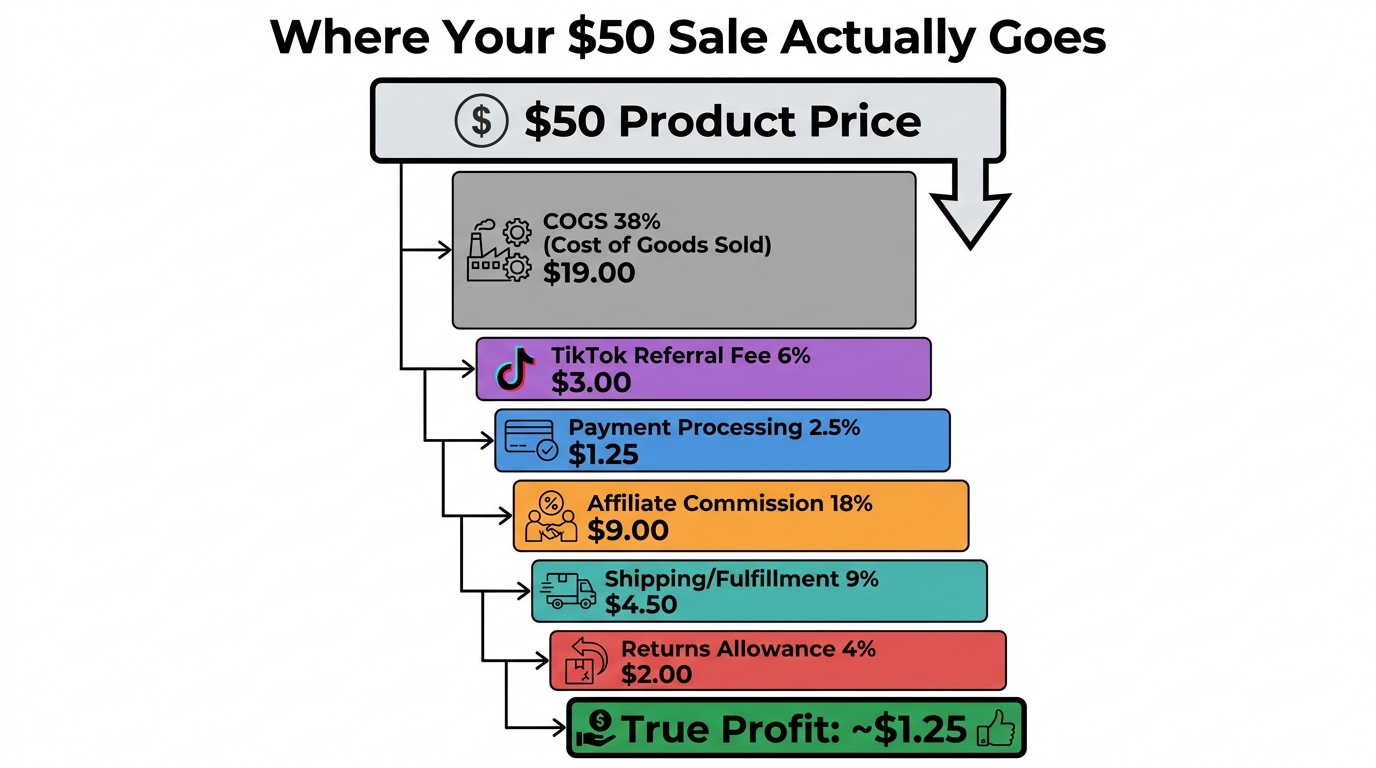
Working the Math on a Real Example
Take a $50 skincare product. COGS is $15 (30%). TikTok referral fee: $3 (6%). Payment processing: $1.25 (2.5%). Affiliate commission at 18%: $9. Shipping and fulfillment: $5 (10%). Returns allowance at 5% of orders: $1.25. Amortized sample cost: $0.50 per unit sold (based on 100 units seeded, 200 orders generated). That is $35 in total variable costs against a $50 sale price — leaving $15, or 30%, as gross contribution margin before overhead.
That 30% contribution margin sounds healthy until you remember that overhead — the affiliate manager’s time, the software, the customer service team handling inquiries, the product development pipeline — also needs to be covered. For most mid-market brands, overhead consumes another 15–20% of revenue, leaving true net profit at 10–15% in a well-run program. Poorly structured programs land at 0–5%. Programs chasing volume with inflated commissions and ignored return rates can easily go negative.
Why the Stack Changes by Category
These numbers are not uniform across product categories. Beauty and personal care products tend to carry higher affiliate commission expectations (sometimes 20–30%) and moderate return rates. Fashion and apparel carry lower commissions but return rates of 20–30% or more, which, as we will cover later, dramatically changes the effective cost of commissions. Electronics and higher-ticket items have thinner initial commission pressure but much higher absolute return cost exposure. Understanding your specific category’s cost profile is not optional — it is the foundation of the entire profit-first framework.
Building Your Per-SKU Profit Model Before You Recruit a Single Creator
The single most common sequencing error in TikTok Shop affiliate programs is this: operators recruit creators, set a commission rate, start sending samples, and then — weeks or months later — try to figure out whether the program is actually making money. By then, they have committed to commission rates in the TikTok Seller Center (which can only increase, not decrease, once set), sent out hundreds of sample units, and created content expectations with creators they now need to manage.
The profit-first approach inverts this sequence entirely. You build the per-SKU model first. Then you recruit.
The Pre-Launch SKU Profitability Screen
For every SKU you intend to run through an affiliate program, you need to answer five questions before listing it:
- What is the maximum affordable commission rate? This is calculated as: (Selling price − COGS − platform fees − fulfillment costs) × your target contribution margin %, then expressed as a percentage of the selling price. If that number is 14%, your maximum affordable commission in an open collaboration is 14%. Any creative or competitive pressure to go higher needs to be offset by a corresponding reduction in another cost line — usually COGS, through renegotiating with suppliers.
- Does this SKU have sufficient unit economics to absorb a return? If the product sells at $30 with $12 COGS and 15% commission, a single return (product arrives damaged and cannot be restocked) costs you $12 in product plus $4.50 in commission potentially already paid — against $30 in original revenue that is now reversed. For every 10 orders, if one returns, your effective margin per unit drops significantly. Low-margin SKUs and high-return-rate categories are a dangerous combination for affiliate programs.
- What is the minimum order volume at which this SKU becomes worth managing as an affiliate product? Not every product justifies the operational overhead of affiliate management. Some SKUs are better left as ad-driven or organic-only. Setting a minimum monthly affiliate order threshold — below which you retire the SKU from the affiliate program — keeps your focus on what’s actually moving and profitable.
- What sample quantity can you justify based on expected sales velocity? We will cover seeding ROI in detail, but the pre-launch model should include a seeding budget, not treat it as a separate, uncounted expense.
- What is the break-even commission rate at different volume tiers? If you process 50 affiliate orders per month, your overhead allocation per unit is different than at 500 orders per month. Modeling the break-even at multiple volumes tells you whether a tiered commission structure (lower rates at lower volumes, modestly higher at higher volumes) makes economic sense for this specific SKU.
Practical Tooling for the Per-SKU Model
You do not need expensive software for this. A well-constructed spreadsheet — with columns for selling price, COGS, each fee category, commission rate (variable), return rate assumption, and resulting contribution margin — gives you everything you need. The important discipline is updating the model monthly with actual data, not just leaving the pre-launch assumptions in place indefinitely. Real return rates, real shipping costs, and real fulfillment performance will diverge from your assumptions, and the model needs to track reality.
Several TikTok Shop analytics platforms now offer per-SKU profit dashboards that pull live fee and return data directly from Seller Center. These are worth the subscription cost for any brand running more than 10–15 active affiliate SKUs, if only because the manual tracking burden at that scale becomes a liability in itself.
Open Collaboration vs. Targeted Plans: A Strategic Decision, Not a Default
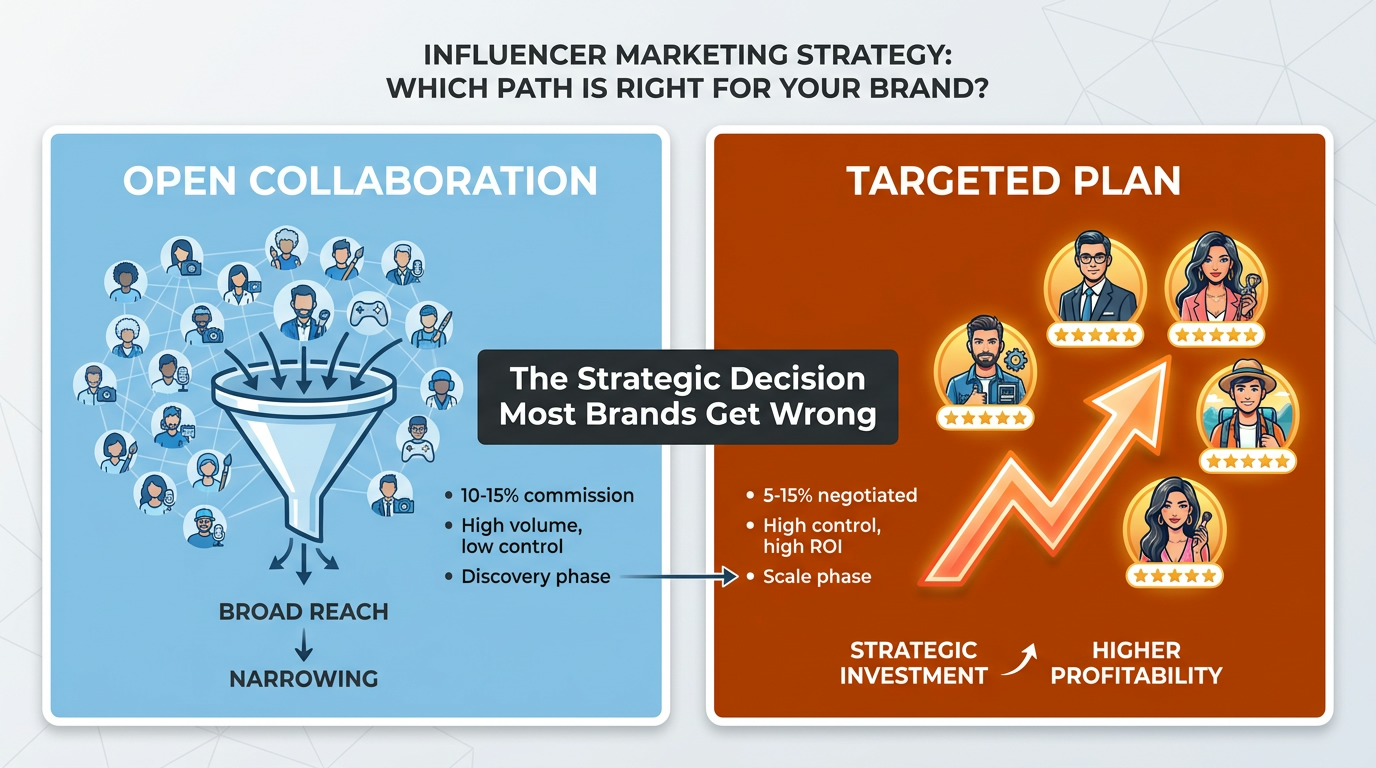
TikTok Shop’s affiliate infrastructure gives operators two primary collaboration structures: Open Collaboration and Targeted Plans. Most operators treat the choice between them as an afterthought — defaulting to Open Collaboration because it is easier to set up, and occasionally adding a targeted deal when a creator asks for one. That is backwards.
The choice between Open and Targeted structures is the most consequential architectural decision in your affiliate program, and it should be driven by where you are in your product lifecycle, what your margin model supports, and what you are actually trying to accomplish.
Open Collaboration: Volume, Discovery, and the Cost of Chaos
Open Collaboration lists your product in TikTok’s creator marketplace, where any eligible creator (generally requiring at least 1,000 followers, depending on region and category) can pick up your product and start promoting it. You set a base commission rate, optionally add a tiered volume bonus structure, and creators self-select.
The economic case for Open Collaboration is volume and discovery. At low marginal cost to you — mainly the time to set up the listing — you can have hundreds of creators producing content about your product. If even a handful produce high-performing videos, the resulting organic traffic and affiliate-driven orders can deliver significant returns.
The margin risk is that Open Collaboration, by definition, removes control over which creators promote you. Creators with poor engagement rates, mismatched audiences, or content quality that clashes with your brand positioning will pick up your product and produce content you may not want associated with it. More importantly, commission rates set in Open Collaboration are public and sticky. TikTok’s platform rules mean rates can only be increased — not decreased — once the 30-day lock period has been triggered. Setting an Open Collaboration rate too high in an effort to attract creators locks you into an unsustainable cost structure.
The right use case for Open Collaboration: early-stage discovery, when you need data on which types of creators and content angles convert for your product. Treat it as a paid research exercise with a strict budget ceiling, not as your permanent channel architecture.
Targeted Plans: Control, Relationships, and the Path to Sustainable Margins
Targeted Plans allow you to invite specific creators and negotiate individual commission rates, typically in the 5–15% range for high-volume or well-established creators. You can offer product samples, negotiate deliverable expectations, and structure the relationship as a genuine partnership rather than a transactional marketplace arrangement.
The economic case for Targeted Plans is margin control and relationship depth. A creator who has been invited, given dedicated support, and structured into a consistent posting cadence is fundamentally different from a marketplace creator who grabbed your product once and moved on. The former becomes a compounding asset — their existing content keeps generating orders, they bring familiarity with your product that improves future content quality, and the relationship gives you leverage to optimize commission rates over time as you bring them more volume and support.
The investment case: Targeted Plans require actual relationship management. You need a system for identifying, vetting, outreaching to, onboarding, and maintaining creator relationships. That operational overhead only pays off if the volume from each creator justifies the time invested. Which brings us to the creator tiering system.
Using Both Structures Strategically
The most effective programs in 2026 use both structures in sequence. Open Collaboration functions as a discovery and testing funnel — you run it with a capped commission rate that your per-SKU model confirms is affordable, watch for creators who perform above average, and then invite those creators into Targeted Plans with better terms and deeper support. Open Collaboration becomes your top-of-funnel. Targeted Plans become your profit engine.
This approach also means you are not dependent on either structure alone. If a key creator in your Targeted Plan goes dormant, your Open Collaboration tier continues generating data and orders while you recruit replacements.
The Creator Tiering System That Protects Your Margins

Not all creators should be managed the same way. Not all creators should receive the same commission rate. Not all creators justify the same investment of samples, time, and support. A tiering system formalizes these distinctions — and the margins it creates are not small.
The Three-Tier Architecture
A functional TikTok Shop creator tier structure for a mid-market brand typically looks something like this:
Tier 1 — Open Affiliates: The broad base. These are creators who found your product through Open Collaboration, have attempted one or more posts, and generated at least some sales. You have not personally reached out to them. Commission rates are whatever you have set in your Open Collaboration listing — typically 10–12% in a margin-conscious program. You send no samples to this tier proactively. You monitor performance monthly and flag anyone who breaks through to meaningful volume.
Tier 2 — Mid-Tier Partners: Creators who have demonstrated consistent sales from your product over 30–60 days, typically generating at least $500–$2,000 per month in affiliate GMV. You have invited these creators into a Targeted Plan, raised their commission modestly to 15–18%, and begun providing product samples and creative briefs. You check in with this group monthly. The investment here is modest but deliberate — the goal is to identify which of these creators has the potential to move to Tier 3.
Tier 3 — Anchor Creators: Your five to eight highest-performing, longest-tenured creator partners. These creators consistently generate meaningful GMV for your products, have demonstrated staying power over at least 90 days, and have an audience that clearly resonates with your product category. Commission rates in this tier run 20–25%, potentially with performance bonuses above defined GMV thresholds. You provide exclusive early access to new products, co-creation opportunities, and priority support. You check in with this group weekly.
The Financial Logic of Tiering
The reason tiering matters financially is that it concentrates your highest-cost investments — time, samples, elevated commissions, support infrastructure — on the creators who generate the most revenue and where the returns on those investments are therefore highest. Giving every creator in your Open Collaboration 20% commissions and a box of free product is the equivalent of running a loyalty program with no eligibility criteria — you are paying loyalty-tier costs for transactional-tier relationships.
Well-designed tiering also creates natural incentives. Creators who understand the tier system and what it takes to move up have a reason to invest more consistently in promoting your product. The promise of moving from 12% to 18% plus sample support is a meaningful incentive for a creator who is already generating $1,000/month from your products.
Creator Health Rating and TikTok’s Own Qualification Logic
It is worth understanding that TikTok itself applies qualification logic to the creator-product relationship through mechanisms like the Creator Health Rating (CHR) and Promotion Performance Score (PPS). These internal scores influence which products a given creator can promote and to what scale. When you are building your tier system, the creators who rise to Tier 3 are almost certainly those with strong internal platform scores — which means they have compounding platform-side advantages that amplify the impact of your investments in them. Prioritizing creators who the platform already trusts is not just a relationship decision — it is an algorithmic one.
Product Seeding ROI: Running Sample Budgets Like a Finance Team
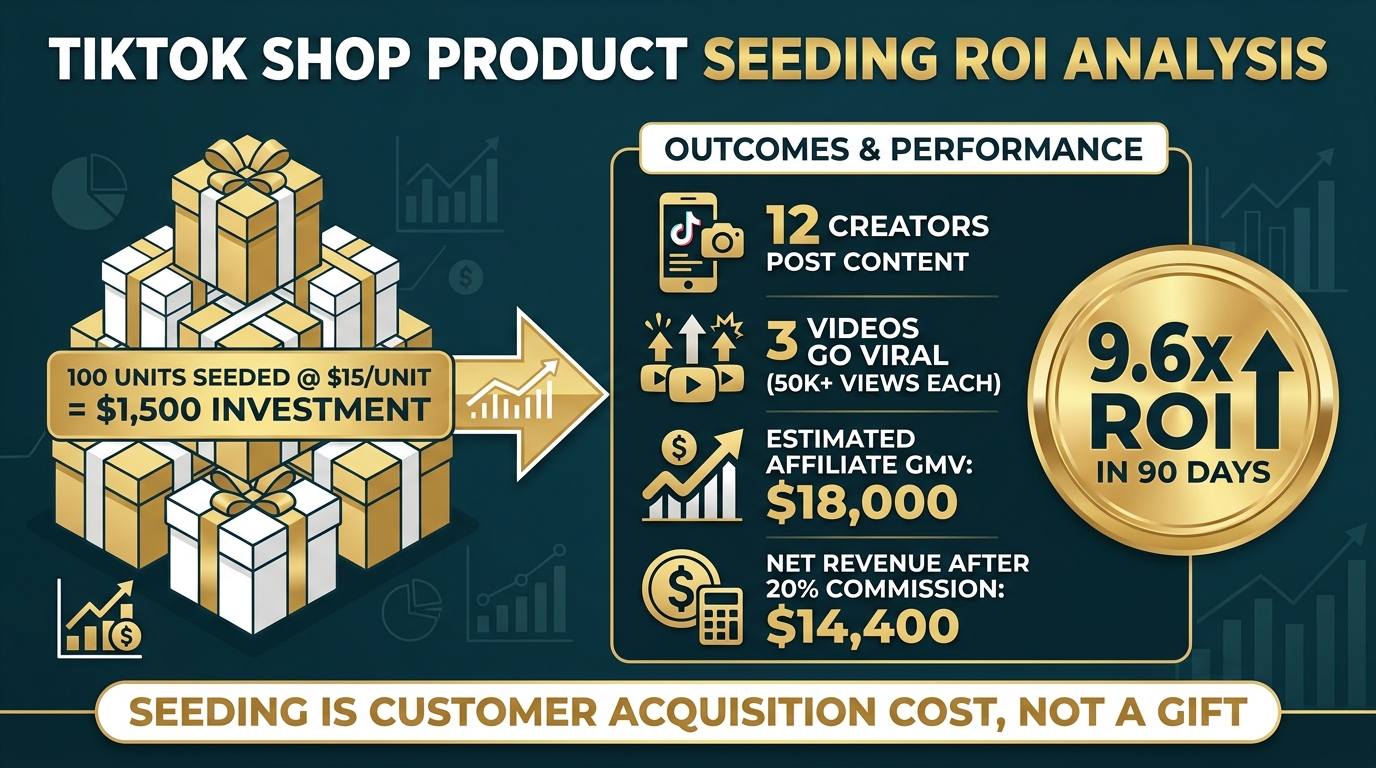
Product seeding — sending free units to creators without requiring guaranteed deliverables — is not a marketing expense. In a profit-first framework, it is customer acquisition cost (CAC), and it needs to be treated with the same rigor you would apply to any paid acquisition channel.
The widespread failure to track seeding ROI properly is one of the largest sources of invisible cost in TikTok Shop affiliate programs. Brands send hundreds of units over the course of a quarter, never fully account for those costs in their affiliate economics, and therefore systematically overstate how profitable their affiliate-driven orders actually are.
The Unit Economics of Seeding
Per-sample cost for TikTok Shop affiliate seeding in 2026 typically runs $15–$75, depending on the product — this includes product COGS, packaging, and outbound shipping to the creator. For a brand running a launch campaign of 50–100 creators, that represents an upfront investment of $750–$7,500 before a single order is placed.
The ROI calculation is straightforward but requires honest assumptions. If you seed 100 units at $15 each ($1,500 total investment), and those 100 creators generate a combined 300 orders at $50 average order value ($15,000 GMV), with a 20% commission paid ($3,000) and net contribution after other costs of roughly $6,000 — your seeding investment returned $6,000 on $1,500 deployed, or a 4x return. If only 20 of those 100 creators actually post, and only 3 videos generate meaningful views, the math changes substantially.
Industry benchmarks suggest brands using systematic seeding on TikTok Shop report roughly 3x ROI on samples within 90 days once an adequate base of content has been created and the algorithm has had time to amplify top performers. That benchmark is directionally useful but should not be treated as a floor — your specific category, commission rate, and product price point will all shift the number significantly.
How to Treat Seeding as a Budget Line, Not a Slip
A profit-first approach to seeding requires three operational disciplines:
Set a monthly seeding budget and stick to it. Decide in advance how many units you are prepared to seed per month across all tiers. Calculate the total cost using fully-loaded per-unit COGS plus shipping. Put that number in your P&L as an explicit line item, not as a miscellaneous cost buried in COGS or shipping. Typically, a brand running a mature affiliate program should budget seeding at 2–5% of monthly affiliate program costs — enough to sustain pipeline development without cannicalizing margin.
Track post-seeding performance by creator cohort. When you seed a batch of 30 creators, tag them as a cohort and track orders attributed to that cohort over the next 60–90 days. This gives you the actual return on each seeding investment, by creator type, by product, and by season. Over time, you will develop accurate seeding ROI benchmarks for your specific program — which are far more actionable than industry averages.
Gate sample investment by tier. Tier 1 Open Affiliates receive no proactive samples. Tier 2 creators receive samples upon invitation — one unit, tracked. Tier 3 Anchor Creators receive early access to new products, but those are documented as investments in a relationship that generates known revenue. The tighter your sample gatekeeping, the cleaner your acquisition cost picture.
The Conversion Rate Reality
One number that significantly affects seeding ROI is the rate at which seeded creators actually post content. In practice, depending on category and how well you target the seeding, organic posting rates for seeded products run anywhere from 20–60%. That means 40–80% of your seeded units generate zero revenue. This is expected — not every creator will connect with every product — but it needs to be priced into your seeding budget. Your ROI calculation must assume non-conversion, not model everything as if every creator posts a viral video.
Returns, Clawbacks, and the Hidden Tax on High-Ticket SKUs
Returns are the sleeper issue in TikTok Shop affiliate economics. They are well understood in the abstract — of course returns reduce profit — but their interaction with affiliate commission structures creates a compounding cost that most operators significantly underestimate.
How Returns Change the Commission Math
The core mechanism is this: affiliate commissions are paid as a percentage of revenue. Returns reduce revenue. But returned orders may have already triggered partial commission payments, and the timing of clawbacks is imperfect. More importantly, when a product is returned, the revenue disappears but not all associated costs do — COGS for damaged units cannot be restocked, shipping costs on both legs are sunk, and processing costs are fixed.
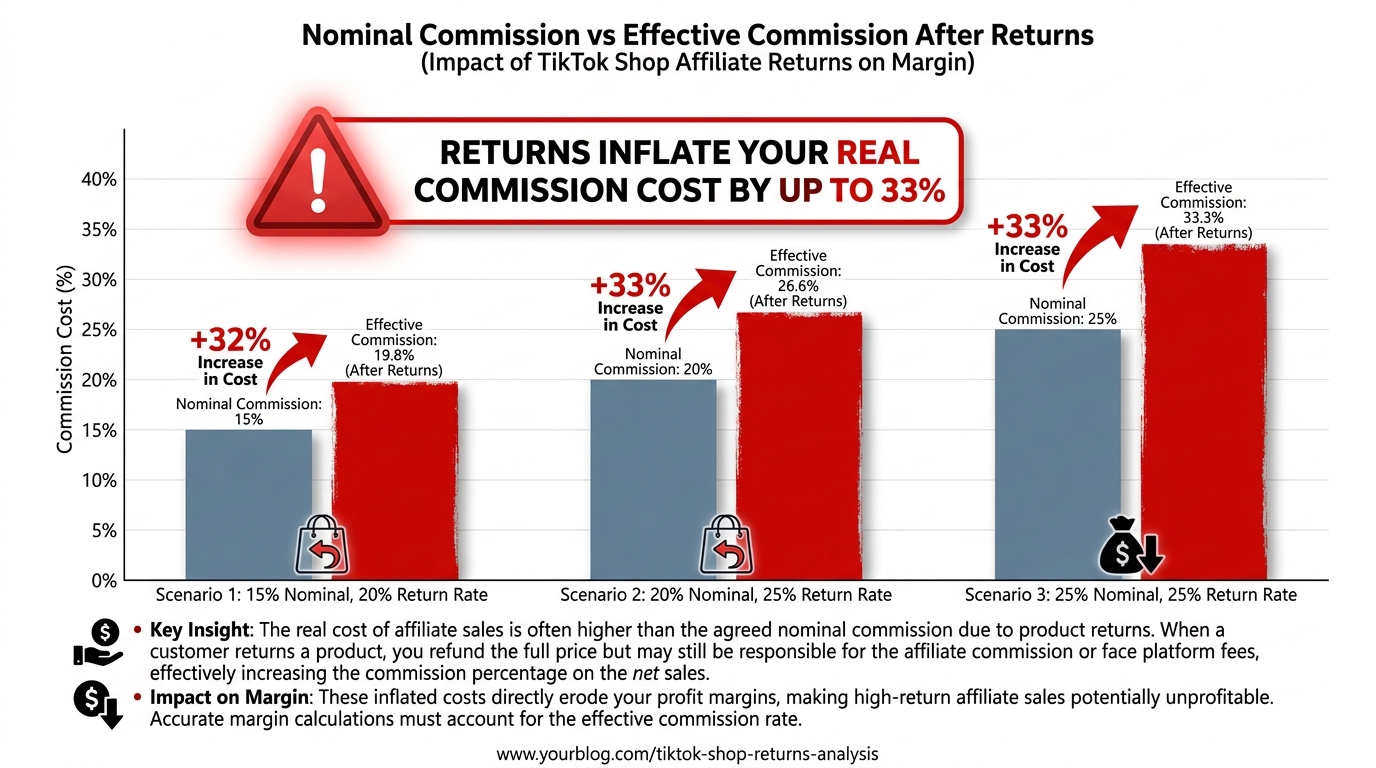
The effective commission rate on retained revenue — the revenue you actually keep after returns — is therefore always higher than the nominal commission rate you set. The formula is simple: if your nominal commission rate is 20% and your return rate is 25%, your effective commission rate on retained orders is approximately 26.6%. At a 20% return rate with a 15% commission, you are paying approximately 18.75% on net revenue. At a 25% nominal commission with a 25% return rate, the effective rate climbs toward 33%.
This is not a rounding error. For a high-commission product in a high-return category, the difference between stated and effective commission cost can be 8–12 percentage points of margin — enough to turn a modestly profitable program into a loss-generating one.
High-Ticket Products Deserve Specific Scrutiny
The commission-return interaction is most damaging for higher-ticket SKUs, for two reasons. First, the absolute dollar exposure per return is larger — a returned $120 item with $40 COGS represents far more real cost than a returned $25 item with $8 COGS. Second, return rates on higher-ticket items purchased through impulse-friendly content platforms like TikTok can run higher than in other channels, because the discovery mechanism (seeing a product in a 30-second video) does not always accurately set expectations about the actual product experience.
Before running any high-ticket SKU through a TikTok Shop affiliate program, model the effective commission cost at realistic return rates for your category. If a $99 skincare device has a realistic TikTok-channel return rate of 20–25% based on similar products in your segment, and you are paying 20% nominal commission, your effective commission on net retained revenue is approaching 27%. Combined with COGS of 35% and platform fees of 6%, you may have already used 68% of revenue before shipping and overhead — making the product category unsuitable for affiliate-driven sales at standard commission rates without a pricing or margin adjustment.
Managing Return Rates Proactively
The profit-first approach to returns is not passive. There are several levers operators can pull to reduce affiliate-driven return rates specifically:
- Brief creators on accurate product representation. The number one driver of affiliate-driven returns is content that oversells or misrepresents the product. Providing detailed creative briefs, accurate usage demonstrations, and clear product descriptions that creators can draw on reduces the expectation gap that causes returns.
- Segment high-return creators out of active programs. Once you have enough data, you can identify creators whose content consistently drives higher-than-average return rates for your products. Moving these creators out of active collaboration — even if their raw GMV numbers look good — protects your margin.
- Monitor return rate by SKU, not just by total program. Some SKUs in your catalog may have structurally higher return rates than others. Identifying these and either improving product quality, adjusting content guidelines, or removing them from the affiliate program protects your overall program economics.
Commission Architecture: How to Structure Rates That Scale Sustainably
Commission rate setting is the most consequential configuration decision in your TikTok Shop affiliate program, and it is one of the few decisions the platform makes difficult to reverse. Given that reality, it deserves more deliberation than most operators give it.
The Floor, the Ceiling, and the Negotiation Zone
Every SKU in your affiliate program should have three defined commission parameters before any creator relationship is established:
The floor rate is the minimum commission at which you can acquire customers profitably through affiliates, based on your per-SKU model. It is not a number you share — it is the internal guardrail that tells you when a deal is no longer worth taking.
The ceiling rate is the maximum commission you are willing to pay to a Tier 3 anchor creator for exceptional performance, inclusive of any volume bonuses. This should typically be set at the per-SKU model’s maximum affordable commission minus a buffer for cost variance and overhead. For most products in well-managed programs, this lands somewhere between 22–28% of selling price.
The negotiation zone is the range between your Open Collaboration base rate (set at or near the floor) and your maximum targeted rate. This is the space in which you structure Tier 2 and Tier 3 commission conversations. Having explicit numbers in this range prevents you from making commission concessions under pressure that you have not modeled.
Tiered Commission Structures Inside Open Collaboration
TikTok’s Seller Center allows operators to set up to two tiers of commission within the Open Collaboration structure, with higher rates triggered above defined order volume thresholds. This mechanism can be useful for driving higher-performing creators to push volume — but the rules around it require careful handling.
Once a tiered commission structure is activated and thresholds are set, they cannot be changed. Rates can only increase, not decrease. And switching back to a flat commission structure after activating tiering triggers a 30-day lock-in. The practical implication: model the economics of every tier you are considering before activating, not after. The flexibility is deliberately limited, and using it carelessly creates permanent cost commitments.
Handling Commission Requests From Creators
As your program grows, creators — especially those whose content is performing well — will ask for higher commission rates. This is normal and reasonable. The profit-first approach to these conversations has three steps:
First, check the request against your per-SKU model. What does the model say is the maximum affordable rate for this specific product? If the creator’s request is within that range, there is room to discuss. If it is above, the conversation needs to include a price review — because the only way to sustainably pay higher commissions is to either raise prices or reduce costs elsewhere.
Second, tie commission increases to volume commitments where possible. Rather than flat rate increases, offer tiered arrangements where the higher rate applies once a monthly GMV threshold is reached. This aligns incentives and ensures you are paying premium rates only when the volume justifies them.
Third, document every commission agreement. This sounds obvious, but creator commission arrangements that exist only in DMs or emails create reconciliation nightmares at settlement time. Every agreement should be formalized through the Seller Center’s targeted plan structure, with any side agreements clearly documented and cross-referenced.
Operational Systems That Make Affiliate Profit Measurable
A profit-first affiliate program is not just a financial model — it is an operational system. The math only matters if you have the infrastructure to track it consistently, act on what you find, and maintain discipline across a program that may involve hundreds of creators and thousands of SKU-level transactions per month.
The Minimum Viable Tracking Stack
You do not need enterprise-scale infrastructure to run a measurable affiliate program. You do need, at minimum:
A per-SKU profit tracker updated at least monthly with actual fee rates, return rates, and commission averages. This is your single source of truth for whether each product in your affiliate program is making money. It can be a spreadsheet if your SKU count is manageable; dedicated analytics software if it is not.
A creator performance register that tracks, for each active creator: GMV generated (by month), orders generated, return rate, commission paid, and tier status. This register is the operational foundation of your tiering system and makes promotion, demotion, and retirement decisions data-driven rather than relationship-driven.
A seeding log that records every unit sent to every creator, the date sent, the product, the COGS value, and whether the creator subsequently posted. This log makes seeding ROI calculable and exposes patterns — such as which creator profiles have the highest conversion from seeded product to posted content.
A monthly affiliate P&L summary that consolidates all of the above into a single view: total affiliate GMV, total variable costs by category, contribution margin by tier, overhead allocation, and net profit. Reviewing this monthly — and comparing it to the previous month and to your original model — is the discipline that keeps the program honest.
Connecting Seller Center Data to Your Profit Model
TikTok’s Seller Center provides order-level data, commission data, return data, and fee data, but not in a form that is immediately ready for profit analysis. Exporting this data and reconciling it against your model is a routine task — how frequently you need to do it depends on your order volume. At $50,000/month in affiliate GMV, monthly reconciliation is sufficient. Above $200,000/month, weekly reconciliation surfaces issues faster and gives you more time to respond to cost surprises before they compound.
Several third-party analytics platforms have built integrations with TikTok Shop Seller Center that automate much of this reconciliation. For larger programs, the time savings from these tools — typically $50–$300/month depending on the platform — pay for themselves quickly. The key is not which tool you use but that you establish the reconciliation discipline and maintain it.
Weekly Rhythm for the Affiliate Manager
In a profit-first program, the affiliate manager’s weekly rhythm should include: reviewing the creator performance register for anyone whose return rate or GMV trend warrants a tier change, checking the seeding log for any creators who received product more than 30 days ago and have not posted, flagging any new Open Collaboration performers for Tier 2 invitation, and reviewing Seller Center for any commission or fee changes that would affect the per-SKU model. This is not a heavy workload — it is maybe two to three hours per week for a medium-sized program — but it is consistent attention to the financial fundamentals rather than spending all energy on creator relationship management while the underlying economics drift.
When to Kill a Creator Relationship (and How to Do It Without Drama)
One of the least discussed but most practically important aspects of profit-first affiliate management is knowing when to exit a creator relationship. Maintaining underperforming creator relationships has both direct costs — samples, management time, elevated commissions that are no longer earning their keep — and opportunity costs, because the attention and resources invested in a declining creator relationship are not available for recruiting and developing new performers.
The Four Exit Triggers
There are four situations where a creator relationship should be restructured or ended:
Sustained GMV decline without explanation. If a Tier 2 or Tier 3 creator’s monthly GMV has declined for three consecutive months and there is no clear, addressable reason for the decline — not seasonality, not a product issue, but an audience or engagement change on the creator’s side — the economics of maintaining a high-commission targeted arrangement no longer hold. The appropriate move is to transition the creator back to Open Collaboration terms rather than maintaining a negotiated rate for performance that is no longer there.
Return rates materially above program average. A creator whose orders return at 30–40% while your program average is 12–15% is generating apparent GMV while actually destroying margin. The content is creating expectations the product is not meeting. This is a data-driven termination trigger, not a subjective quality call.
Content that creates compliance or brand risk. TikTok has specific policies around affiliate content — prohibited claims, disclosure requirements, restricted product categories. A creator who routinely pushes content that risks violations creates regulatory and account-level risk that no commission rate justifies.
Non-responsiveness over a defined period. A creator who has not posted in 60+ days, does not respond to outreach, and has no recent activity should be moved to inactive status and their commission arrangement reviewed. Holding commission slots in your targeted plan for dormant creators prevents you from offering those terms to active performers.
The Mechanics of Exiting Gracefully
Ending or restructuring a creator relationship on TikTok Shop does not need to be confrontational. The most effective approach is transactional and transparent: thank the creator for their work to date, explain that you are restructuring the program to focus resources on the highest-performing partnerships, and inform them that they will be transitioned to Open Collaboration terms going forward. Most creators understand this — and many will use the transition as motivation to push performance back up, potentially earning their way back into a targeted arrangement.
What you want to avoid is the all-too-common pattern of simply going silent on underperforming creator relationships — neither ending the arrangement nor investing in it, but allowing it to drift while still paying elevated commission rates on whatever sporadic orders it generates. This is the worst of both outcomes: you are paying targeted-plan prices for open-collaboration results.
Building the Affiliate Calendar: Quarterly Planning for Profit-Positive Programs
A profit-first affiliate program is not managed week to week. It is planned quarterly — with a clear view of which SKUs are entering and exiting the program, what the seeding budget is, how many creator tier changes are planned, and what the target contribution margin is for the quarter.
The Quarterly Planning Cadence
At the start of each quarter, the affiliate program review should cover four areas:
SKU roster review. Which products are being added to the affiliate program? Which are being retired? Every addition requires a completed per-SKU profit model. Every retirement requires a documented reason — return rate too high, COGS increase making the commission math untenable, or simply low organic interest from creators. Maintaining discipline here prevents catalog bloat, which is one of the most common sources of management complexity and hidden cost in larger programs.
Creator tier review. Which Tier 1 creators have earned promotion to Tier 2 based on the past 90 days of performance data? Which Tier 2 creators are ready for Tier 3 consideration? Which Tier 3 creators are underperforming against their commission cost and need to be transitioned down? Making these decisions on a quarterly cadence creates a predictable rhythm for both your team and for creators who understand the program.
Seeding plan. How many units will be seeded this quarter, across which products, to which creator profiles? What is the total dollar investment, and what is the projected ROI based on previous cohort data? How will you track performance against that projection?
Commission model review. Have COGS, platform fees, or fulfillment costs changed in ways that require commission rate adjustments? Has return rate performance changed in ways that affect the effective commission calculation? This quarterly review is where you catch drift in the underlying economics before it becomes a quarterly P&L surprise.
Seasonal Considerations for Affiliate Profit Management
TikTok Shop affiliate economics are not static across the calendar year. Q4 brings elevated order volumes, but also elevated return rates — particularly in categories associated with gift purchasing. Commission rates you set in September may be underpriced for Q4 volume but structurally sound for Q1. Build seasonal return rate assumptions into your quarterly model rather than using annual averages, and consider whether your commission structure needs seasonal adjustment to maintain target margins through high-return periods.
Conversely, Q1 often sees reduced creator activity and lower conversion rates as audiences recover from purchase fatigue. If your seeding program is running year-round, Q1 is often the highest ROI period to be investing in new creator relationships — competition for creator attention is lower, the content you help develop now will compound through the higher-volume quarters, and seeding costs are the same regardless of season.
Conclusion: The Profit-Positive Affiliate Engine — What It Actually Takes
Building a profit-first TikTok Shop affiliate program is not about being conservative with commissions or reluctant with creators. It is about knowing — with actual numbers — what every relationship in your program costs, what it returns, and whether that return justifies the investment. That knowledge is what separates operators who scale GMV while compressing margins from operators who build programs that generate real cash.
The core principles are straightforward, even if the execution requires discipline:
- Model before you recruit. Per-SKU profit math is not a post-launch review exercise. It is the prerequisite for every commission rate you set, every targeted plan you offer, and every sample you send.
- Treat seeding as CAC. Every unit sent to a creator is an investment with an expected return. Track it as such, gate it by tier, and measure actual cohort performance against expectations.
- Account for returns in your commission math. Nominal commission rates and effective commission rates are different numbers. The difference can be 8–12 percentage points in high-return categories. Manage the rate you actually pay, not the rate on the label.
- Use both collaboration structures strategically. Open Collaboration is your discovery and testing funnel. Targeted Plans are your profit engine. Running them as a system — with Open feeding Targeted — produces better creator relationships and better economics than either structure alone.
- Tier your creators and defend the tiers. The tiers exist to concentrate your highest investments on your highest performers. When they become social arrangements that protect underperformers from restructuring, they stop working financially.
- Build the operational systems before you need them. Per-SKU trackers, creator performance registers, seeding logs, and monthly P&L reviews are not bureaucratic overhead — they are the tools that make everything else measurable. Without them, profit management is guesswork with a dashboard.
TikTok Shop’s affiliate infrastructure in 2026 is genuinely powerful. The platform has scale, creator depth, discovery mechanics, and conversion rates that most other affiliate channels cannot match. The operators who benefit from those advantages most are not the ones who commit the most aggressively to creator spend — they are the ones who run the numbers carefully enough to know exactly how much creator investment their margins can support, and then build relationships that justify every dollar.
GMV is a story. Contribution margin is the truth. Build the program that tells the truth.