Every TikTok Shop seller has a version of the same problem. They spend hours scrolling competitor videos, watching trending hashtags, and trying to guess what product might catch fire next week. They rely on gut feel, trending sounds, and whatever sold well on Amazon six months ago. Then they wonder why their listings sit flat while someone else is moving 500 units of the same product category in a single afternoon of live shopping.
The guess-based approach isn’t just inefficient — it’s unnecessary. TikTok built a product intelligence tool directly into the Seller Center that surfaces demand signals, supply gaps, trending search terms, and even incentive rewards for sellers who act on the data. Most sellers either don’t know it exists or glance at it once and never return. That’s a significant competitive advantage being left in plain sight.
This guide goes deep on the Product Opportunities tool inside TikTok Seller Center. Not the 200-word overview you’ve already skimmed. The mechanics of each tab, how to interpret the signals correctly, what the reward programs actually pay out and how to qualify, how to turn research data into listings that score above 70 (the threshold below which TikTok’s recommendation engine ignores you entirely), and when native Seller Center data is enough versus when to layer in third-party tools.
By the end, you’ll have a repeatable research process built on platform data rather than scrolling and guessing — and a clearer picture of which product categories are generating the most real GMV on TikTok Shop right now.
What the Product Opportunities Tool Actually Is (And Why It’s Underused)
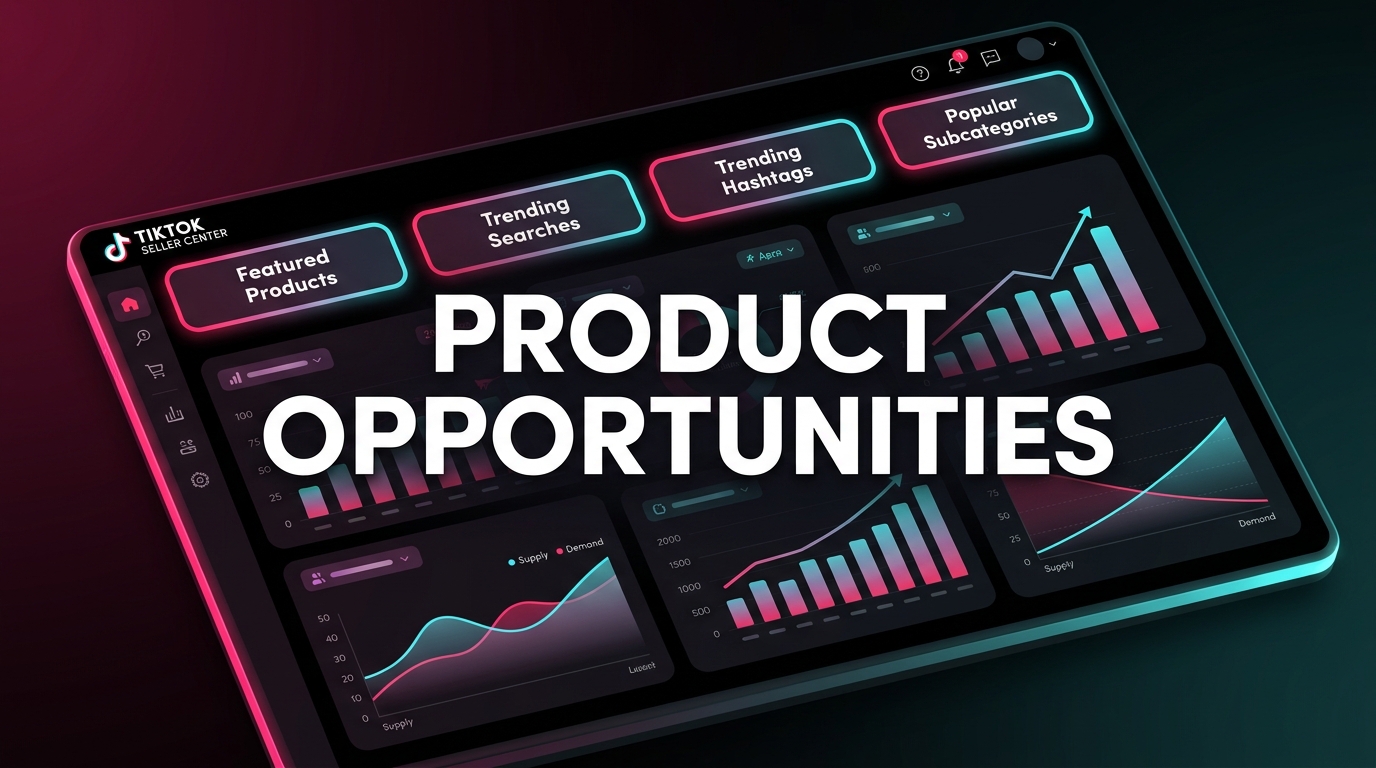
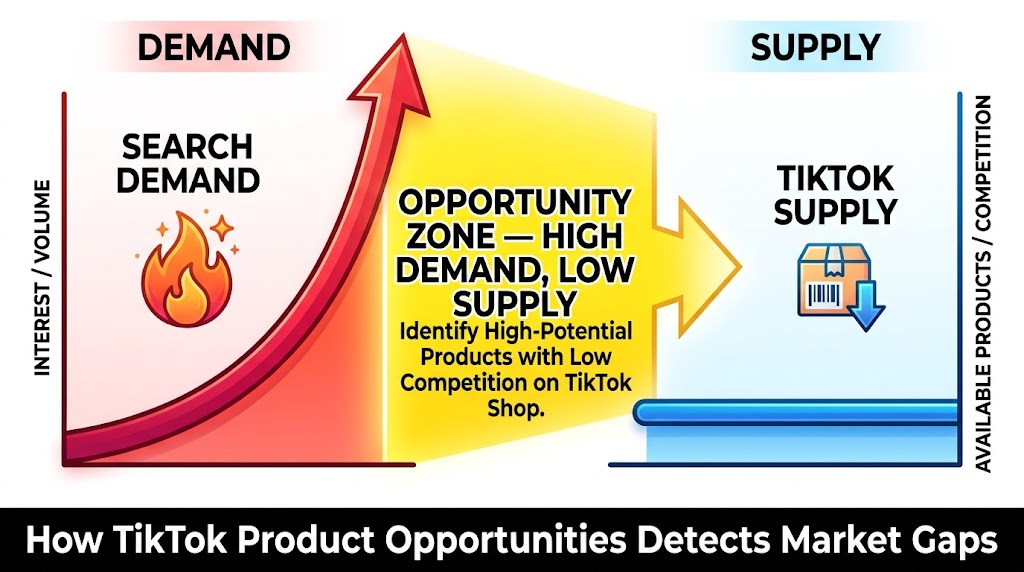
The Product Opportunities tool lives inside TikTok Seller Center at Products > Product Opportunities. It’s a free, native intelligence layer that TikTok built specifically to help sellers identify high-demand, under-supplied products — meaning items that buyers are actively searching for and purchasing on other marketplaces, but that have little to no competition on TikTok Shop itself.
That last part matters. The tool isn’t surfacing what’s trending on TikTok in a general content sense. It’s specifically analyzing the mismatch between what people are buying elsewhere and what’s available to purchase natively within TikTok Shop. That gap — high buyer intent, low TikTok supply — is the commercial signal that matters most for sellers trying to enter a category or expand their catalog.
The Core Problem It Solves
TikTok’s commerce ecosystem has a structural inefficiency. The platform has tens of millions of daily active users with strong purchasing intent, but product supply on TikTok Shop doesn’t always match what those buyers are searching for. Some categories are saturated while others have obvious demand with almost no sellers serving it.
Without a tool like this, identifying those gaps requires either expensive third-party subscriptions, hours of manual research, or sheer luck. The Product Opportunities tool compresses that research cycle dramatically — and it pulls from TikTok’s own first-party data, which is more accurate for TikTok-specific purchasing behavior than anything a third-party platform can estimate.
Why Most Sellers Skip It
The tool is genuinely underused for a few reasons. First, it requires logging into Seller Center specifically — many sellers manage their shops through mobile apps or third-party dashboards that don’t surface this data. Second, the tool’s output requires interpretation; it doesn’t tell you exactly what to sell, it surfaces signals that a trained eye learns to act on. Third, sellers who’ve tried it once and didn’t see an immediately obvious product to list often dismiss it as too vague.
That’s a mistake. The tool is a signal layer, not a “click here and get rich” button. Used correctly, it compresses weeks of product research into a manageable weekly workflow.
The Four Research Tabs: An Honest Breakdown
The Product Opportunities tool is organized around four distinct data surfaces, each measuring demand from a different angle. Understanding what each tab is actually measuring — and what action it’s designed to drive — is the key to using the tool correctly.
Tab 1: Featured Products
The Featured Products tab shows trending items from other online marketplaces — primarily Amazon, Walmart, and similar platforms — that are generating strong buyer demand but have low inventory or low seller competition on TikTok Shop. Think of it as a supply-gap scanner: TikTok is telling you that real buyers are purchasing this product category at volume, but not enough sellers on TikTok Shop are meeting that demand.
When you click on an individual opportunity in this tab, you get a detail view that includes:
- Market trend graphs showing the product’s demand trajectory over time
- Shoppable video data — how many creators are currently making content featuring similar products
- Matching criteria for existing products in your catalog (if any of your listings qualify)
- Eligible rewards — including impressions boosts and ad credits tied to the opportunity
The Featured Products tab refreshes quarterly to adjust for seasonal trends, but high-demand opportunities within the tab can update more frequently when significant market shifts occur. The practical action here is straightforward: if a product category appears in Featured Products and you have relevant inventory or sourcing access, adding it to your TikTok Shop catalog puts you in front of demonstrated demand with reduced competition.
Tab 2: Top Searched Keywords
This is arguably the most actionable tab for sellers who already have products listed. Top Searched Keywords shows high search-volume terms on TikTok with a key qualifier: the number of sellers offering products matching those searches is disproportionately low relative to search frequency.
These aren’t general trending terms. They’re buyer-intent keywords — the kind of searches people do when they’re ready to purchase, not just browsing content. Seeing “portable blender for smoothies” appear with high search demand and low product supply tells you something concrete: buyers are typing that into TikTok’s search bar, looking for something to buy, and not finding enough options.
The keyword list updates weekly, which means it’s relatively current. Sellers who check this tab regularly can identify emerging search patterns before they become obvious to the broader market. This data is also directly usable for listing optimization — the exact terms appearing in the Top Searched Keywords tab should be worked into product titles, descriptions, and attribute fields.
Tab 3: Trending Hashtags
Where the keyword tab measures search intent, the Trending Hashtags tab measures content momentum. It surfaces hashtags that are generating high view counts and — critically — high purchase behavior through TikTok Shop’s shoppable video infrastructure.
Not every trending hashtag translates to commerce. A viral dance trend might generate a billion views with zero product purchase intent. The Trending Hashtags tab specifically filters for hashtags where viewership correlates with buyer activity — where the content is driving clicks to product pages and completed checkouts, not just passive scrolling.
For sellers, this tab serves two purposes. It can inspire new product additions (if a hashtag related to a product category you don’t carry is converting strongly, that’s a catalog gap worth evaluating), and it can inform content strategy for products you already sell (creating videos tagged with high-converting hashtags in your category gets your shoppable content in front of proven buyers).
Tab 4: Popular Subcategories
The Popular Subcategories tab steps back to a category-level view, showing which product subcategories are experiencing the strongest sales growth on TikTok Shop — not which are already the largest by GMV, but which are growing fastest relative to their recent baseline.
This distinction matters. A massive category like Beauty & Personal Care might show up as high-GMV but the growth rate in a subcategory like “hair supplements” or “tinted moisturizer” might be accelerating faster than the broad category average. Popular Subcategories helps you find those pockets of acceleration before they peak.
This tab is most useful for sellers considering catalog expansion or new product lines. Rather than analyzing broad market data externally, you’re getting TikTok’s own internal view of which subcategories are building momentum on the platform — where the growth curve is pointing upward and where there’s still room to enter before the supply catches up to demand.
How to Read the Demand-Supply Gap Correctly
Every signal in the Product Opportunities tool points toward the same underlying concept: the gap between what buyers want and what sellers are providing on TikTok Shop. But reading that gap correctly — and knowing which gaps are actionable versus which are gaps for a reason — requires some nuance.
High Demand + Low Supply ≠ Automatic Opportunity
The tool will sometimes surface products that have high demand and low TikTok Shop supply because they’re genuinely difficult to sell on TikTok Shop — products with complex sizing requirements, products that are hard to demonstrate in short-form video, products with high return rates, or categories with regulatory constraints. A product can be popular on Amazon while being poorly suited to TikTok’s discovery-first commerce model.
The filter question to ask is: can this product demonstrate its value compellingly in under 10 seconds of video? Products that pass that test — skincare transformations, gadgets with an obvious visual payoff, food products with a satisfying texture or reveal — have a structural advantage on TikTok that makes the supply gap worth pursuing. Products that don’t pass it may have a supply gap for good reason.
Velocity and Trend Direction Matter More Than Snapshot Data
A product showing high demand today might be peaking rather than rising. The trend graphs within each Product Opportunities detail view are worth studying carefully. A consistent upward trend over 60 days suggests durable demand. A spike followed by a plateau might indicate a trend that’s already been captured by early movers. A product with modest but steadily climbing demand data is often a better entry point than a product that spiked two weeks ago.
Cross-Reference With Your Own Catalog Performance
TikTok’s Seller Center Analytics provides performance data for your existing listings — conversion rates, traffic sources, impressions. When a keyword from the Top Searched Keywords tab aligns with a product you already sell but aren’t ranking well for, that’s a listing optimization signal, not a new product sourcing signal. The same data can be used in two completely different ways depending on whether you already carry the relevant product.
Category Intelligence: Where the GMV Actually Is in 2026
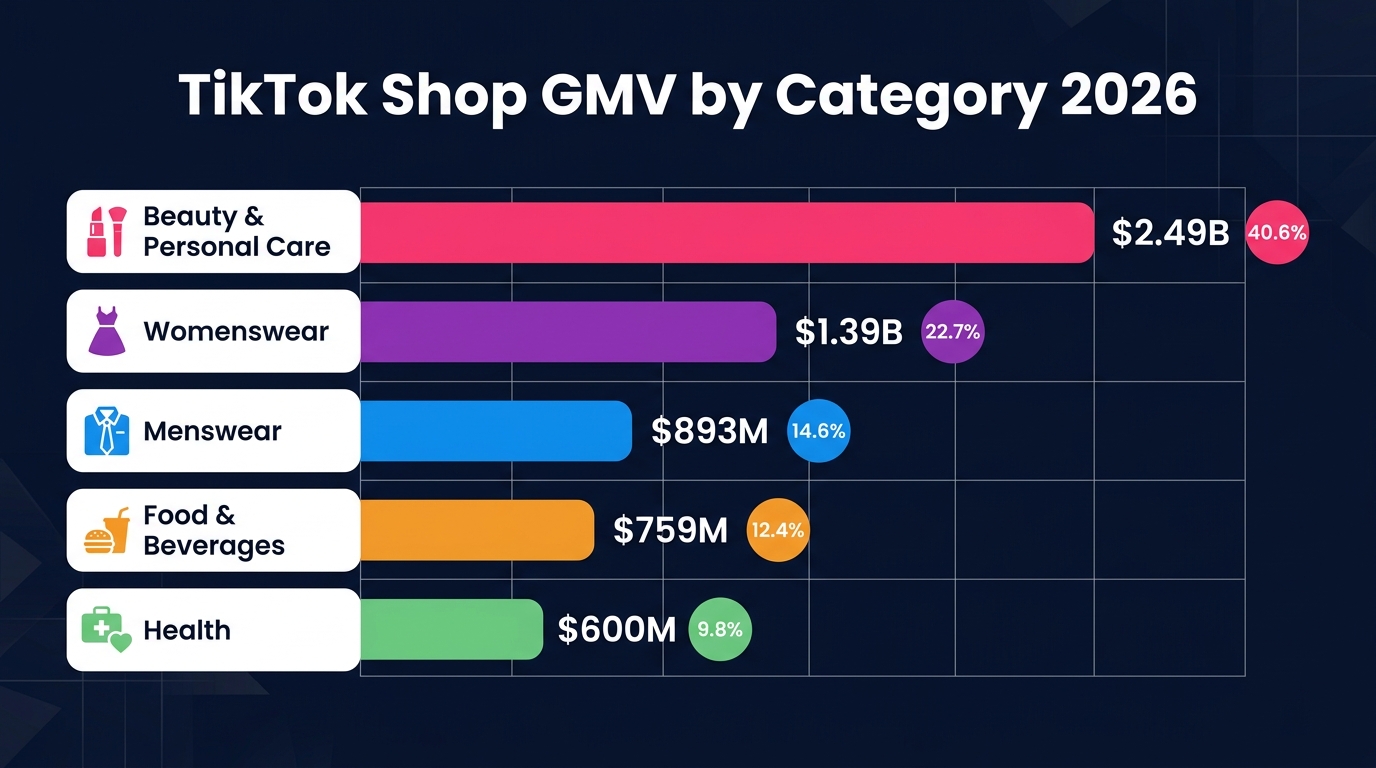
Understanding the macro category landscape helps contextualize what the Product Opportunities tool surfaces. When you see a beauty subcategory appearing in Popular Subcategories, you’re looking at a slice of a $2.49 billion category. When a home goods keyword shows up in Top Searched Keywords, you’re evaluating its position within a smaller but fast-growing segment. Category context shapes how aggressively to pursue any given signal.
Beauty and Personal Care: The Dominant Category
Beauty & Personal Care is the single largest category on TikTok Shop globally, generating $2.49 billion in GMV — approximately 22.5% of the platform’s total sales volume. This dominance is structural, not accidental. TikTok’s short-form video format is practically designed for beauty product demonstrations: before-and-after transformations, application tutorials, ingredient deep-dives, and “get ready with me” content all create immediate, visceral purchase intent.
The most successful beauty subcategories on TikTok Shop share a common trait: the product’s effect is visible within a short video window. Lash serums, tinted serums, pimple patches, hair oils, self-tanning drops — products where you can see the transformation happening or the application process is satisfying to watch.
For sellers evaluating beauty entries: the category’s scale means competition is intense at the top, but the Popular Subcategories tab regularly surfaces beauty niches that are accelerating faster than the category average, often in functional skincare ingredients (peptides, niacinamide, retinal formulations), scalp care, and barrier-repair products.
Womenswear and Fashion: High Volume, High Velocity
Womenswear and Underwear sits at $1.39 billion in GMV — 12.56% of total platform sales — with the highest store count of any category at 14,930 shops. The sheer number of sellers in fashion means the category is competitive, but TikTok’s content-first discovery model means that a well-styled video can drive sales for a product that would get buried in a search-sorted marketplace.
Fashion succeeds on TikTok through aesthetic storytelling rather than feature lists. Sellers who perform well in this category tend to invest heavily in creator partnerships and produce content that fits naturally into fashion content culture — outfit videos, styling challenges, seasonal transitions.
Menswear: The Underpriced Opportunity
Menswear at $893.54 million (8.06% of GMV) is notable for a different reason: it has significantly fewer sellers than Womenswear while generating comparable per-seller revenue. The menswear category on TikTok is still developing its content language — the “haul video” and “outfit of the day” formats that dominate Womenswear content are less established in men’s fashion, which means early movers who define content formats in this space have structural advantages.
Food and Beverages: The Fastest-Growing Sleeper
Food & Beverages at $759.84 million is one of the most interesting categories from a Product Opportunities standpoint. TikTok’s #FoodTok ecosystem is enormous — recipes, taste tests, “cooking hacks” content generates massive engagement — and that content-native demand hasn’t been fully captured by sellers offering purchasable food products. The gap between #FoodTok engagement and Food & Beverage GMV suggests there’s still significant room for sellers to convert food content viewers into buyers.
Health and Wellness: The High-Margin Opportunity
Health at $600.42 million (5.42%) skews toward supplements, vitamins, and wellness products that carry strong gross margins and high repeat purchase rates. The challenge in this category is regulatory compliance — claims made in video content need to align with what’s legally permissible for supplement marketing — but sellers who navigate those constraints correctly find a category with excellent unit economics and a loyal customer base.
The NewStar and Cold-Start Incentive Programs: Free Ad Credits for Acting on Opportunity Data

One of the most underappreciated features of the Product Opportunities tool is its integration with TikTok Shop’s seller reward programs. When you engage with Featured Products opportunities — particularly by adding new products that match the highlighted demand signals — you can qualify for structured incentive programs that pay out in advertising credits.
The New Product Sales Incentive (NewStar)
The NewStar program rewards sellers for successfully launching new products that align with TikTok Shop’s identified opportunities. The structure: sellers receive $20 in Ads Credits for each eligible new product that meets the program’s performance thresholds. These credits are deposited directly into TikTok Ads Manager and can be applied to TikTok Shop ad campaigns.
The eligibility requirements are specific. Your shop must maintain a Shop Performance Score of 3.5 or above (or be null, meaning no score yet established). The qualifying products must be newly listed within the program’s activity window and must have generated at least one valid order within the specified period. Products that received incentives in a prior cycle are excluded from repeat qualification.
The Cold-Start Incentive
The Cold-Start Incentive is the higher-value component: $50 in Ads Credits per successful cold-start product, with both programs capped at a combined maximum of $3,000 per month per seller. A “cold-start” product is a newly listed item that needs initial momentum — essentially TikTok subsidizing the cost of getting a new product off the ground with advertising spend.
The $3,000 monthly cap means a seller who is systematically adding new products that qualify for the Cold-Start program could theoretically receive up to $3,000 in free monthly ad credits — equivalent to a substantial ad budget subsidy that most sellers don’t know they’re eligible for.
How to Access the Reward Programs
Both programs are accessed through Seller Center > Product Opportunities. When an eligible opportunity displays a rewards badge or indicator in the Featured Products tab, clicking through to the detail view shows the specific incentive structure and matching criteria. The key practice is to check the Featured Products tab when it refreshes (typically monthly or quarterly depending on the program cycle) and immediately assess which opportunities align with your sourcing capabilities.
Credits are verified within approximately 30 business days of meeting the performance criteria and are added automatically to your Ads Manager account. There’s no separate application process once you’re enrolled in the active program cycle — eligibility is assessed automatically based on your shop’s performance data.
From Research Data to a Listing That Converts
Identifying the right product through the Product Opportunities tool is step one. Turning that into a listing that TikTok’s recommendation engine actually surfaces — and that converts when buyers find it — requires a separate but equally deliberate process. There’s a specific threshold that determines whether your listing gets seen at all.
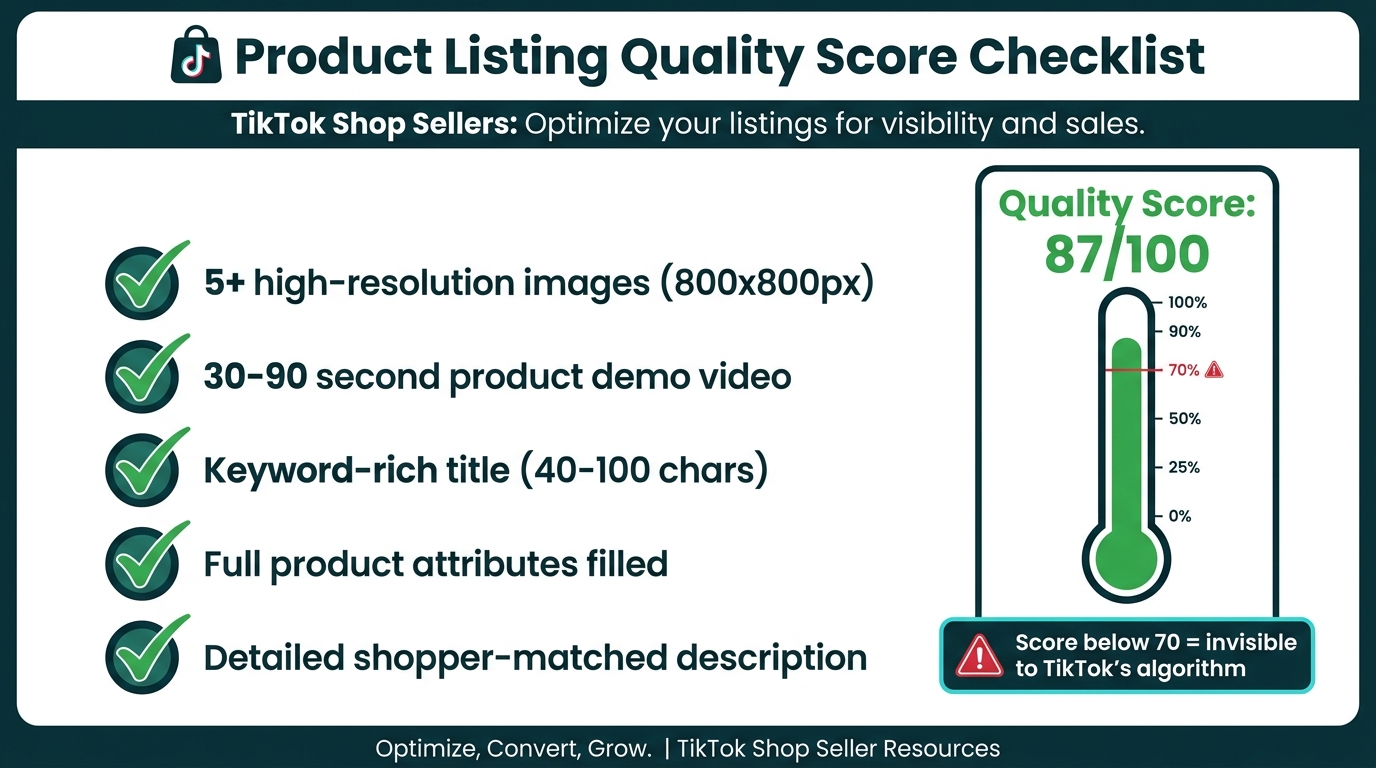
The 70-Point Quality Score Threshold
TikTok’s listing system assigns each product a quality score on a scale of 0 to 100, visible in the listing editor. Listings that score below 70 are effectively invisible to TikTok’s recommendation engine — they won’t appear in organic discovery surfaces like the For You Page shop tab, search results, or affiliate creator feeds. This isn’t a soft recommendation; it’s a binary gate on organic reach.
Hitting 70 or above requires meeting a specific set of listing completeness criteria:
- Five or more product images at 800×800px or higher resolution
- A product demo video between 30 and 90 seconds in length
- A keyword-optimized title between 40 and 100 characters with primary search terms front-loaded
- Full product attribute fields completed — size, color, material, weight, and any category-specific attributes
- A detailed product description written to match how buyers in your category search and evaluate products
Each element contributes to the score. The video element is weighted heavily, which is why adding a product video — even a simple one — often pushes listings from the 50s to the 70s on the score scale.
Keyword Placement: Where and How
The keywords you identify in the Top Searched Keywords tab need to be placed in specific locations to matter algorithmically. The product title carries the most weight — front-loading the primary keyword in the first three to five words (e.g., “Viral Blackhead Remover for Oily Skin” rather than “For Oily Skin Blackhead Remover That Works”) aligns with TikTok’s search ranking logic.
Secondary keywords belong in the product description and attribute fields. Aim for natural integration of three to five long-tail variations of your primary keyword without forcing them into sentences where they don’t fit. TikTok’s algorithm reads for relevance, not keyword density — a description that reads naturally while incorporating accurate search terms outperforms a stuffed one.
Video Previews and Creator Selection Rates
The listing video serves two distinct purposes. First, it directly contributes to your quality score. Second — and this is often underestimated — it’s a major factor in whether affiliate creators choose to promote your product. Data from 2026 shows that listings with product demo videos see creator selection rates above 25%, compared to approximately 8% for image-only listings. That’s more than a 3x difference in affiliate promotion likelihood.
Creators browse TikTok Shop’s affiliate marketplace looking for products that will perform well in their content. A listing with a high-quality demo video signals that the product is visually compelling and gives the creator a reference point for how to frame their own content. Listings without video are largely skipped during creator browsing — even if the commission rate is competitive.
Film product demo videos before you start recruiting creators. It’s the single highest-leverage pre-launch action you can take to increase affiliate adoption.
Sample Eligibility and Creator Discovery
Enabling product samples in your listing settings — allowing creators to request a product for free in exchange for content — increases organic creator discovery rates substantially. Products marked as sample-eligible see approximately 2.5 to 3x more creator applications than comparable products without sample access. For products where unit economics allow a sample program (typically items with COGS below $15-20 where creator content has meaningful expected revenue return), enabling samples should be the default setting.
Native Product Opportunities vs. Third-Party Research Tools
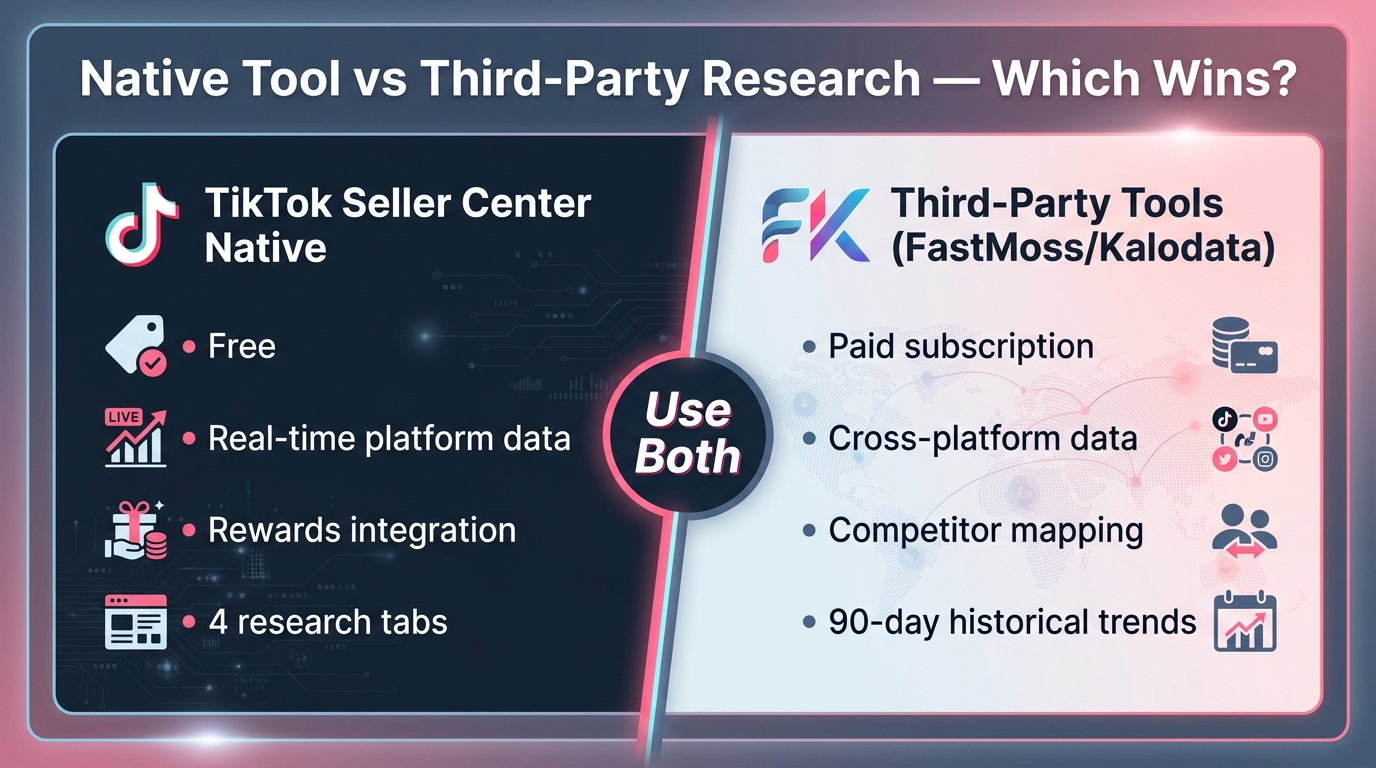
The Product Opportunities tool in Seller Center is free and pulls from TikTok’s own first-party data. Third-party tools like FastMoss and Kalodata are paid subscriptions that pull from a different data set. These aren’t competitors — they’re complementary layers that serve different research functions.
Where the Native Tool Has an Absolute Advantage
For anything involving TikTok’s internal demand signals — what buyers are searching for within TikTok Shop specifically, which products are under-supplied on the platform itself, which subcategories are trending in TikTok’s commerce infrastructure — the native Seller Center tool is more accurate than any third-party alternative. It’s pulling from the actual platform database, not from scraped or estimated data.
The reward program integration is also exclusive to the native tool. No third-party platform can tell you which products qualify for TikTok’s NewStar or Cold-Start incentive programs — that information only lives inside Seller Center.
Where Third-Party Tools Add Value
FastMoss provides the broadest external product coverage, with daily updates, ad performance monitoring, and competitor mapping. If you want to understand how a specific seller is performing, what their top SKUs are, and which products are generating revenue for shops in your category, FastMoss’s product explorer does this with a depth that Seller Center’s own analytics don’t provide.
Kalodata excels at historical trend analysis — specifically, tracking how a product’s performance has moved over 60 to 90-day windows. This longer-horizon data is valuable for distinguishing durable demand from short-lived trends. A product that’s been generating consistent GMV for 90 days is a fundamentally different opportunity than one that spiked in the last two weeks.
The practical approach: start every product research session in Seller Center’s Product Opportunities tool to identify TikTok-specific demand signals and check reward program eligibility. Then use FastMoss or Kalodata to validate the opportunity externally — checking competitor sales volumes, historical trend data, and cross-platform demand — before committing to sourcing or catalog additions.
Cost Consideration
Third-party tools typically run $50 to $200+ per month depending on data access level. For sellers doing serious catalog research, the investment is usually justified. For sellers just starting out or running small catalogs, the native Seller Center tool is sufficient for initial product discovery — and it’s completely free. Build a workflow starting with the free native tool; add third-party tools when your catalog and revenue justify the subscription cost.
Building a Repeatable Weekly Product Research Routine
The sellers who extract the most value from the Product Opportunities tool aren’t the ones who use it occasionally — they’re the ones who’ve built it into a structured weekly routine. The data updates on different schedules (keywords update weekly, featured products update quarterly), which means a consistent cadence yields different insights across each check-in.
Monday: Keyword and Search Data Review
Start each week by reviewing the Top Searched Keywords tab. The keyword list refreshes weekly, so Monday morning is the optimal time to catch new entries before competitors do. Cross-reference the new keywords against your existing catalog: are any high-volume, low-competition search terms relevant to products you already sell? If yes, that’s a listing optimization task — update titles and descriptions to incorporate the term before the week’s traffic peak. If the keyword points to a product category you don’t carry, log it in a product opportunity tracker for sourcing evaluation.
Wednesday: Content and Hashtag Intelligence
Mid-week, check the Trending Hashtags tab. Use this to brief your content creation schedule — which hashtags in your category are currently converting viewers into buyers? Content planned and published Thursday through Saturday typically catches peak weekend browsing and shopping behavior on TikTok.
Monthly: Featured Products and Subcategory Review
At the start of each month, do a deeper review of the Featured Products tab and Popular Subcategories data. These update less frequently, but they represent the biggest catalog-level decisions — whether to add a new product line, whether to double down on a growing subcategory, whether to deprioritize a subcategory that was trending three months ago but has flattened.
Check the reward program status at the same time. If there’s an active NewStar or Cold-Start program cycle, identify which products in your planned additions might qualify and prioritize their listing setup accordingly.
Keep a Structured Opportunity Log
The research is only valuable if it turns into action. Maintain a simple spreadsheet (or product management tool of your choice) that logs: the keyword or product opportunity identified, the source tab, the date identified, the current competition level, and the action status (researching, sourcing, listed, monitoring). Reviewing this log weekly ensures that opportunities don’t surface and then get forgotten — a common failure mode for sellers who use the tool sporadically.
Common Mistakes Sellers Make With the Product Opportunities Tool
The tool is only as useful as the decisions made from it. Several recurring mistakes reduce its effectiveness significantly.
Treating Every Signal as Equal Urgency
Not all opportunity signals require immediate action. A product appearing in Featured Products that would take three months to source, test, and list is a lower-priority action than a keyword appearing in Top Searched Keywords that you could apply to an existing listing today. Sellers who treat every signal as equally urgent end up in a perpetual research loop without actually shipping product pages.
Triage the signals by time-to-action. Listing optimizations (applying keywords to existing products) should happen within 48 hours of identification. New product additions require a longer evaluation cycle — sourcing lead time, unit economics assessment, content planning. Put them on a 30- to 60-day development track rather than trying to move on everything simultaneously.
Ignoring the Qualification Requirements for Reward Programs
Sellers often see the reward program indicators in Featured Products and assume they’re automatically eligible. The eligibility requirements — particularly the Shop Performance Score threshold of 3.5 or above — mean that shops with compliance issues, high cancellation rates, or poor customer service scores may be ineligible even if they’re adding the right products. Monitor your Shop Performance Score proactively; a score below 3.5 disqualifies you from the incentive programs entirely.
Using Keyword Data Without Checking Buying Intent
High search volume in the Top Searched Keywords tab doesn’t always mean high buying intent. Some high-volume searches are informational (“how to apply retinol”) rather than transactional (“retinol serum buy”). Cross-reference high-volume keywords with the purchasing behavior data in the Featured Products tab to verify that search volume correlates with actual purchase activity before optimizing a listing or sourcing a product around a term.
Skipping the Video Even After Identifying a Strong Opportunity
Sellers will identify a winning product through the tool, get it listed with good images and an optimized title, and then skip the demo video because it’s extra effort. This is a costly shortcut. Without the video, the listing likely scores below 70 (near-invisible organically) and achieves creator selection rates below 10%. The product opportunity identified in the research phase never actually converts into sales because the listing itself isn’t set up to perform. Treat the demo video as non-optional for any product worth listing.
Only Doing Research When Sales Are Slow
Product research should be a proactive discipline, not a reactive emergency response. Sellers who only open the Product Opportunities tool when sales dip are always chasing the market rather than getting ahead of it. The keyword data, subcategory trends, and featured product signals are most valuable when you have time to source, produce content, and optimize listings ahead of the demand curve — not when you’re already behind it.
Turning Product Intelligence Into Affiliate Leverage
One of the highest-return applications of Product Opportunities data is using it to brief your affiliate creator pipeline. Most sellers treat creator recruitment and product research as separate workstreams. The sellers who perform best connect them directly.
Brief Creators With Demand Data, Not Just Commission Rates
When recruiting creators to promote a product you’ve identified through the Featured Products or Trending Hashtags tabs, share the actual demand signal with them. Tell them: “This keyword is trending with high search volume and low competition on TikTok Shop right now — there’s a clear buyer audience actively looking for this.” This context helps creators understand why the product is worth creating content for and gives them a content angle (addressing the search need directly) rather than just a generic product promotion.
Creators who understand the demand context tend to produce more targeted content that performs better than generic unboxing or review videos. Better content means more conversions, which means more affiliate commission — a self-reinforcing cycle that starts with product intelligence rather than ending there.
Match Trending Hashtags to Creator Content Briefs
The Trending Hashtags tab effectively tells you which content contexts are currently converting in your category. If #CleanSkincare is generating strong purchasing behavior and you sell skincare, your creator brief should explicitly suggest incorporating that hashtag approach into the content — not as a mandate, but as intelligence that helps creators align their content to proven demand signals.
Time Product Launches to Opportunity Cycles
Featured Products opportunities don’t sit open indefinitely. When a product appears in the Featured Products tab with reward program eligibility, there’s a window for capturing both the organic supply-gap advantage and the incentive credits. Sellers who move quickly — listing the product, filming the demo video, recruiting creators, and enabling samples within two to three weeks of identification — capture the opportunity before other sellers fill the supply gap.
Sellers who move slowly often find that by the time they’ve sourced and listed the product, the Featured Products tab has moved on, the reward window has closed, and enough other sellers have entered the category to compress the supply gap that made the opportunity attractive in the first place.
What Good Looks Like: A Product Research Process That Compounds Over Time
Individual research sessions matter less than the system they feed into. The sellers who build durable competitive advantages on TikTok Shop are the ones who use Product Opportunities data to make compounding catalog decisions — each week’s research informing the next month’s listings, each month’s listings generating performance data that refines the next quarter’s product strategy.
The compounding effect works like this: consistent Product Opportunities monitoring surfaces keyword trends early. Early keyword adoption means your listing is established and has review history by the time the keyword reaches peak search volume. An established listing with reviews converts at higher rates than a newly listed competitor who enters the same keyword later. Higher conversion rates attract more affiliate creators (TikTok’s algorithm shows creators products with strong conversion data). More creator content drives more traffic, which generates more reviews and sales history — reinforcing the listing’s authority in search rankings.
The sellers who feel like they can’t break through in competitive categories are often making the mistake of entering at the peak of a trend with no established presence. The Product Opportunities tool, used consistently, is specifically designed to help you identify and move on trends before they peak — when supply is low and the platform’s own reward programs are actively subsidizing early movers.
Conclusion: Data Changes the Research Calculus
TikTok Seller Center’s Product Opportunities tool isn’t a magic product picker. It’s a structured intelligence layer that surfaces signals — demand gaps, trending searches, hashtag-driven commerce, subcategory acceleration — that most sellers are paying third-party tools to approximate while ignoring the first-party version sitting inside their own dashboard.
Used correctly, it compresses product research from a multi-week intuition-based exercise into a systematic weekly practice grounded in platform data. The four tabs serve different functions: Featured Products identifies supply gaps with cross-platform demand validation; Top Searched Keywords delivers buyer-intent search terms with low competition; Trending Hashtags connects content momentum to purchase behavior; Popular Subcategories surfaces category acceleration before it’s obvious to the market.
Layer in the reward programs — $20 to $50 in ads credits per qualifying product, up to $3,000 per month — and the case for using this tool consistently becomes even clearer. TikTok is actively incentivizing sellers to act on these demand signals. That’s not a program structure designed to be ignored.
The final piece is execution discipline. Research without listing action, listing action without quality scores above 70, quality scores above 70 without video content, and video content without affiliate recruitment — each gap in the chain loses significant conversion potential. The Product Opportunities tool provides the intelligence. Building the execution habit around it is what turns that intelligence into consistent GMV growth.
Start this week: Log into Seller Center, navigate to Products > Product Opportunities, open the Top Searched Keywords tab, and identify three keywords with high demand and low supply that are relevant to your catalog. Apply two of them to existing listings before the end of the day. Add the third to your sourcing evaluation list. That’s the habit, repeated weekly, that compounds into a catalog built on real demand data rather than guesswork.