
Most organizations enter their first AI automation initiative the same way: a mandate arrives from above, a vendor demo creates excitement, a pilot gets greenlit, and then — somewhere around week eight — things quietly stop moving forward. No dramatic failure. Just drift.
That pattern accounts for a staggering share of AI disappointments in 2026. According to research from MIT’s Project NANDA, approximately 95% of enterprise generative AI pilots fail to deliver measurable ROI or bottom-line impact. Separate data shows that while 87% of large enterprises now have at least one AI deployment running, only 33–40% have scaled AI across the organization in any meaningful way.
The gap between those two numbers — between deployment and scale — is where operators live. And it’s where most playbooks run out of road. The strategic frameworks look neat on slides. The technical architecture gets documented in Confluence. But the person responsible for actually running operations on a Tuesday morning is left holding a half-finished integration, a skeptical team, and metrics that don’t quite tell the story leadership wants to hear.
This guide is built for that person. Not for the CTO. Not for the AI strategy team. For the operator who owns a process, has a budget that isn’t unlimited, and needs to show results inside of 90 days.
What follows is a week-by-week field manual: what to do, in what order, and — just as importantly — what to stop doing. The structure is 30-30-30: Discover & Design, Pilot & Prove, Scale & Systematize. Each phase has specific tasks, decision gates, and metrics. None of it requires a PhD in machine learning. It requires discipline, sequencing, and the willingness to call a failing pilot early.
Why the First 30 Days Make or Break Everything
There’s a common misconception that the first month of an AI rollout is primarily a technical exercise — get the tools selected, get the API keys provisioned, get the integrations mapped. In reality, the first 30 days are almost entirely a scoping and alignment exercise, and the organizations that treat them as such consistently outperform those that don’t.
The problem is urgency. Pressure to show AI progress has intensified enormously in 2026. Boards want to see AI initiatives underway. Leadership wants updates by Q2. That urgency pushes teams to start building before they’ve properly diagnosed what they’re building toward — and that’s where scope creep, wasted tooling spend, and eventual project abandonment take root.
The Diagnostic Week (Days 1–7)
Before any tool is evaluated or any vendor is engaged, the first week should be spent mapping the current operational reality. This means process documentation, time-on-task analysis, and honest conversations with the people doing the work.
The goal is a short-list of three to five candidate workflows for automation. Not a wishlist of everything that could theoretically benefit from AI — a focused list of workflows that meet a specific set of criteria:
- High volume, low variance: The task happens frequently and follows a predictable pattern most of the time.
- Measurable baseline: You can quantify today’s performance — time per unit, error rate, cost per transaction.
- Bounded scope: The workflow has a clear start and end point and doesn’t depend on dozens of external systems to complete.
- Defined exception handling: You know what the edge cases look like and who currently handles them.
Workflows that fail these criteria aren’t necessarily bad automation candidates forever — they’re just not right for a 90-day pilot. Save them for later phases.
Stakeholder Alignment Before Tooling (Days 8–14)
The second week is for alignment, not architecture. This means securing explicit commitment from three groups: the executive sponsor who will backstop the program when friction emerges, the IT or data team lead who will manage integration dependencies, and — most critically — the frontline operators whose workflows are being targeted.
That last group is consistently underinvested. Research from Q1 2026 shows that approximately 80% of workers either bypass or reject AI tools when they’re rolled out without adequate frontline involvement. The operators who will use these tools daily aren’t just end users; they’re the holders of the tribal knowledge that makes the difference between an automation that works in theory and one that works on a Tuesday at 4pm when the data is messy and two team members are out sick.
Getting that buy-in early doesn’t mean lengthy workshops or change management theater. It means one-on-one conversations, clear answers about what will and won’t change in their day-to-day work, and a specific invitation for their input on what the automation should handle versus what it should escalate to a human.
Tooling Selection and Stack Lock (Days 15–30)
Only after the target workflow is selected and stakeholders are aligned should tooling evaluation begin. By this point, the selection criteria are already defined by the workflow itself — the evaluation is about fit, not features.
Two frameworks dominate tool selection in 2026: build-vs-buy analysis and integration footprint assessment. On the build-vs-buy question, the current consensus leans toward composable platforms (n8n, Make, Zapier for simpler integrations; more robust orchestration layers for complex multi-agent flows) over custom-built solutions for initial pilots. Custom builds carry too much maintenance overhead to be appropriate for a 90-day window.
The integration footprint question matters just as much: how many existing systems does the automation need to touch, and how clean are those data feeds? Every additional integration point is a potential failure surface. Pilots with three or fewer integration touchpoints have meaningfully higher completion rates than those with six or more.
By day 30, you should have: one selected target workflow, documented baselines, aligned stakeholders, selected tooling, and a governance structure (more on that shortly). If any of those five things aren’t locked down, do not proceed to Phase 2. The pilot will not recover what the discovery phase failed to establish.
The Workflow Audit: Finding Your Highest-Signal Targets
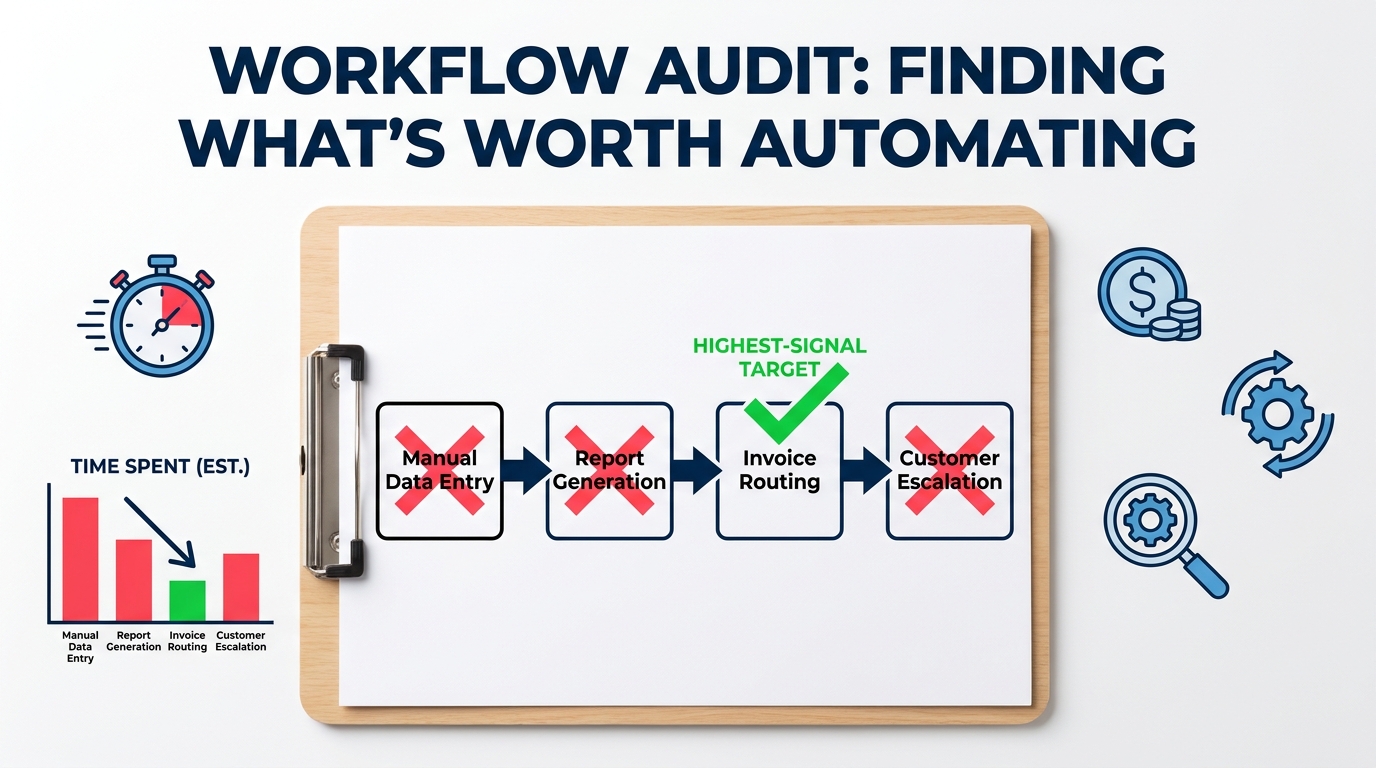
The workflow audit is the most important analytical exercise in the entire 90-day program, and it’s consistently undervalued. Most teams treat it as a checkbox exercise — a quick survey, a few interviews, a list of “pain points.” That’s not enough. A rigorous workflow audit is what separates automations that genuinely move the operational needle from those that simply make a process faster while changing almost nothing about its cost structure or quality output.
The Four Dimensions of Workflow Readiness
Every candidate workflow should be evaluated across four dimensions before it advances to pilot status:
1. Frequency and Volume
How many times does this workflow execute per day, week, or month? What’s the total time cost across the team? A workflow that consumes three hours per week has a different ROI ceiling than one that consumes thirty. Volume is the multiplier — and it’s often underestimated when the burden is distributed across many team members rather than concentrated in one role.
2. Rule Density vs. Judgment Density
Every workflow sits somewhere on a spectrum between “fully rule-governed” and “fully judgment-dependent.” Invoice data extraction is mostly rule-governed — a defined field format, predictable source documents, clear validation criteria. Customer complaint triage is mostly judgment-dependent — tone matters, context matters, history matters. AI automation performs reliably in the rule-dense zone and struggles in the judgment-dense zone. Map your candidates honestly.
3. Data Readiness
This is the single biggest predictor of pilot success, and it’s consistently underassessed. Before committing to a workflow, audit the data it depends on: Is it structured or unstructured? Where does it live — in a clean CRM, in PDFs, in spreadsheets that different people maintain differently? How complete is it? How consistent is the formatting? How often is it updated? “Data debt” — the accumulation of incomplete, inconsistent, or poorly structured operational data — is responsible for more failed AI pilots than any model-related issue.
4. Exception Volume and Handling Clarity
No automated workflow handles 100% of cases without exception. The critical question is: what percentage of cases will fall outside the automation’s decision boundary, and is there a clear protocol for what happens when they do? If the exception rate is above 20% of total volume, the workflow is probably not ready for automation yet — the training data or rule structure isn’t mature enough. And if the exception handling protocol is vague (“someone looks at it”), the automation will create a new operational bottleneck rather than relieving one.
Building the Automation Priority Matrix
After scoring candidates across these four dimensions, map them on a two-axis matrix: automation readiness (horizontal) versus business impact (vertical). The top-right quadrant — high readiness, high impact — is your first pilot. The bottom-right — high readiness, lower impact — becomes your second and third automations once the first is stable. The top-left — high impact, lower readiness — becomes a medium-term target once data and process maturity improve. The bottom-left doesn’t go on the roadmap at all until other conditions change.
This sequencing discipline is what separates programs that build momentum from those that stall. Every successful automation creates organizational proof — demonstrated results that make the next automation easier to fund, approve, and staff. Starting with the right target means the entire program benefits from a strong first case study.
Documenting the Baseline Rigorously
Before any automation is built, the baseline performance of the target workflow must be documented with precision. This means capturing: average cycle time per unit, error rate (defined specifically — what counts as an error?), volume per period, labor hours consumed per period, rework rate, and any cost-per-unit metrics relevant to the business context.
These numbers will define what success looks like. Without them, the post-pilot evaluation becomes a narrative exercise rather than a data exercise — and narrative exercises rarely survive budget scrutiny. Measure twice before you build once.
Building Your Automation Team Without a Big Budget
One of the most persistent myths about AI automation is that it requires a dedicated, well-resourced team of ML engineers, data scientists, and automation architects to get off the ground. For enterprise organizations standing up a large-scale AI platform, that may be true. For operators running a 90-day rollout on one or two workflows, it absolutely is not.
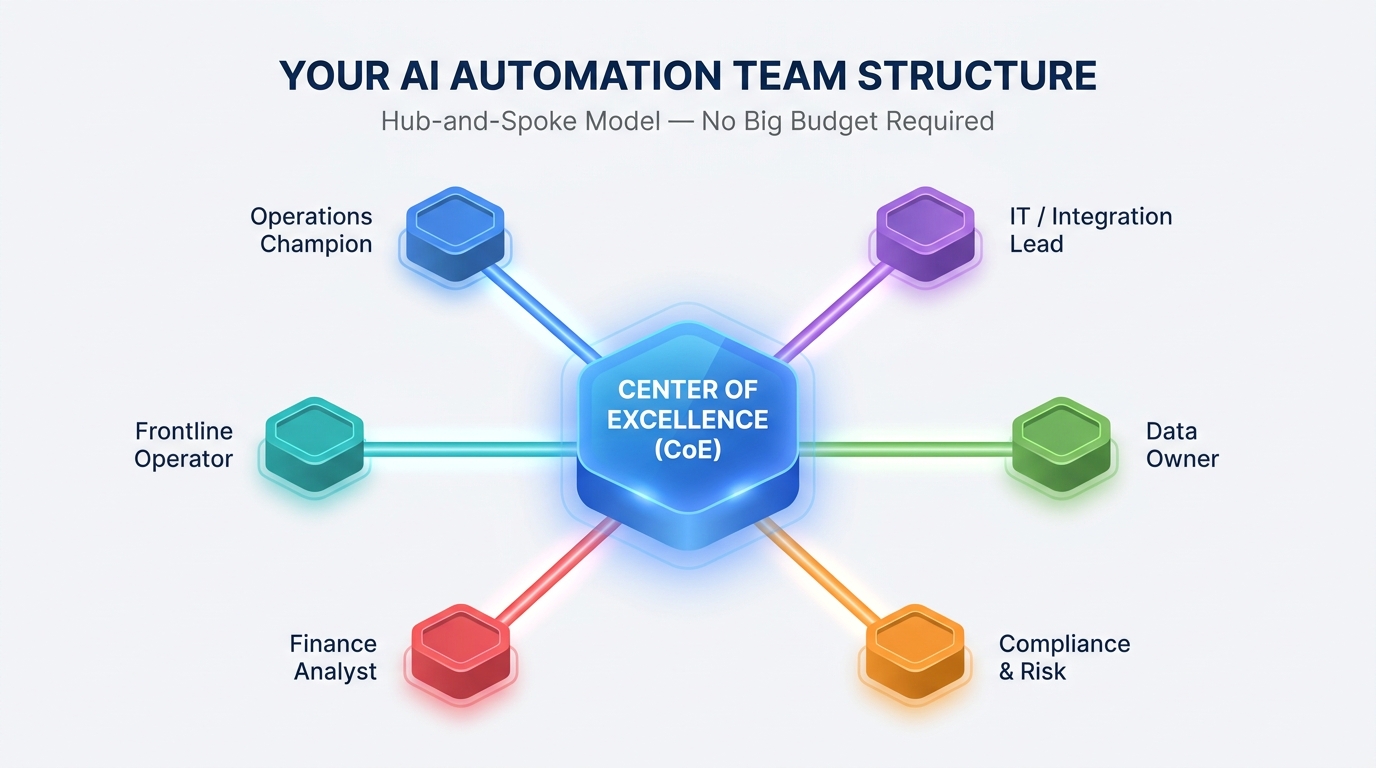
The structure that consistently works at operator scale is the hub-and-spoke model — not as an organizational redesign, but as a lightweight coordination layer that you build using people who already exist in the organization.
The Core Roles (and Who Actually Fills Them)
The Process Owner
This is the most important role in the entire program, and it’s often assigned incorrectly. The process owner should not be the most senior person available or the person with “AI” in their title. It should be the person who knows the target workflow most deeply — who understands its exceptions, its edge cases, its seasonal patterns, and its political sensitivities. In practice, this is often a senior operations analyst, a team lead, or a veteran frontline manager. Their deep process knowledge is irreplaceable, and without them actively engaged, even technically excellent automations fail in production.
The Automation Builder
This is the person who actually constructs the workflow in whatever platform has been selected. In 2026, this role does not require deep engineering skills for most operational automations — modern platforms have made it accessible to technically literate non-engineers. The builder needs to understand API connections, data mapping, conditional logic, and error handling. In smaller organizations, this role is often filled by an IT analyst, a BI developer, or an operations analyst who has grown into automation tools.
The Data Steward
Every automation depends on data, and every data dependency needs an owner. The data steward is responsible for ensuring the automation’s input data is clean, complete, and consistent — and for flagging when it isn’t. This isn’t a full-time role for a 90-day pilot; it’s a part-time responsibility assigned to whoever already owns the relevant data assets.
The Governance Lead
Someone needs to own the question of what the automation is and isn’t allowed to do. In regulated industries, this person may need a compliance background. In less regulated contexts, it’s typically the operations manager or a risk-aware IT lead. Their job is to define the automation’s decision boundaries, approve its exception protocols, and ensure there’s a documented rollback plan.
The Frontline Liaison
This role is often forgotten and is almost always the difference between a smooth adoption and a quiet rebellion. The frontline liaison is a respected member of the team whose workflows are being automated. Their job is to translate between the builder and the end users — surfacing concerns before they become resistance, identifying edge cases before they become failures, and building peer-level confidence in the new process.
What You Don’t Need (Yet)
For a 90-day operational pilot, you do not need a dedicated data science team, a custom-built model, a formal AI Center of Excellence, or a change management agency. Those investments become relevant as the program scales beyond the pilot phase. Trying to build all of that in the first 90 days is one of the most reliable ways to ensure nothing ships.
Keep the team small enough to move quickly. Add roles as the program earns the right to expand.
Shadow Mode: Why You Should Never Go Live Cold
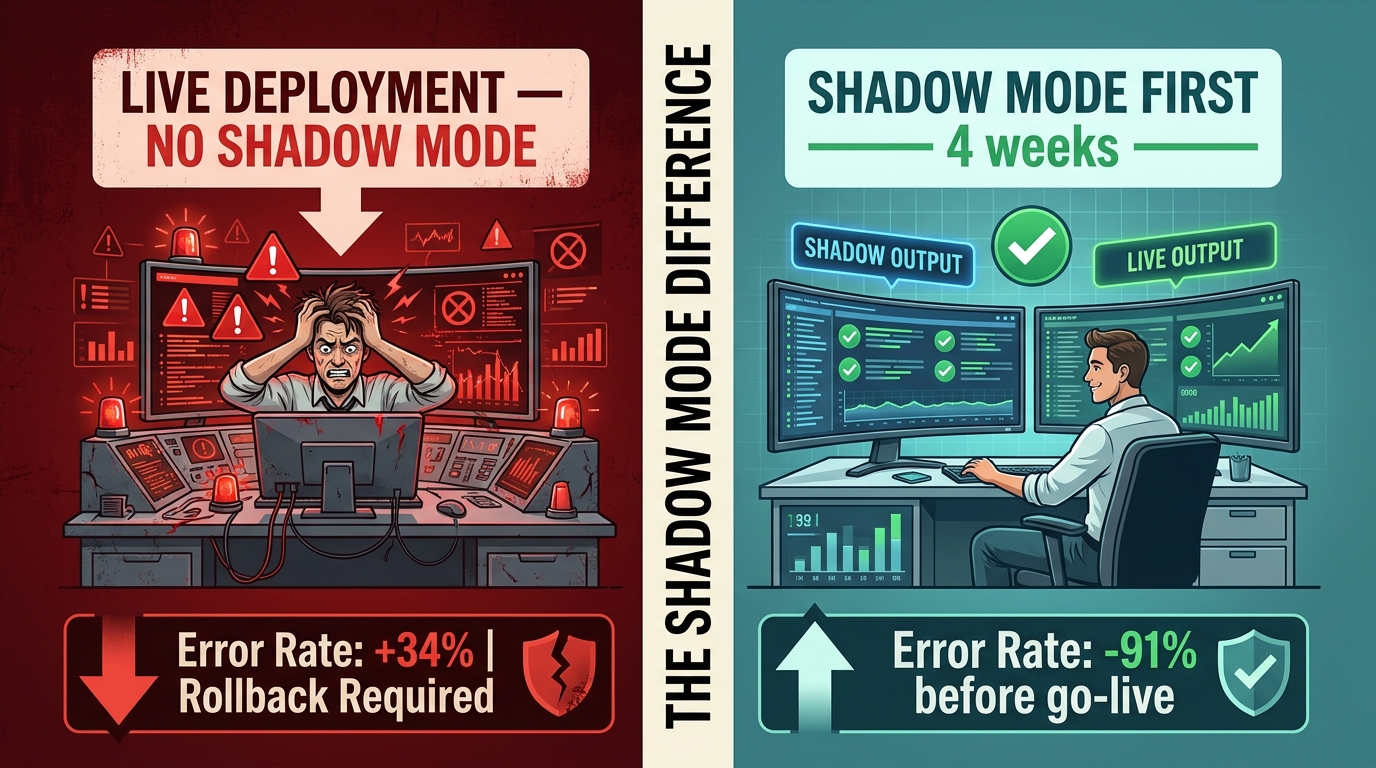
Shadow mode is the single highest-leverage practice in the entire 90-day playbook, and it’s the one most frequently skipped in the rush to demonstrate results. The concept is straightforward: before the automation takes any live action, it runs in parallel with the existing process. It receives the same inputs. It generates the same outputs. But those outputs are not applied — they’re reviewed by a human who also completes the task using the existing method.
The comparison between the automation’s output and the human’s output over a defined period reveals exactly where the model performs reliably and where it doesn’t. It surfaces edge cases that weren’t captured in the design phase. It allows the process owner to tune the automation’s decision boundaries before they affect real operations. And it gives frontline operators the experience of watching the tool work alongside them — not replacing them — which is one of the most effective adoption tactics available.
Structuring the Shadow Period
A shadow period of two to three weeks is appropriate for most operational automations. Too short and you miss low-frequency exceptions. Too long and you’re burning runway without building momentum. The shadow period should cover at least one full cycle of the workflow’s natural volume patterns — if the workflow has monthly peaks, the shadow period should capture one.
During shadow mode, track the following for every task processed:
- Automation output vs. human output: match or mismatch?
- Mismatch category: wrong field, wrong value, missed exception, formatting error, or other
- Confidence score (if the platform provides one): correlate confidence with mismatch rate
- Processing time for automation vs. human baseline
By the end of the shadow period, you should have a clear accuracy profile. A well-scoped automation targeting high-readiness workflows typically achieves 85–95% output accuracy in shadow mode before any tuning. If accuracy is below 80%, the automation is not ready for live deployment — return to the workflow design and data quality assessment before proceeding.
Using Shadow Data to Set Go-Live Thresholds
Shadow mode data should directly inform your go-live decision criteria. Define the accuracy threshold required for live deployment before the shadow period begins — not after. This prevents the threshold from being adjusted post-hoc to justify a decision that’s already been made for political reasons.
A practical threshold framework for most operational automations: 90% output accuracy overall, with specific accuracy requirements for high-stakes subtasks. For example, an invoice processing automation might require 90% accuracy overall but 99% accuracy on total amounts and 95% accuracy on vendor identification specifically.
If the automation meets the thresholds: proceed to controlled live deployment with human-in-the-loop oversight. If it doesn’t: document which failure categories are blocking accuracy, fix the underlying issue (data, prompt design, or scope), and run another two-week shadow cycle before re-evaluating.
The Governance Layer Every Operator Skips (And Pays For)
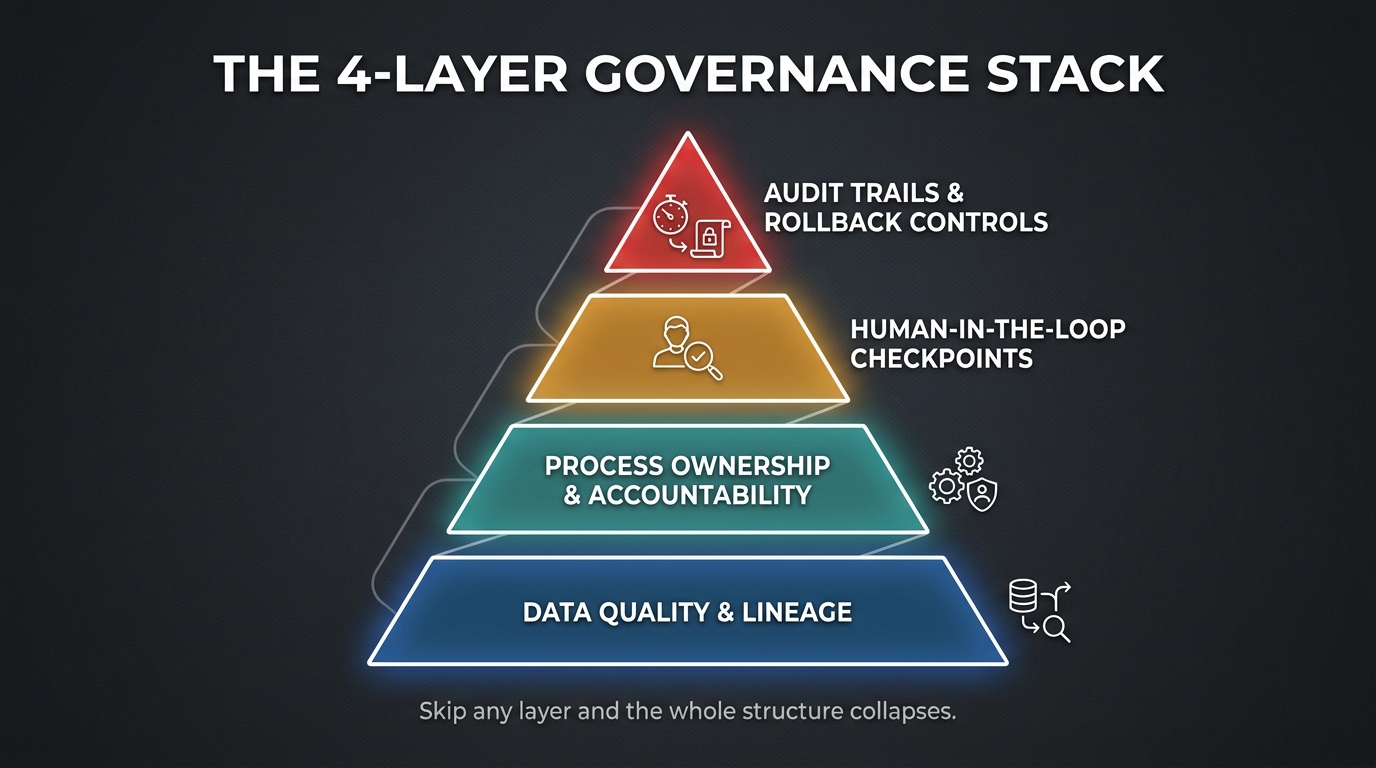
Governance is the word that makes operators’ eyes glaze over. It sounds like compliance overhead, like something legal and IT fight about in rooms that operations doesn’t attend. In practice, for an operational AI automation, governance is simply the answer to four questions: Who owns this automation? What is it allowed to do? What happens when it makes a mistake? And how will we know if it starts degrading over time?
Those four questions map directly to the four layers of a working governance structure. Organizations that document answers to all four before going live have dramatically lower incident rates and faster recovery times when problems do occur. Organizations that skip it — and most do — spend weeks in reactive firefighting mode that could have been avoided entirely.
Layer 1: Data Quality and Lineage
This is the foundation. Every automation depends on input data, and the quality of that data determines the quality of the automation’s outputs. Governance at this layer means documenting: where the input data comes from, who owns it, how often it’s updated, what the known quality issues are, and what the automation should do when it receives data that doesn’t meet quality standards.
The last point is critical and usually absent. Most automations are designed for the happy path — the clean, well-formatted input. What happens when a PDF is scanned at an angle? What happens when a field that’s usually populated is blank? What happens when the data source goes down? If those answers aren’t documented and built into the automation’s exception handling, every one of those scenarios becomes a live incident.
Layer 2: Process Ownership and Accountability
Every automation needs a named owner — a specific person, not a team or a role — who is accountable for its performance. This owner is responsible for monitoring its outputs, approving changes to its decision boundaries, and escalating when it starts behaving unexpectedly.
In the hub-and-spoke model, this is typically the process owner who was involved in the design phase. The critical governance requirement is that this ownership is explicit, documented, and known to everyone who works alongside the automation. Ownership ambiguity is one of the most common causes of “automation orphaning” — automations that were once working but gradually degraded because no one was accountable for maintaining them.
Layer 3: Human-in-the-Loop Checkpoints
Human oversight doesn’t mean a human reviewing every output — that eliminates most of the efficiency gain. It means defining, in advance, the specific conditions under which the automation pauses and asks for human review. These conditions typically include: output confidence below a defined threshold, input data failing quality checks, cases matching specific exception categories, and any output that would trigger a consequential downstream action (sending a payment, updating a customer record, closing a ticket).
The checkpoints should be calibrated to the risk profile of the workflow. High-consequence workflows (anything involving financial transactions, customer-facing communications, regulatory compliance) should have tighter checkpoints. Lower-consequence workflows (internal report generation, data aggregation, scheduling) can run with lighter oversight once accuracy is established.
Layer 4: Audit Trails and Rollback Controls
Every action taken by the automation should be logged — input received, output generated, confidence score, exception flags, and any human review decisions. This isn’t bureaucracy; it’s the diagnostic infrastructure that allows you to identify the root cause of a failure, demonstrate compliance if required, and roll back changes if an automation behaves unexpectedly.
Rollback controls mean the ability to revert the automation to a previous version or to suspend it entirely and return the workflow to human execution within a defined time window. This capability needs to be tested before go-live, not discovered in the middle of an incident.
Days 31–60: Controlled Pilot Mechanics and What to Measure
The second 30 days are the operational core of the entire program. The automation is live — initially in a controlled environment, then progressively broadened based on performance data. The temptation in this phase is to focus on what the automation is doing and to underinvest in measuring how well it’s doing it. Resist that temptation aggressively.
The Controlled Deployment Sequence
Go-live should not be a single event. Use a staged deployment approach:
Week 5–6: Restricted production. The automation handles a subset of total volume — typically 20–30% of daily cases, selected systematically (e.g., the first N cases each morning). Human operators handle the remainder using the existing process. The automation’s outputs are reviewed by the process owner at the end of each day.
Week 7: Expanded production. If week 5–6 performance meets thresholds, expand to 50–60% of volume. Daily reviews become weekly reviews. Exception handling protocols are stress-tested against real-world edge cases.
Week 8: Full production (with oversight). The automation handles full volume. Human review shifts to exception-based — only flagged outputs get reviewed. The process owner conducts a formal mid-point review of all performance metrics before the week ends.
The Metrics That Actually Matter
Every 90-day program should track six metrics from the moment controlled production begins:
Cycle Time: Average time from workflow initiation to completion, comparing automation versus pre-automation baseline. This is the headline efficiency metric.
Error Rate: Percentage of outputs requiring correction, rework, or escalation. This must be defined precisely — an “error” for an invoice processing automation is different from an “error” for a customer communication workflow.
Exception Rate: Percentage of cases that trigger human review checkpoints. This metric has an optimal range — too low may indicate the checkpoints are miscalibrated; too high suggests the automation is overreaching its reliable scope.
Adoption Rate: Percentage of the target user population actively using the automation without reverting to the old process. This measures whether the frontline is genuinely working with the tool or politely working around it.
Rework Volume: Total units requiring human correction or re-processing after automation output. This captures quality degradation that error rate alone might miss.
Realized ROI: Labor hours saved (valued at loaded cost) minus tooling cost, minus time invested in oversight and exception handling. This is not a rough estimate — it should be calculated weekly from actual data.
The Weekly Review Cadence
During Phase 2, a weekly 30-minute review is non-negotiable. The agenda is the same every week: review the six metrics against targets, review exception log for patterns, identify any data quality issues surfaced during the week, and document any changes made to the automation. This cadence creates an evidence log that serves two purposes: it catches drift and degradation early, and it builds the documentation base for the Phase 3 scaling decision.
The Scope Creep Trap and How to Defuse It Early
Nothing kills a 90-day AI automation program faster than scope creep — and it arrives in disguise. It doesn’t announce itself as “we’re expanding the scope.” It arrives as reasonable requests from enthusiastic stakeholders who can see the pilot working and immediately want to know if it can also handle the adjacent workflow, the related exception type, the connected data source.
Those requests are not malicious. They’re often genuinely good ideas. But acting on them inside the 90-day window is almost always a mistake, and the programs that don’t resist them consistently fail to close out the pilot with clean metrics.
The Three Common Scope Creep Entry Points
The “While You’re In There” Request
The automation is being built to handle invoice processing, and a stakeholder notices that the same data source also contains purchase order information. “While you’re in there, can it also capture PO numbers?” Each individual addition seems minor. Collectively, they expand the automation’s scope by 40% while adding nothing to the original success metrics.
The Edge Case Spiral
The automation handles standard cases well, and the team starts pushing it toward increasingly non-standard cases. The process owner, wanting to prove the automation’s capabilities, agrees to try. Each edge case requires a custom logic branch. The automation becomes more complex, more brittle, and harder to maintain — while its core performance on standard cases often degrades.
The Parallel Workflow Grab
Leadership sees the pilot results and asks whether a similar automation could be stood up for a parallel team or a related workflow. The answer is probably yes — eventually. But standing it up before the first pilot is fully stable divides the team’s attention and dilutes the quality of both initiatives.
The Scope Gate Process
The simplest and most effective defense against scope creep is a formal scope gate: a documented list of what is in scope for the 90-day program, reviewed and signed off by the executive sponsor at the start of Phase 1. Any request to add scope goes through a written change request process that requires the process owner and the executive sponsor to approve it.
The change request doesn’t have to be bureaucratic. A one-paragraph summary: what’s being requested, what’s the estimated impact on timeline and resources, and what’s the recommendation (defer to Phase 2, accept with offset, or reject). The discipline of writing it down and getting explicit approval prevents the accumulation of informal commitments that expand scope without expanding timeline or budget.
Everything that gets deferred goes onto a Phase 2 backlog. This keeps good ideas alive without letting them derail the current program.
Operator Buy-In: What Actually Moves Frontline Teams
Change management orthodoxy tends toward large-scale communications plans, formal training programs, and executive video messages. For frontline operators in an operations context, most of that is noise. What actually moves frontline teams is much simpler and more direct — and it requires engagement that has to happen before the automation goes anywhere near a production environment.
What Operators Actually Fear (It’s Not What You Think)
Conventional wisdom says frontline resistance to AI automation is about job security — people afraid of being replaced. The 2026 data complicates that story. Research from Q1 2026 shows that skills gaps and integration complexity rank consistently above “fear of job loss” as the primary drivers of employee resistance. Operators aren’t primarily afraid of being replaced; they’re afraid of being expected to use a tool they don’t understand, being blamed when the tool makes a mistake, and losing control over a process they’ve owned and been measured on.
Those fears have practical implications. Resistance drops significantly when operators are involved in the design process, when the tool’s limitations are explained honestly rather than oversold, when exception handling keeps them clearly in control of edge cases, and when the performance metrics distinguish between “what the automation got wrong” and “what the operator failed to catch.” Protecting frontline operators from unfair accountability for automation errors is not just ethically important — it’s operationally necessary for sustained adoption.
The Co-Design Principle
The most powerful adoption lever available is genuine co-design: involving frontline operators not just as test users but as design contributors. This means having the process owner and at least one frontline liaison in the room when the automation’s decision boundaries, exception protocols, and escalation rules are being defined. Their input will improve the automation’s design. More importantly, it converts them from passive recipients of the change to active co-authors of it.
Co-design does not require equal technical participation. The operators don’t need to understand how the API works. They need to be able to answer: “What are the cases where you’d want a human involved?” and “What output from this automation would make you trust it?” Those are questions only they can answer, and the answers will improve every technical decision that follows.
The Visible Win Loop
Early wins need to be communicated to frontline teams directly and specifically — not in a company-wide email, but in a brief team meeting where the process owner shares the week’s metrics and attributes the improvement explicitly to the automation. “We processed 340 invoices this week. The automation handled 312 of them accurately. That freed up 8.2 hours that the team used for X.”
This specificity matters. It converts abstract “AI is helping” messaging into concrete operational reality that operators can evaluate on their own terms. Over four to six weeks of consistent communication, it shifts the emotional register from apprehension to ownership.
Days 61–90: Scaling What Works and Cutting What Doesn’t
The final 30 days have two possible paths, and the discipline to choose the right one is what separates programs that deliver durable value from those that limp across the finish line still running a marginal pilot.
The Scale Decision Gate (Day 60 Review)
At the 60-day mark, conduct a formal review against the six core metrics. This review should produce one of three decisions:
Scale: Performance meets or exceeds targets across all six metrics. Adoption is above 75%. Realized ROI is positive and the trend is favorable. Proceed to Phase 3 with an expanded scope, increased volume, or a second automation target.
Optimize: Performance is positive but not at target on one or two metrics — typically adoption or error rate. Before scaling, invest two weeks in targeted improvements: additional operator training, fine-tuning the automation’s decision logic, or tightening exception handling protocols. Re-evaluate at day 75.
Terminate: Performance is consistently below target on three or more metrics, and the root cause analysis points to fundamental issues with the workflow selection, data quality, or tool fit. Terminate the pilot, document the learnings, and pivot to a different target workflow for Phase 3. This is not failure — it’s the system working correctly. A program that can call a pilot early and redirect is a program that will eventually succeed. One that can’t is one that sinks indefinitely into a marginal use case.
The Phase 3 Expansion Mechanics
Assuming a Scale decision, Phase 3 involves three parallel workstreams:
Volume expansion: The first automation moves to full production across all applicable cases, with daily monitoring shifting to weekly monitoring as stability is demonstrated. The process owner transitions from active oversight to periodic review.
Second automation launch: Use the learnings from the first pilot to accelerate the second. The workflow audit is faster because the team now knows the criteria. The shadow period is shorter because the team understands the calibration process. The stakeholder alignment is easier because the first pilot has created internal social proof. Organizations that run a second pilot in Phase 3 consistently shorten their time-to-production compared to the first pilot — typically by 30–40%.
Knowledge transfer and documentation: Everything the team learned during the first two phases — about workflow selection, shadow mode calibration, exception handling, and adoption tactics — gets documented in a reusable format. This is the foundation of an internal automation capability that will serve the organization beyond the 90-day program.
Failure Mode Autopsy: Data Debt, Model Drift, and Process Rot
Understanding the specific mechanisms by which AI automations fail in production is as important as understanding how to build them. The three most common failure modes in operational AI automation — data debt, model drift, and process rot — each have distinct signatures, distinct causes, and distinct remediation approaches.
Data Debt: The Slow Poison
Data debt is the accumulation of structural data quality problems that weren’t addressed before the automation was built. Unlike a sudden failure, data debt manifests as gradual degradation — accuracy that was 92% in the shadow period slowly declining to 84%, then 76%, then prompting a sudden spike in exception rates.
The cause is almost always inconsistent upstream data: field formats that shift when a different team member fills in the record, source system changes that weren’t communicated to the automation owner, or seasonal data patterns that differ from the baseline period used for shadow testing.
The remediation is a systematic data lineage audit — tracing every input field the automation uses back to its source system, identifying where format inconsistencies are entering, and either fixing them at the source or building robust parsing logic into the automation to handle them. Data debt doesn’t fix itself; it requires deliberate investment, and programs that ignore it typically reach a point where the automation becomes more trouble to maintain than it saves.
Model Drift: When the World Changes and the Model Doesn’t
Model drift occurs when the patterns the automation was trained or configured to recognize change in the real world, while the automation’s logic remains static. This is especially common in automations that process natural language (customer communications, unstructured data extraction) or that depend on categories and classifications that evolve over time.
The signature of model drift is an accuracy decline correlated with a specific time period or event — a product line change, a new market, a regulatory update, a change in supplier formatting. It often goes undetected for weeks because the decline is gradual and the exception rate doesn’t spike dramatically until accuracy has already degraded significantly.
The prevention is built into the governance layer: systematic accuracy monitoring with a defined review trigger (e.g., if weekly accuracy drops below 88%, initiate a root cause review). The remediation is typically a configuration update, prompt revision, or classification rule update — rarely a full rebuild.
Process Rot: When the Workflow Changes and the Automation Doesn’t
Process rot is perhaps the most preventable and most common failure mode. It occurs when the underlying business process changes — a new approval step, a change in data source, a policy update — and the automation isn’t updated to reflect it. The automation keeps running on the old logic while the real process has moved on.
The signature is a gradual disconnect between automation outputs and downstream requirements — outputs that were correct three months ago but now consistently require manual correction because the downstream process has changed. It’s often diagnosed only when a frustrated downstream user escalates after months of silent workarounds.
The prevention is process change communication: ensuring that the automation owner is explicitly included in any change management process affecting the upstream or downstream workflows connected to the automation. This sounds obvious. It is almost never done systematically in the first iteration of an automation program, and it’s almost always done systematically after the first process rot incident teaches the lesson the hard way.
The 90-Day Scorecard: Metrics That Actually Matter
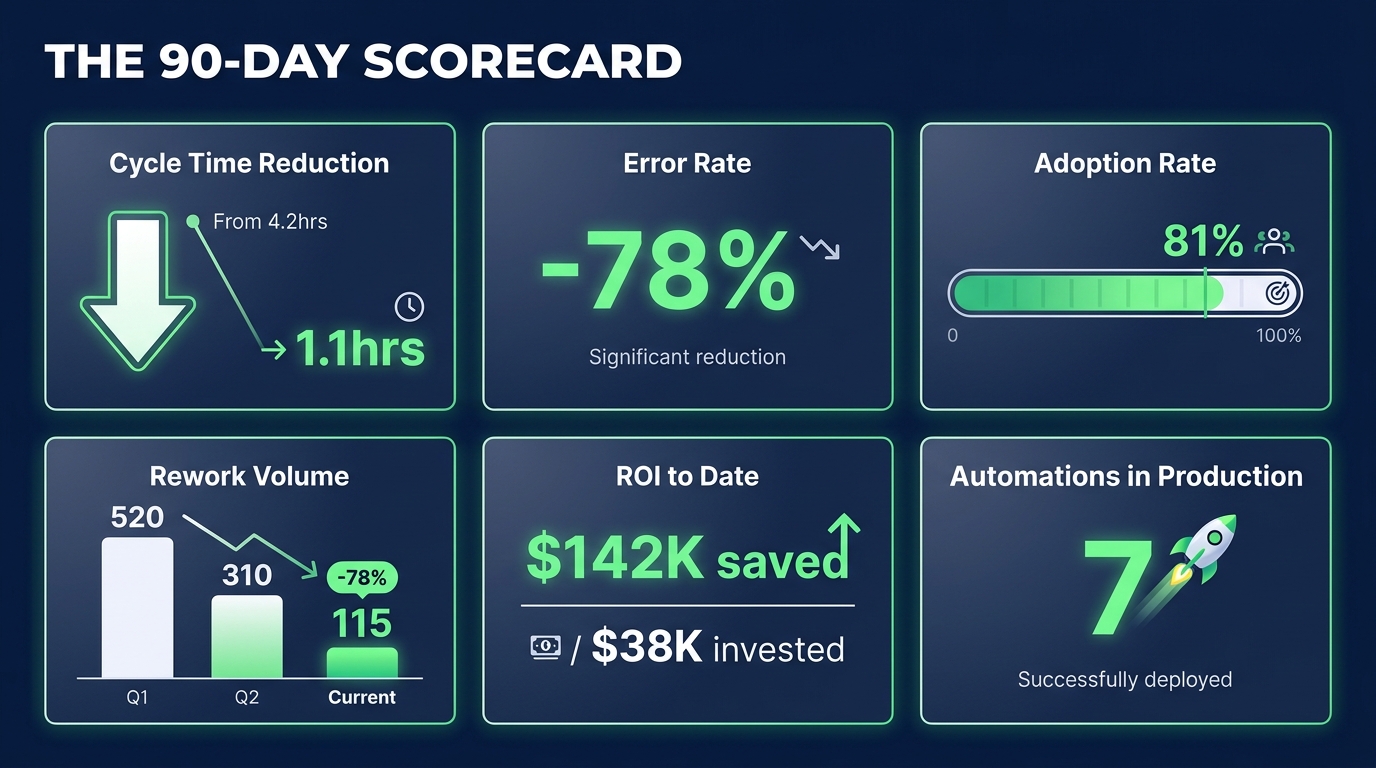
At the end of 90 days, the program needs to produce a scorecard that answers one central question: should this organization continue investing in AI automation? Everything else in this section serves that question.
The Six Core Metrics and Their Targets
Based on published benchmarks from recent operational automation programs, here are the target ranges that distinguish high-performing programs from average ones:
Cycle Time Reduction: High-performing programs achieve 50–75% reduction in average cycle time for the automated workflow. Anything above 30% represents a clear operational win. Below 20%, question whether the workflow was the right target.
Error Rate: Target is at or below 50% of the pre-automation baseline. If the human baseline error rate was 8%, the automated process should be at 4% or below. Many well-configured automations achieve significantly better than this on structured workflows.
Adoption Rate: 80% or higher of the target user population actively using the automation as designed, without systematic workarounds. Programs below 60% have an adoption problem that will compound over time.
Exception Rate: The optimal range is 5–15% of total volume. Below 5%, checkpoints may need to be recalibrated — they may be too lax. Above 20%, the automation’s scope or decision logic needs refinement.
Rework Volume: Target is at or below 30% of pre-automation rework volume. This is often the last metric to improve because it requires both automation accuracy and downstream integration to be working well simultaneously.
Realized ROI: At 90 days, the program should be cash-positive or tracking toward positive within 120 days. The calculation is: (labor hours saved × loaded hourly cost) + (error cost reduction) − (tooling cost + oversight labor). Programs that haven’t reached positive ROI by day 90 need a clear explanation of why and a credible path to it — not an optimistic narrative about future potential.
Beyond the Numbers: The Qualitative Scorecard
Numbers tell most of the story, but not all of it. Three qualitative dimensions should also be assessed at the 90-day mark:
Team Capability Growth: Are the people who ran this pilot now materially more capable of designing and deploying the next automation? A successful program builds internal capability, not just a single automation. If the team feels like they ran a vendor-managed project rather than built something themselves, the next initiative will be just as hard as the first one.
Documentation and Knowledge Transfer: Is everything learned during the 90 days documented in a format that someone who wasn’t part of the pilot could use to run a similar initiative? This documentation is the organization’s return on investment in learning — and without it, every future automation program starts from scratch.
Stakeholder Confidence: Do the executive sponsor, the frontline operators, and the process owner believe the program is on the right track? Stakeholder confidence is a leading indicator — it predicts whether future investment will be funded and whether future pilots will have the organizational access they need to succeed.
The 90-Day Report Structure
The formal 90-day report should be concise and evidence-driven. Recommended structure: one page of headline metrics and decisions, one page of what worked and what didn’t, one page of the Phase 2 recommendation (what to automate next, what to improve in the current automation, and what the 90-day program will target). Keep it short. The data should make the argument, not the narrative.
What Comes After Day 90
The 90-day program is not the destination — it’s the foundation. What it produces, when run correctly, is not just one or two working automations. It produces a proven methodology, a capable team, an evidence base that makes future investment easier to secure, and an organizational muscle memory for how to scope, build, govern, and measure AI automation.
The organizations that build durable automation capability don’t treat each initiative as a separate project. They treat the first 90-day program as the proof-of-concept for a continuous capability that lives inside the operations function permanently. The process owner becomes the automation champion. The automation champion builds the internal Center of Excellence. The CoE defines the standards that let future automations move faster and fail less often.
That progression takes 18–24 months, not 90 days. But it can only begin at day 1, with a scoped workflow, a named owner, clean baselines, and the discipline to build governance before you build the automation.
Everything else follows from that sequence. Start there. Prove it there. Then expand.
90-Day Operator’s Checklist:
☑ Target workflow selected and baseline documented
☑ Team roles assigned (process owner, builder, data steward, governance lead, frontline liaison)
☑ Governance layer documented (data quality, ownership, checkpoints, audit trails)
☑ Shadow mode completed with accuracy profile above threshold
☑ Controlled deployment staged across weeks 5–8
☑ Six core metrics tracked weekly from day 31
☑ Scope gate in place and change request process active
☑ Day 60 scale/optimize/terminate decision made from data
☑ Phase 3 second automation scoped and underway
☑ 90-day scorecard completed and Phase 2 roadmap submitted